Abstract
An important factor in the crystallization, and subsequent structural determination, of integral membrane proteins is the ability to produce a stable and monodisperse solution of the protein. Obtaining the correct purification detergent to achieve this can be laborious and is often serendipitous. In this study, high-throughput methods are used to analyze the suitability of eight different detergents on the stability of 12 inner transmembrane proteins from Escherichia coli. The best results obtained from the small-scale experiments were scaled up, the aggregation state of the proteins assessed, and all monodisperse protein solutions entered into crystallization trials. This resulted in preliminary crystallization hits for three inner membrane proteins: XylH, PgpB and YjdL and this study reports the methods, purification procedures and crystallization conditions used to achieve this.
Introduction
The over-expression of recombinant integral membrane proteins for structural biology is becoming increasingly commonplace, and correspondingly, their numbers in the protein databank (PDB, http://www.wwpdb.org (Berman et al. Citation2003)) have been rising exponentially (White Citation2004, McLuskey et al. Citation2009). However, while they comprise around 30% of the average genome (Krogh et al. Citation2001), integral membrane proteins still only represent a small minority (around 1%) of the total protein structures in the PDB. As membrane proteins make up more than 50% of current drug targets, and are targeted by around 60% of all prescription drugs (Drews Citation2000), it is important to find methods that will reliably help in producing more crystallographic structures.
In order to crystallize a protein, it is important to achieve a pure, stable, monodisperse solution. Identifying suitable conditions for crystallization studies of integral membrane proteins can often prove difficult, mainly as a result of the proteins being embedded in the amphipathic lipid bilayer of the cell membrane. In order to purify the protein this bilayer needs to be solubilized. Detergent molecules replace the lipids surrounding the protein and cover the hydrophobic integral membrane-section that traverses the cell membrane. This helps simulate the natural environment of the transmembrane protein allowing it to remain stable in an aqueous solution and it is the resulting protein-detergent complex (PDC) that is subsequently purified and crystallized (Prive Citation2007). To maintain the PDC, and minimize the chances of protein aggregation and denaturation, detergents are generally kept in all buffers after solubilization.
A typical detergent molecule is similar in nature to lipids, being composed of a hydrophilic head group and a hydrophobic tail. However, unlike lipids, detergents do not form bilayers, but colloidal aggregates known as micelles. These are formed once a certain concentration of detergent in solution has been reached, known as the critical micelle concentration (CMC), and this parameter is specific to each detergent. In general, after solubilization has been achieved the detergent concentration should be kept above its CMC throughout purification and crystallization, with around double the CMC being a reasonable starting point.
Choosing a detergent that is best suited to stabilizing and crystallizing an integral membrane target protein is often difficult. This choice depends on several factors including: its ability to remove the protein from the membrane (solubilization); its capacity for maintaining the protein in a monodisperse and stable state; and the eventual effect it has on crystallization. The process of identifying these parameters can be time-consuming and is often serendipitous. Consequently, it is beneficial to examine the effect of several detergent systems in parallel.
The solubilization of inner transmembrane proteins is often achieved using the detergent n-Dodecyl-β-D-maltopyranoside (DDM). Detergents with long alkyl chains, such as DDM, require concentrations much higher than their CMC to achieve membrane solubilization and typically DDM is used at concentrations of between 1 and 1.5%, which is around 100–150 times its CMC. However, the benefit of long chained detergents is that they have been shown to be very effective at preserving protein activity (Prive Citation2007). Conversely, detergents with shorter alkyl chains, such as n-Octyl-β-D-glucopyranoside (β-OG), disrupt the cell membrane at low concentrations, often just above their CMC, but are more likely to denature the proteins (Prive Citation2007).
This study employs high-throughput (HTP) techniques to investigate the suitability of eight different detergents (D1–D8, ) for the purification, and subsequent crystallization of 12 integral membrane proteins solubilized in DDM. The 12 target proteins (P1–P12, ) were chosen from the Escherichia coli inner membrane proteome (Daley et al. Citation2005). All of these clones encoded the protein with a C-terminal fusion consisting of a tobacco-etch virus protease (TEVP) recognition site, green fluorescent protein (GFP) and an octa-histidine (His) tag (MP-GFP-His) (Daley et al. Citation2005). An initial set of 40 proteins was selected from the proteome based on the following criteria: to have cytoplasmic C-termini; to be of known (or inferred) function; and to have at least four (predicted) transmembrane helices. The proteins that met these criteria were further selected by analyzing small-scale overexpression experiments and choosing those which were shown to grow to an OD600 of >45 with a GFP activity of >1.5 (Daley et al. Citation2005). This gave the best probability that the proteins would express well and correctly fold in the membrane, respectively. The latter statement is based on the assumption that GFP only fluoresces when it is properly folded in the cytoplasm, and that it will only achieve this when the target protein is inserted correctly into the membrane (Daley et al. Citation2005). Consequently, monitoring the GFP fluorescence provides an extremely useful tool to visibly trace the purification of the proteins and it was used to observe the presence and stability of the proteins throughout the purification protocol.
Table I. Detergent properties. List and amounts of the eight detergents (D1–D8) used for protein purification. The detergents n-Dodecyl-β-D-maltopyranoside (DDM), n-Decyl-β-D-maltopyranoside (DM), n-Octyl-β-D-glucopyranoside (β-OG), n-Nonyl-β-D-glucopyranoside (NG), N-Dodecyl-N-N-dimethylamine-N-oxide (LDAO), CYMAL-5 (CY-5), Fos-choline-14 (FC-14) and ANAPOE-C12E8 (C12E8) are numbered D1–D8 in this study, respectively. The approximate critical micelle concentration (CMC) values were taken from Anatrace Inc.
Table II. Proteins used in this study. The 12 membrane proteins used in this study are denoted P1–P2. The ID refers to their gene names, and the corresponding Uniprot accession codes are provided. FLC refers to the molecular weight of the full-length construct including TEV cleavage site, GFP fusion and His-tag. CC is the molecular weight of the cleaved construct (full-length protein plus GSENLYFQ from the vector and cleavage site). The number of predicted transmembrane helices (TM) was calculated using TMHMM (Krogh et al. Citation2001).
In addition to the GFP, the His-tag and TEVP cleavage site allow the use of a quick and reliable two-step purification using immobilized metal ion affinity chromatography (IMAC). This is often used as a first-step purification allowing rapid isolation of the target protein. However, the high purity necessary in structural biology frequently requires additional purification steps. Using His-tagged TEVP to cleave the tag from the target proteins allows a second round of IMAC to be used to bind the cleaved tag, the tagged protease and any histidine rich contaminants from the initial purification, leaving the purified target protein in the flow-through.
In this study, all proteins were solubilized in 1.5% DDM and subsequently purified using DDM, n-Decyl-β-D-maltopyranoside (DM), β-OG, n-Nonyl-β-D-glucopyranoside (NG), N-Dodecyl-N-N-dimethylamine-N-oxide (LDAO), CYMAL-5 (CY-5), Fos-choline-14 (FC-14) and ANAPOE-C12E8 (C12E8) (all detergents were purchased from Anatrace Inc.). They were used at concentrations of around 2–4 times their CMC values () with the exception of FC-14, which was used at ∼ 8 times to resemble the conditions used to successfully crystallise the mechanosensitive ion-channel MscS from E. coli (Bass et al. Citation2002).
The information gained from the HTP experiments was subsequently used to scale-up the purification protocols, and set up crystallization trials. Using these techniques the initial crystallization conditions for three integral membrane proteins were determined. Crystals were obtained for: XylH, the membrane spanning component of the ABC transporter XylFGH (a D-xylulose transport system); YjdL, a peptide transporter; and PgpB, an inner membrane phosphatidylglycerophosphatase.
Material and methods
Preparation of membranes for high-throughput purification
The 12 MP-GFP-His constructs were transformed into E. coli C41 (DE3) cells for protein expression. Successful transformants were selected on Luria-Bertani kanamycin (30 μg ml-1) (LBK) agar plates and cultured into 15 ml LBK starter cultures grown at 37°C overnight with constant shaking. Starter cultures were subsequently diluted into 500 ml LBK to an optical density at 600 nm (OD600) of 0.1 and grown at 37°C to an OD600 of 0.6–0.7 before being induced with 0.4 mM isopropyl-β-D-thiogalactopyranoside (IPTG). The culture was left overnight at 25°C with constant shaking and the cells were harvested by low speed centrifugation (3,500 g, 20 min, 4°C).
Cells were resuspended in 50 mM Tris-HCl pH 7.5 containing a Complete EDTA-free protease inhibitor tablet (Roche), DNase (Sigma) (50 U/ml) and 1 mM MgCl2, and lysed by three passages through a French pressure cell at 14,000 psi (internal pressure). The lysate was cleared by centrifugation (8,000 g, 30 min, 4°C) and the cell membranes isolated from the supernatant by ultracentrifugation (100,000 g, 60 min, 4°C). The membrane pellets were resuspended and homogenized in 50 mM Tris-HCl pH 7.5, 10% glycerol, using a 21-gauge needle, and then flash frozen in liquid nitrogen and kept at −80°C until required.
In preparation for the HTP purification, membrane samples containing the 12 target proteins (P1–P12) were defrosted on ice and diluted with 20 mM Tris-HCl pH 7.5, 50 mM NaCl, to a total protein concentration of ∼ 40 mg/ml, based on absorbance at 280 nm (A280) and an assumed extinction coefficient of 1 (0.1% solution) (mg ml-1)-1 cm-1. The solubilization detergent, DDM, was added to a final concentration of 1.5% (w/v) and the samples incubated at 4°C for 1 h, before being cleared by ultracentrifugation at 100,000 g for 45 min.
High-throughput purification
The high-throughput methods used in this study are described in detail elsewhere (McLuskey et al. Citation2008) but will be presented here briefly and summarized in . A 96-well filter plate (Ni2+-plate) (QIAfilter, Qiagen) was set up as 96 individual Ni2+-affinity columns, containing 250 μl NiNTA Superflow resin (Qiagen). Each row (A–H) of the Ni2+-plate was equilibrated using a different purification detergent (D1–D8) prepared in 20 mM Tris-HCl pH 7.5, 150 mM NaCl (purification Buffers B1–B8). Throughout the purification the 12 protein samples (P1–P12) were confined to columns 1–12, respectively. A schematic representing this standard purification block, and the grid system used, is shown in .
Figure 1. High-throughput purification procedure. This schematic outlines the progress of 12 membrane proteins solubilized in DDM throughout the high throughput purification protocol. (a) Standard purification block representing the grid system: D1–D8 represent the eight different detergents used in rows A–H and proteins P1–P12 are confined to columns 1–12, respectively.
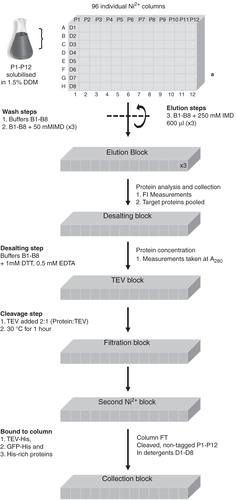
The 12 solubilized membrane samples were split into eight equal aliquots and loaded onto columns 1–12 of the Ni2+-plate. In order to exchange the samples into the purification detergents, rows A–H of the Ni2+-plate were washed with Buffers B1–B8, respectively. This was followed by three washes in the same buffers containing an additional 50 mM imidazole. Finally, samples were eluted from the Ni2+-plate using 600 μl of the purification buffers containing 250 mM imidazole and collected in a 96-well deep well block (DWB). In order to obtain sufficient material the last step was repeated three times and the collected fractions pooled.
To identify the fractions containing the purified fusion proteins and to determine the efficiency of binding to the Ni2+-columns, fluorescence intensity (FI) measurements were taken of the solubilized membranes and all elution fractions. This was achieved using a 96-well plate fluorescence reader (FLUOstar OPTIMA, BMG Labtech), at an excitation wavelength of 465 nm and an emission wavelength 512 nm. All samples found to contain the target proteins were pooled into a clean DWB.
To remove imidazole, the pooled protein samples were split into 100 μl aliquots and applied to a 96-well desalting plate (Zeba, Pierce) equilibrated in Buffers B1–B8, containing 1 mM dithiothreitol (DTT) and 0.5 mM ethylendiamintetraacetic acid (EDTA). The protein was collected into a fresh DWB by centrifugation at 1,000 g for 2 min and this step repeated until all of the protein was desalted. After the desalting step, the protein concentrations of the samples were determined by measuring the A280 (as above) using special optics, black-walled, clear-bottomed 96-well microplates (Corning).
The desalted protein samples were mixed with His-tagged TEVP in a molar ratio of 2:1 (Protein:TEVP) based on the highest protein concentration measured. The protease reactions were left to work at 30°C for 1 h, after which time the samples were filtered through a QIAFilter plate (Qiagen) to remove any precipitation. To remove TEVP, the GFP-His tag and any other histidine rich contaminants from the cleaved protein, the filtered samples were loaded onto a second Ni2+-plate equilibrated in Buffers B1–B8. Flow-through, containing the cleaved, non-tagged, target proteins P1–P12, in detergents D1–D8, was collected for further analysis.
To visualize the presence of the purified membrane proteins, the EZQ protein quantitation kit (Invitrogen) was used. This was achieved by pipetting 10 μl of each collected protein sample onto assay paper and fixing it by soaking in methanol. The samples were then stained using the commercial EZQ protein quantitation reagent and the fluorescence was visualized on an In Vivo Imaging System (IVIS, Caliper life sciences) with the excitation and emission wavelengths set to 465 and 620 nm, respectively.
Scaled up protein purification
In order to obtain enough purified protein for use in crystallization trials, membranes from 3 litres of cell culture, expressing a single membrane protein fusion, were prepared and the protein solubilized in DDM as described above. Initial purification detergents were chosen from the most encouraging results obtained from the HTP purification experiments. The solubilized membranes were centrifuged at 100,000 g for 45 min at 4°C and loaded onto a 5 ml HisTrap affinity column (GE Healthcare), equilibrated in 20 mM Tris-HCl pH 7.5, 150 mM NaCl containing the chosen detergent. The column was then washed in the same buffer containing 50 mM imidazole and the proteins eluted with 250 mM imidazole. As a result of the GFP, the membrane protein fusion was green and the coloured fractions were collected separately.
The membrane protein fusion was dialysed overnight at 4°C against 20 mM Tris pH 7.5, 150 mM NaCl, 1 mM DTT, 0.5 mM EDTA plus the detergent and the protein concentration was determined spectrophotometrically using a theoretical extinction coefficient (M-1 cm-1) calculated using ProtParam (CitationGasteiger et al. 2005). The GFP-His tag was removed by the addition of TEVP as described above and the samples centrifuged to remove any precipitation (13,000 g, 10 min, 4°C). The supernatant was loaded onto a second identical HisTrap column and the flow-through collected. No GFP fluorescence was observed in the flow-through, confirming that the GFP-His tag had remained bound to the column, leaving the cleaved and purified protein in the flow-through.
The protein was then concentrated (Vivaspin concentrator; 50–100 kDa cut-off, Sartorius) to around 0.5 ml before being analyzed and further purified using size-exclusion chromatography. This was achieved by applying the protein onto a Superdex 200 10/300 column (GE Healthcare) equilibrated in 20 mM Tris pH 7.0, 150 mM NaCl, 5% glycerol plus detergent, and run in the same buffer.
Following size-exclusion chromatography, the purified proteins were concentrated to between 5–10 mg ml-1. Initial crystallization experiments were performed using the commercially available screens MemStart, MemSys, MemGold (Molecular Dimensions [Iwata Citation2003, Newstead et al. Citation2008]) and PEG/Ion screens 1 and 2 (Hampton Research). Vapour diffusion screens were carried out in 96-well sitting drop plates (Innovadyne) containing 500 nl protein plus 500 nl reservoir against a 50 μl reservoir solution. Initial crystal hits were optimized in both 96-well plates (above) and in 24-well sitting-drop plates (Cryschem, Hampton) using 2 μl protein plus 2 μl reservoir against 500 μl of reservoir. All crystallization experiments were carried out at 20°C. Crystals were tested in-house, and at Diamond Light Source (DLS).
Results and discussion
High-throughput purification screening
Throughout the process of protein purification, HTP methods were used to monitor the stability of 12 integral membrane proteins in eight different detergents. Solubilizing the 12 protein samples in 1.5% DDM and loading them onto eight Ni2+ columns each equilibrated in a different detergent resulted in very little fluorescence being observed in the flow-through (data not shown). Consequently, it appears that the purification detergents did not have an adverse effect on protein binding and that all of the protein-detergent complexes bound equally well to the Ni2+ resin.
The flow-through from the second Ni2+ plate contained all of the cleaved, and hence non-tagged proteins, which had remained soluble and stable throughout the HTP purification process. More specifically, it contained protein samples that had been successfully purified in a suitable detergent. The EZQ protein quantitation kit was used to quantitate the relative amounts of purified protein in each detergent. The highest fluorescence signal observed in each condition for P1–P12 (i.e., the sample with the largest amount of protein) was assumed to be the sample containing the best purification detergent and a suitable starting condition for scaling up future purification attempts.
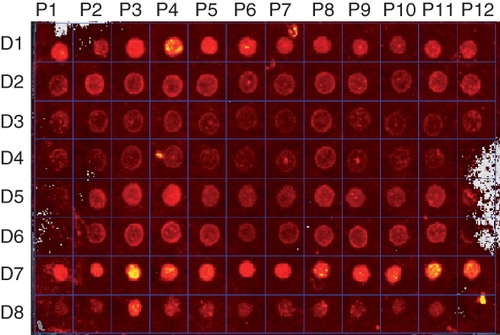
The quantitation of the cleaved integral membrane proteins showed variations in how the different proteins behaved in the various detergents (). Proteins P3, P4, P5, P8 and P9 were found to purify well in all eight detergents. In addition, all proteins could be purified to some extent when DDM and FC-14 were used, and in the most extreme case P1 was only detected when these two detergents were used.
Figure 2. Protein detection using fluorescence. Membrane proteins P1–P12 in detergents D1–D8 were labelled with the fluorescent EZQ dye and visualized using an In Vivo Imaging System at excitation and emission energies of 465 and 620 nm, respectively. This Figure is reproduced in colour in the online version of Molecular Membrane Biology.
Scale up
Using HTP methods allowed an initial purification detergent to be chosen, and a scaled up purification to be carried out for P1–P12. In general, when DDM and FC-14 both looked like suitable purification detergents, DDM was chosen first; a decision made primarily on cost. When the initial scale up detergent produced poor results a second detergent would be chosen from the HTP screen and a new purification carried out. However, when the size exclusion chromatography gave poor results, and the protein yield permitted, secondary detergents were introduced during this step. This allowed the effect that the two detergents had on the monodispersity of the protein to be directly compared. Any protein samples that appeared monodisperse from the size exclusion column were concentrated in the same buffer and put forward into crystallization trials. Protein purity was monitored throughout using SDS-PAGE analysis (for examples see ).
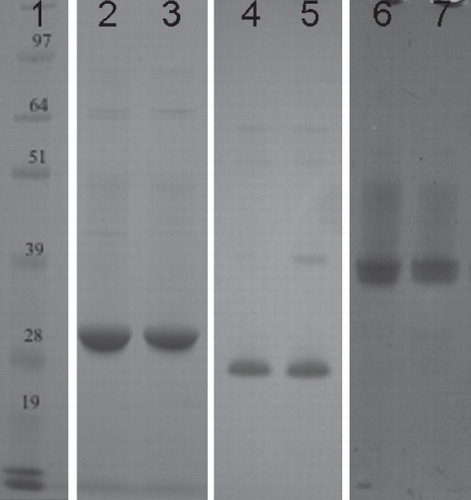
Figure 3. SDS-PAGE analysis of the purified proteins. This is a composite figure constructed using images from different gels, all aligned against the same molecular weight marker. Peak fractions taken after size-exclusion chromatography were incubated at 37°C for 30 min before being analyzed on an SDS-PAGE gel and stained with Coomasie Blue. All of the proteins migrated lower than expected for their predicted molecular weights, a phenomenon often observed for helical membrane proteins (Rath et al. Citation2009). Lane 1, molecular weight marker; Lanes 2–3, XylH; Lanes 4–5: PgpB and Lanes 6–7: YjdL. 4–12% Bis-Tris gels (Novex) were used and run in MOPS buffer, at 200 V for ∼ 50 min.
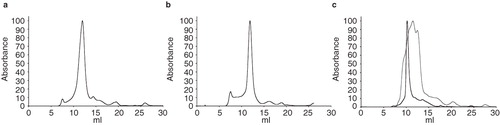
Using these methods, three proteins yielded crystals when DDM was chosen as the primary detergent: PgpB (P8), XylH (P6) and Yjdl (P12). Of these, PgpB and YjdL both produced a single peak on the size exclusion column when 0.04% DDM was kept in the purification buffers (, ). However, the results from the size exclusion column for XylH were very different, with the protein appearing highly dispersed with multiple peaks running over a larger elution volume (). Using the HTP results, 0.04% FC-14 was chosen as a secondary detergent for use on the size-exclusion column. This improved the peak profile dramatically (), making the protein better suited for crystallization experiments.
Figure 4. Size exclusion chromatography. Plots from size-exclusion chromatography, (a) PgpB is monodisperse in DDM, (b) YjdL is monodisperse in DDM, and (c) XylH is polydisperse in DDM (frey) and monodisperse in FC14. The void volume of the column was 7.7 ml. All absorbance data were normalized, by setting the maximum absorbance to 100 arbitrary units, using GraphPad Prism (Version 4.00 for Mac OSX, USA).
Crystallization
PgpB
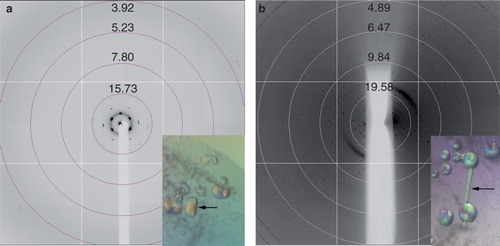
The yield of purified PgpB obtained was typically in the region of 1 mg l-1 and the protein was concentrated to ∼ 10 mg ml-1 for crystallization trials. Initial crystals (∼ 70 μM × 40 μM × 20 μM) were obtained within four weeks against a reservoir solution of 40 mM Tris pH 8.0, 40 mM NaCl, 27% (v/v) PEG 350 MME (MemGold, condition 27). The crystals were prepared for X-ray diffraction analysis by a quick soak in a cryo-solution comprising the reservoir plus 20% ethylene glycol and then flash-cooled to 100 K in a stream of cooled nitrogen gas (Oxford Cryosystems). These crystals diffracted to around 15 Å using beamline I02 at DLS () with a distance of ∼ 45 Å between the spots of the hexagonal lattice. Based on this diffraction pattern, it was unclear whether the crystals were composed of protein and/or DDM. However, in an attempt to improve these crystals optimization around the original conditions was carried out. The protein was prepared for optimization screens by splitting the protein peak, obtained from the gel filtration column, into two fractions so that one fraction μcontained the leading peak and the other the trailing edge. Crystals were only obtained using the protein from trailing edge of the peak and were produced in 96-well plates. Narrow rods (∼ 120 μM × 20 μM × 20 μM) appeared within 2–3 weeks using a reservoir solution of 0.1 M Tris, pH 8.0–8.5, 40 mM NaCl and 25% (v/v) PEG 400. These crystals typically diffracted beyond 10 Å with diffraction spots frequently observed anisotropically to around 4 Å, in one direction only (), using beamline I03 at DLS. No additional cryo-protection was used.
Figure 5. Crystals and diffraction patterns obtained from PgpB crystallization trials. (a) Initial crystals diffracted to around 15 Å, (b) Improved crystals diffracted anisotropically to approximately 4 Å. All diffraction images were collected on beamline I03 at Diamond Light Source using a wavelength of 0.9763 Å and an oscillation range of 1.0°. This Figure is reproduced in colour in the online version of Molecular Membrane Biology.
YjdL
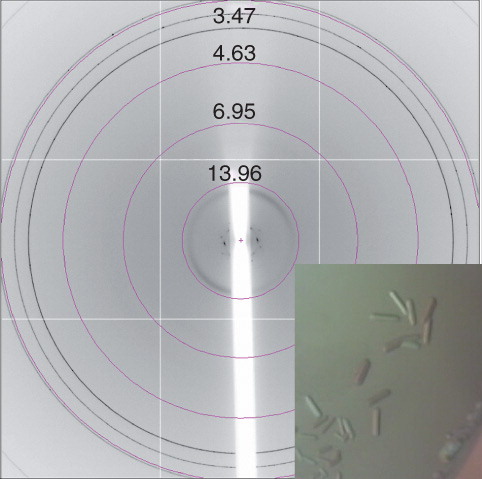
Purification of Yjdl produced a yield of ∼ 1.5 mg l-1 and small single rods appeared in around two weeks using a protein concentration of around 11 mg ml-1. These crystals were found in condition 42 of the Peg/Ion2 screen (20% [w/v] Peg3350, 20 mM CaCl2, 20 mM CdCl2, 20 mM CoCl2), although they were too small to be tested. Several optimization screens were set up around this condition with the best crystals appearing in 26% (w/v) PEG 2,000, 20 mM CdCl2 and 20 mM CoCl2 (). These crystals were extremely small (∼ 50 μM × 20 μM × 10 μM) and fragile, and were flash frozen straight from the drop before being taken to beamline I03 at DLS where they diffracted to around 17 Å ().
Figure 6. Crystals and diffraction patterns obtained from YjdL crystallization trials diffracting to ∼ 17 Å. Diffraction images were collected on beamline I02 at Diamond Light Source using a wavelength of 0.9796 Å and an oscillation range of 1.0°. This Figure is reproduced in colour in the online version of Molecular Membrane Biology.
YjdL was purified in both DDM and FC-14 using protein concentrations from 5–14 mg ml-1 and a variety of precipitants and additives. Unfortunately, even though crystals were obtained using a variety of optimized conditions, neither their size nor their quality improved and while it was assumed that these were crystals of YjdL, the poor data quality meant that detergent crystals could not be ruled out.
XylH
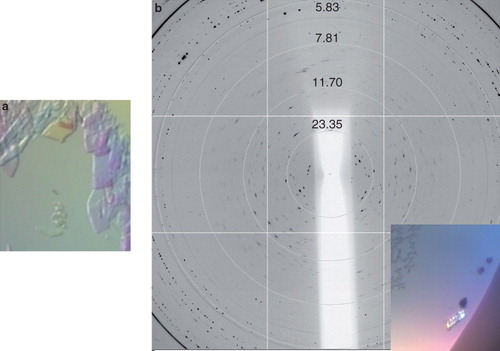
XylH proved very stable when purified using FC-14 as a secondary detergent in the final size exclusion step producing a yield of around 1.3 mg l-1 and allowing protein concentrations of up to 40 mg ml-1 to be achieved. For crystallization trials, XylH was concentrated to ∼ 9.5 mg ml-1 and thin, plate-like birefringent crystals appeared almost immediately using 0.1 M Tris pH 8.5, 1.5 M lithium sulphate (condition 19, MemGold) (), Unfortunately, these crystals disappeared within an hour. Scaling up this condition and designing other optimization screens in 24-well plates produced one further crystal (∼ 40 μM × 20 μM × 20 μM). This appeared within two weeks using the same protein and reservoir concentrations as the original hit but was unfortunately composed of multiple plates (). The crystal was prepared for X-ray diffraction analysis by a quick soak in a cryo-solution comprising the reservoir plus 20% ethylene glycol and then flash-cooled to 100K in a stream of cooled nitrogen gas (Oxford Cryosystems). The crystal was transferred to beamline I02, DLS, where it diffracted to about 7 Å (). Although diffraction from the XylH crystal was highly anisotropic and exhibited ice-rings, it did show great potential for further optimization of both the cryo-solution and the crystallization conditions.
Figure 7. Xylh crystals and corresponding diffraction patterns. (a) Initial crystal which disappeared within 20 min, and (b) a cluster of crystals diffracting to approximately 7 Å. Diffraction images were collected on beamline I03 at Diamond Light Source using a wavelength of 0.9763 Å and an oscillation range of 1.0°. This Figure is reproduced in colour in the online version of Molecular Membrane Biology.
Conclusion
Using HTP purification methods on 12 inner membrane proteins provided a quick and easy way to identify both proteins and corresponding purification detergents that could prove amenable to structural studies. For this set of proteins DDM and FC-14 stood out as being particularly successful in producing cleaved and purified inner membrane proteins. Using the information gained from the HTP experiments and adapting it for use in standard purification protocols resulted in the crystallization of three integral membrane proteins from E. coli.
Acknowledgements
This work was funded by the Membrane Protein Structure Initiative (MPSi) from the Biotechnology and Biology Sciences Research Council (BBSRC) for IB, NWI and KMcL, a BBSRC grant (BB/G011389/1) for MG and AJR, and the University of Glasgow and Westchem for a studentship for FK. The funding sources had no influence on the work done. We thank Diamond Light Source for access to beamline I02 and I03 (Proposal number MX1229) that contributed to the results presented here. We acknowledge Dr Dan Daley, University of Stockholm, Sweden, for his generous gift of all constructs, Mr Ryan Ritchie for assistance with the IVIS, and Dr Aleks Roszak for useful discussions.
Declaration of interest: The authors report no conflicts of interest. The authors alone are responsible for the content and writing of the paper.
References
- Bass RB, Strop P, Barclay M, Rees DC. 2002. Crystal structure of Escherichia coli MscS, a voltage-modulated and mechanosensitive channel. Science 298:1582–1587.
- Berman H, Henrick K, Nakamura H. 2003. Announcing the worldwide Protein Data Bank. Nat Struct Biol 10:980.
- Daley DO, Rapp M, Granseth E, Melen K, Drew D, von Heijne G. 2005. Global topology analysis of the Escherichia coli inner membrane proteome. Science 308:1321–1323.
- Drews J. 2000. Drug discovery: A historical perspective. Science 287:1960–1964.
- Gasteiger E, Hoogland C, Gattiker A, Duvaud S, Wilkins MR, Appel RD, Bairoch A. Protein Identification and Analysis Tools on the ExPASy Server; (In) John M. Walker (ed): The Proteomics Protocols Handbook, Humana Press (2005). pp. 571–607.
- Iwata S. Crystallization Informatics of Membrane Proteins, 281–294 2003, in: METHODS AND RESULTS IN CRYSTALLIZATION OF MEMBRANE PROTEINS, ed: Iwata S.
- Krogh A, Larsson B, von Heijne G, Sonnhammer EL. 2001. Predicting transmembrane protein topology with a hidden Markov model: Application to complete genomes. J Mol Biol 305:567–580.
- McLuskey K, Gabrielsen M, Kroner F, Black I, Cogdell RJ, Isaacs NW. 2008. A protocol for high throughput methods for the expression and purification of inner membrane proteins. Molec Membr Biol 25:599–608.
- McLuskey K, Roszak AW, Zhu Y, Isaacs NW. 2009. Crystal structures of all-alpha type membrane proteins. Eur Biophys J 39:723–755.
- Newstead S, Ferrandon S, Iwata S. 2008. Rationalizing alpha-helical membrane protein crystallization. Protein Sci 17:466–472.
- Prive GG. 2007. Detergents for the stabilization and crystallization of membrane proteins. Methods 41:388–397.
- Rath A, Glibowicka M, Nadeau VG, Chen G, Deber CM. 2009. Detergent binding explains anomalous SDS-PAGE migration of membrane proteins. Proc Nat Acad Sci USA 106:1760–1765.
- White SH. 2004. The progress of membrane protein structure determination. Protein Sci 13:1948–1949.