Abstract
In this work, we describe a process for production of a Pichia pastoris strain which overproduces large quantities of the human glycine receptor. Subsequent purification yielded functional, uniform protein with expression yields of up to 5 mg per liter cell culture. As the wild-type protein is prone to proteolytic degradation, the labile sites were removed by mutagenesis resulting in an intracellular loop 2 deletion mutant with N-terminal modifications. This variant of the receptor is both stable during purification and storage on ice for up to a week as a complex with an antagonist. The quality of the protein is suitable for biophysical characterization and structural studies. The interaction of the agonist glycine and the antagonist strychnine with purified protein was analyzed by isothermal titration calorimetry. Strychnine binding is driven enthalpically with a KD of 138 ± 55 nM, a ΔH of −9708 ± 1195 cal/mol and a ΔS of −1.0 ± 4.1 cal/mol/K, whereas glycine binding is driven by entropy with a KD of 3.2 ± 0.8 μM, a ΔH of −2228 ± 1012 cal/mol and ΔS of 17.7 ± 2.8 cal/mol/K. Strychnine and glycine binding is competitive with a stoichiometry of one ligand molecule to one pentameric glycine receptor.
Introduction
The human glycine receptor belongs to the group of pentameric ligand-gated ion channels (LGIC), which are known to permit cells to rapidly respond to changes to their external environment and mediate fast neurotransmission in the nervous system. Individual subfamilies of LGIC's include the nicotinic acetylcholine receptor (nAChR), the serotonin type-3 receptor (5-HT3R) and the GABA type-A receptor (GABAAR) (Lynch Citation2004). These receptors share a conserved Cys-loop motif and a pentameric subunit structure that forms a central pore. Each subunit exhibits four transmembrane helices, a large intracellular loop (loop 2) that is located between transmembrane helix three and four (Legendre Citation2001, Lynch Citation2004, Sine and Engel Citation2006) and an extracellular N-terminal region that harbors the neurotransmitter-binding domain and the Cys-loop motif, respectively (Unwin Citation2003, Hilf and Dutzler Citation2008). Earlier work has shown that affinity purified glycine receptors retain functional ligand gated ion channel activity when reconstituted in liposomes (Garcia-Calvo et al. Citation1989, Riquelme et al. Citation1990, Cascio et al. Citation2001). The architecture of the glycine receptors comprises five different subunits, namely α1–α4 and β (Betz and Laube Citation2006, Lynch Citation2009), these form heteropentameric complexes in a 2α:3β stoichiometry (Grudzinska et al. Citation2005). Interestingly, a homopentameric receptor of only α subunits is functional (Lynch Citation2004). Glycine receptors represent the major inhibitory neurotransmitter receptor system in the brainstem and are found at the spinal cord as well as in higher brain regions (Betz Citation1991). They are responsible for the control of excitability of neuronal networks that modulate motor control, respiration and pain (Legendre Citation2001, Lynch Citation2004, Harvey et al. Citation2004) and are considered to be important drug targets.
While there are many properties required for a substance to become a drug, typical characteristics are binding with high affinity and selectivity to the target. Binding affinities are defined by the Gibbs free energy that consists of an enthalpic and entropic contribution. Both terms need to be optimized simultaneously and have to contribute favorably to binding, to generate the exceptionally high affinities characteristic for a good medicine (Chaires Citation2008, Freire Citation2008). Retrospective thermodynamic analysis across the class of FDA-approved HIV-1 protease drugs and statins revealed that the first drugs launched had entropically driven binding modes, whereas later compounds displayed a much larger enthalpic contribution of binding with higher selectivity (Freire Citation2008). Therefore, thermodynamic profiling has gained considerable interest in drug discovery, by complementing structural studies, providing experimental data for the molecular driving forces of binding and helping to understand the effects of substituent changes on binding affinities (Henry Citation2001, Weber and Salemme Citation2003).
Isothermal titration calorimetry (ITC) is a label-free method that profiles the thermodynamic parameters for a given reaction, e.g., binding of ligand to a membrane protein (MP) (Chaires Citation2008). However, the high protein quantities required for ITC often limits its applicability to targets that can readily be produced. For MP the examples presented in literature comprise only bacterial proteins such as the transferrin receptor TbpA and TbpB (Krell et al. Citation2003), the zinc transporter YiiP (Chao and Fu Citation2004, Wei and Fu Citation2005), the outer-membrane-iron transporter FhuA (Destoumieux-Garzon et al. Citation2005), the vitamin B12 receptor BtuB (Housden et al. Citation2005), the multidrug resistance proteins EmrE (Sikora and Turner Citation2005a) and SugE (Sikora and Turner Citation2005b), transhydrogenase (Bizouarn et al. Citation2005), photosystem II (Zimmermann et al. Citation2006), the membrane antiporter AdiC (Fang et al. Citation2007) and the heme-binding protein Surf1 (Bundschuh et al. Citation2009).
In this work, we have established a route for production of stable and homogeneous GlyR α1 receptors at milligram scale using Pichia pastoris as expression host. Moreover, we present a strategy to generate ITC data for MPs and show thermodynamic profiles for a complex system such as the human glycine receptor in complex with both an agonist and antagonist, respectively. To our knowledge, this is the first human MP presented in literature that is thermodynamically characterized using ITC.
Methods
Constructs
Multiple constructs of the glycine receptor (GlyR) were screened for total expression and strychnine binding; the four most tractable constructs are described in detail (). The numbering of amino acid residues (aa) is according to the mature full length isomer b including the 28 aa long native signal sequence. Constructs were codon optimized for production in P. pastoris, included a Kozak consensus sequence and were subcloned into vectors pPICZαC or pPICZC using EcoRI and NotI restriction enzymes (GenScript). The first construct carries an alpha mating factor signal sequence (α-MF), a C-terminal 6× His tag and codes for the native protein sequence (SWISSPROT:GLRA1_HUMAN isoform b, P23415-2 (Grenningloh et al. Citation1990)). Construct two is characterized by an α-MF, a TEV cleavage site at position R30, a C-terminal 6× His tag and a loop 2 deletion between E354 and K383. Construct three is similar to two, with an addition of a further modification of loop 2, where residues from H339-Q410 have been replaced by the short sequence VESQPA. Finally construct four resembles construct three but lacks the first two N-terminal aa for GlyR and has a TEV protease recognition sequence inserted before the C-terminal 6× His tag. The individual sequences are posted in the Appendix A and a summary of their characteristics is shown in and .
Figure 1. (A) Graphical representation of the four constructs. (B) Sequence comparison of the loop deletion region of the relevant constructs with the rat ortholog GLRA1_RAT. (C) Outline of the N-terminus of constructs 2–4; construct 1 is not listed, as a mixture of sequences was observed. It should be noted that all constructs except construct 4 possess N-terminal heterogeneity. The identified cleavage sites are marked with a ↓ and the given numbers correspond to the native GlyR protein sequence (isoform b, P23415-2). This Figure is reproduced in color in Molecular Membrane Biology online.
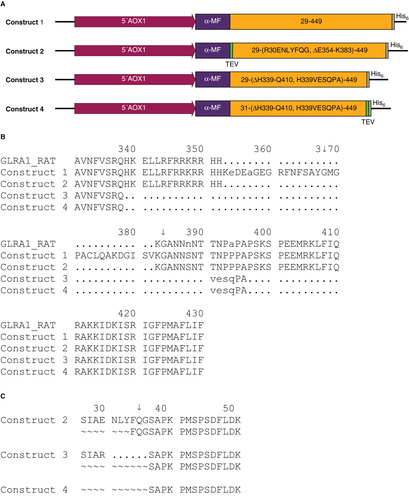
Table I. Representation of all constructs generated during this work. They differ in the position of the TEV cleavage site, length of loop 2, N-terminal and C-terminal tags, N-terminal modifications, P. pastoris strains and expression vectors. Only the first four constructs are discussed as those predominantly contribute to the outcome of this work.
The plasmids were linearized using PmeI restriction enzyme (New England BioLabs) and were transformed in P. pastoris strains SMD1168, SMD1168H or SMD1163H by electroporation. Details are described in . Four transformants of each construct were screened for the presence of recombinant gene by PCR (Invitrogen) and for protein expression by Western blot using anti-glycine receptor antibody (Sigma, #G0666).
Fermentation and protein expression
A Biostat® C biorecactor (B. Braun International, Melsungen, Hessen, Germany) with a working volume of 6.9 l was used to culture the P. pastoris strains SMD1168, SMD1168H and SMD1163H for recombinant protein expression. 2.5 l of BMGY media with 0.25 ml Antifoam 204 was inoculated with 250 ml of pre-culture to an initial OD600 ∼ 2. During cell growth, the temperature was set to 30°C and the pH was kept constant at 6.0 using ammonium hydroxide. The dissolved oxygen concentration was kept at 30% by regulating stirrer speed and airflow. After about 15 h the glycerol was fully consumed; at this time, 50% (w/v) glycerol supplemented with 12 ml/l of PTM1 trace salts (Zhang et al. Citation2003) was fed at 10 ml/h/l until the biomass has reached ∼ 200 g/l. The culture was adapted for induction over a 2 h period by reducing the glycerol feed to 1–5 ml/h/l, spiking with 0.05% methanol and lowering the temperature to 19°C in steps of 2°C. For protein production, a mixed feeding protocol (77% methanol and 23% glycerol supplemented with 12 ml/l PTM1 trace salts) was applied over a period of 24 h at 2 ml/h/l. Cells were harvested by centrifugation at 5000 g, 20 min, 4°C, flash frozen and stored at −80°C until further use.
Purification
All purification steps were performed at 4°C. Typically, 50 g cells were resuspended to 25% (w/v) in 50 mM Tris-HCl pH 8.1, 10 mM glycine, 200 mM KCl, 5% (w/v) glycerol, 5 mM DTT, 1 mM PMSF, protease inhibitor cocktail tablets (Complete EDTA-free, Roche Diagnostics), 5 mM EDTA and 5 mM EGTA. For cell lysis, a constant cell disruptor (Constant Systems Ltd, Daventry Northants, Northamptonshire, UK) was used at 39 Kpsi. Larger cell debris were removed by centrifugation for 10 min at 5000 g. To the supernatant 5% (w/v) PEG8000 was added to precipitate membranes, which were afterwards harvested with a 20 min centrifugation step at 12,000 g and resuspended in 10 volumes of 30 mM potassium phosphate buffer (PBS) pH 7.6, 10 mM glycine, 300 mM KCl, 20% (w/v) glycerol and 1 mM PMSF using an Ultra-Turrax (IKA®-Werke GmbH & Co. KG, Staufen, Baden-Württemberg, Germany) at 13,000 min-1. The membranes were centrifuged for 45 min at 100,000 g and were solubilized by homogenization in 20 volumes of 30 mM PBS pH 8.1, 10 mM glycine, 800 mM KCL, 13.5% (w/v) glycerol, 2 mM DTT, 1 mM PMSF, protease inhibitor cocktail tablets, 1.5% (w/v) DDM (sol-grade) and stirred for 90 min. Solubilized material was centrifuged for 20 min at 100,000 g. 20 mM imidazole, 2 mM DTT and 0.5 mM PMSF was added to the clarified extract followed by adjusting the pH to 7.8. The protein mixture was incubated over night with 5 ml Ni-NTA (50% slurry) pre-equilibrated with 25 mM PBS pH 7.6, 750 mM KCl, 10% (w/v) glycerol, 2 mM DTT, 30 mM imidazole, 0.1% (w/v) DDM (anagrade) and 0.05 mg/ml lipids (3:2 POPG:POPC). The resin was packed into a plastic column (1.5 × 10 cm), washed with 10 column volumes (CV) of equilibration buffer. The protein was eluted by increasing the imidazole concentration to 250 mM. 2 mM DTT and 3 mM EDTA were added to the IMAC eluate and the protein was affinity purified using 4 ml strychnine agarose resin (SA) by incubation for 7 h under agitation. The SA resin was generated by the coupling of 2-aminostrychnine (custom synthesized by GVK Biosciences, Hyderabad, Andhra Pradesh, India) to Affi-Gel 10 (BioRad) (Pfeiffer et al. Citation1982). Non bound material was washed off with 12 CV buffer (25 mM PBS pH 7.5, 750 mM KCl, 20% [w/v] glycerol, 4 mM DTT, 2 mM EDTA, 0.05% [w/v] DDM [anagrade] and 0.025 mg/ml lipids). The protein was eluted by the addition of one CV SA equilibration buffer containing 200 mM glycine and incubated overnight followed by one additional CV of glycine buffer. The protein was concentrated using an Amicon®-Ultra centrifugal filter with a 100 kDa cut-off (Millipore) and loaded on a superdex 200 gelfiltration column 10/300 GL (GE-Healthcare). As gelfiltration (GFB) and final protein formulation buffer 20 mM Bis Tris-propane pH 7.4, 200 mM KCl, 0.025% DDM (anagrade) and 0.0125 mg/ml lipids were used. The main peak fractions were pooled, concentrated and the protein concentration was determined using a NanoDrop 1000 spectrophotometer (Thermo Fisher Scientific Inc., Gothenburg, Sweden).
Protein analysis and quality control
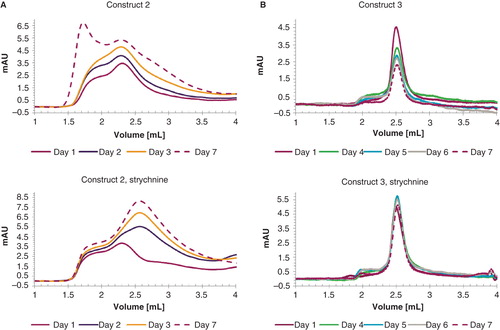
The pentameric protein structure was confirmed using a Blue-Native PAGE 3–12% Bis-Tris gel (Invitrogen; Schagger and von Jagow Citation1991) and both protein quality and stability was analyzed using gelfiltration (GF) on an Agilent 1100 HPLC system. To this end, the protein samples (0.5 mg/ml in the presence or absence of 10 μM strychnine) were kept on ice during one week and every day 25 μg was injected onto a superdex 200 5/150 GL column (construct 2) or Agilent Bio SEC-3 300 Å, 4.6 × 300 mm column (construct 3). The change in the GF profile was monitored at A280 and data was analyzed using ChemStation (Agilent, Santa Clara, California, United States).
N-terminal sequence determination
Samples were separated on SDS-PAGE and blotted on an invitrolon PVDF membrane (Invitrogen) using a semi-dry transfer cell (BioRad). Bands of interest were excised after staining with amidoblack for 10–15 min (0.1% (w/v) amidoblack, 25% isopropanol, 10% acetic acid). Sequence determination was performed on an Applied Biosystems 494 HT sequencer (Applied Biosystems, Carlsbad, California, United States) with on-line phenylthiohydantion analysis using an Applied Biosystems 140A micro HPLC.
Circular dichroism spectroscopy
The circular dichroism spectra (CD) were monitored using a Jasco J-715 spectropolarimeter calibrated with d-camphor-10-sulfonic acid ammonium salt (Sigma) according to the manufacturer's instructions. The sample chamber was flushed using nitrogen with a flow of 5 l/min and the temperature was controlled using Jasco PTC-348 W. A protein concentration of 0.5 mg/ml was used in a 0.1 cm path-length quartz cuvette. Spectra were recorded in a single accumulation at 220 nm with a scanning speed of 1°C/min in a range of 25–95°C using Spectra Manager 1.53.01 (Jasco, Easton, Maryland, United States). For data interpretation the onset of unfolding, where a 20% of signal increase was observed, was used.
Radioactive ligand binding assay
Radioactive strychnine binding was performed according to Betz (Pfeiffer and Betz Citation1981) with minor modifications. In brief, per data point 2 μg of solubilized GlyR was incubated with 3H-strychnine (Perkin Elmer) using a two-fold serial dilution from 320 nM to 2.5 nM of radio ligand in 25 mM PBS pH 7.4, 200 mM KCl and 0.2% (w/v) DDM. Non-specific binding was measured using 20 mM glycine. Mixtures were incubated for 45 min at 4°C while shaking. Protein was precipitated by adding 0.3% (w/v) γ-globulins (Sigma) in 30% (w/v) PEG6000 to a final concentration of 0.1 and 10%, respectively. Non-bound fraction of strychnine was separated by vacuum filtration using GF/C multiscreen plates (Millipore) and samples were washed twice with 8% (w/v) PEG6000 in 25 mM PBS pH 7.4 and 200 mM KCl. Filterplates were dried at 55–60°C for 1 h, after which 50 μl scintillation fluid (Optiphase) was added to each well. Radioactivity was measured using a Wallac MicroBeta counter, Perkin Elmer, Waltham, Massachusetts, United States.
Determination of detergent concentration
The relative detergent concentration of each protein sample compared to GFB was determined by 1H-NMR (). 50 μl sample was diluted 1:1 with 2 mM 2,2,3,3,-D4-sodium-3-trimethylsilylpropionate (TMSP, Cambridge Isotope Laboratories Inc.), followed by the addition of 400 μl D2O and transferred to a 5 mm NMR tube. 1H-NMR spectra were acquired using a DRX 800 MHz NMR spectrometer (Bruker BioSpin, Fällanden, Switzerland) and 32 scans were collected with a recycling period of 32 sec. Water suppression was achieved with the excitation sculpting scheme (Hwang and Shaka Citation1995). The DDM concentration was determined from the area of the methyl triplet at 0.84 ppm relative to the area of the TMSP peak at 0 ppm. A 1:10 sample dilution was sufficient to get below the critical micelle concentration (cmc), which was obvious from the well resolved methyl triplet. The ratio of the detergent concentration in the buffer to the protein solution was used to obtain an optimal buffer match in the ITC experiment.
Isothermal titration calorimetry
ITC data was recorded using an auto-iTC200 (GE-Healthcare, Northampton, Massachusetts, US) at 20°C with a reference power of 10 cal/s and a stirring speed of 1000 rpm. ITC data was recorded on freshly prepared protein of construct 2 at a concentration of 20 μM and varying detergent content (). To resolve the buffer mismatch, a GFB screen starting with the concentration ratio given by 1H-NMR ± 0.005% (w/v) DDM were prepared, transferred into the sample tray and stored at 20°C. After temperature equilibration, 1 μl aliquots of the buffer series were injected one by one into macromolecular solution until the mismatch was eliminated. Ligand was then dissolved in the matching buffer and titrated into protein solution. For direct titration, typically 20 injections of 1 μl titrant were added every 2 sec with 60 sec intervals. For displacement experiments, glycine was titrated until saturation occurred, followed by strychnine titration. Data were analyzed using the Origin 7.0 software package (OriginLab) and were fitted with a ‘one set of sites' and ‘competitive binding', respectively.
Table II. Characteristics of the main gel filtration peak and melting temperatures of the individual constructs in complex with agonist and antagonist, respectively.
Results
Production of homogeneous GlyR preparation
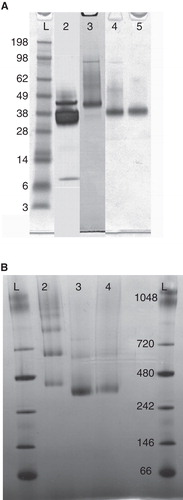
A graphical representation of the constructs is shown in and the characteristic features are listed in . The initial construct expressed the native protein with a C-terminal 6× His tag. An SDS-PAGE of solubilized material is presented in , which shows a distinct band at 39 kDa and degradation products at 37 and 7 kDa (lane 2). Analysis of the degradation products by N-terminal sequencing revealed the aa sequences 368-GMGPAC-373 and 384-GANNSN-389 mapping to the intracellular loop 2. A second construct was designed, where parts of loop 2 between E354 and K383 were removed guided by the rat splice variant (). This deletion did not encompass the downstream identified cleavage site (K↓GANNSN), which is included in a highly conserved stretch. Although degradation was substantially reduced, a faint band at 37 kDa (, lane 3) was observed. As the analysis of the crystal structure of the bacterial homolog Gloebacter violaceus GLIC (Hilf and Dutzler Citation2008) revealed a short loop2, we designed a new GlyR variant where the long loop was replaced by the short sequence VESQPA deriving from GLIC (construct 3, ). This construct resulted in stable and pure GlyR α1 receptor produced at 4 mg/l. The protein does not show the proteolytic degradation observed for construct 1 or 2 (, lane 4).
Figure 2. (A) SDS-PAGE of purified GlyR. The second lane displays construct 1 with a distinct band for GlyR between the marker at 38 and 49 kDa and significant degradation products at 38 and 7 kDa. Construct 2 shows a significant reduction of degradation products visualized by a faint band at 38 kDa in addition to the dominant band between the marker at 38 and 49 kDa (lane 3). The last two lanes represent construct 3 and 4, where only a single band characteristic for GlyR is observed. (B) Blue-Native PAGE of construct 2–4. For construct 2 (lane 2), several equally strong bands at higher molecular weights were observed indicating protein aggregation. The other two constructs (lane 3, 4) solely show a strong band between 242 and 480 kDa, characteristic for the pentameric complex.
In addition to the protein cleavage discussed above, N-terminal heterogeneity was detected in construct 1. In fact, several protein sequences were observed using N-terminal sequencing, which hindered analysis thereof. To tackle this problem, the second aa of the protein, an arginine residue, was replaced by a TEV cleavage site (Appendix A, construct 2). However, this site was resistant to TEV cleavage and instead in vivo cleavage by P. pastoris proteases resulted in a mixture of N-termini (). Consequently, the TEV cleavage site together with two Glu-Ala repeats on the C-terminal side of kex2 in α-MF were removed in construct 3. Nevertheless, two different N-termini were observed. Based on these results, the fourth construct was designed starting at the third aa of the mature protein (Appendix A, construct 4). This construct resulted in highly homogeneous protein that started with the anticipated N-terminal sequence (3-SAPKPM-8) and showed no signs of proteolytic degradation. We have developed a robust process for production of homogenous protein at a yield of 5 mg/l.
Oligomeric state
Blue-Native PAGE and analytic GF chromatography were applied to verify the oligomeric state of GlyR preparations. In , a Blue-Native PAGE of construct 2–4 is depicted, where the most dominant band runs between the marker protein at 242 and 480 kDa. An intact GlyR pentamer has a calculated molecular weight of 246 kDa. Thus, the observed migration is slightly slower compared to a soluble protein of equal size. However, anomalous migration of membrane proteins has been observed in other studies and is attributed to variations in lipid-, detergent- and dye binding (Wittig et al. Citation2010). Hence the dominant band most likely presents a pentameric arrangement with excess lipids, detergents where the different position in lane 2–4 matches the theoretical differences in molecular weight of the three constructs (Δconstruct 2/3 25.5 kDa and Δconstruct 2/4 23 kDA, respectively). Interestingly, solely construct 2 displayed additional bands at higher molecular weight, indicative of multiple aggregation states. No GlyR migrated as a monomer, as shown by the complete absence of bands in the low molecular weight range.
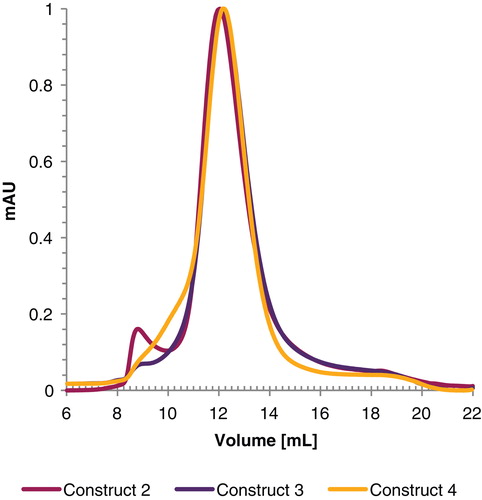
The corresponding GF profile for the three constructs is shown in . The peak at a retention time of 12 ml exhibits a centro symmetric profile with similar width at half height, shares a comparable elution profile () and elutes ahead of a soluble-protein standard of similar size. This is in agreement with our results from the Blue-Native PAGE as the estimated size for the protein-detergent complex is 305 kDa. For construct 2 there was a small peak visible at a retention time characteristic of the void volume of the column indicating a minor fraction of aggregated GlyR. This void volume is less pronounced for construct 4, which instead has a shoulder prior to the resolved main peak. These results are consistent with the purified preparations predominantly containing a pentameric assembly.
Figure 3. Gel filtration profile of GlyR expressed using construct 2, 3 and 4 using a superdex 200 10/300 GL gelfiltration column. For better visualization, the curves were normalized prior plotting. This Figure is reproduced in color in Molecular Membrane Biology online.
Thermal stability investigated using CD spectroscopy
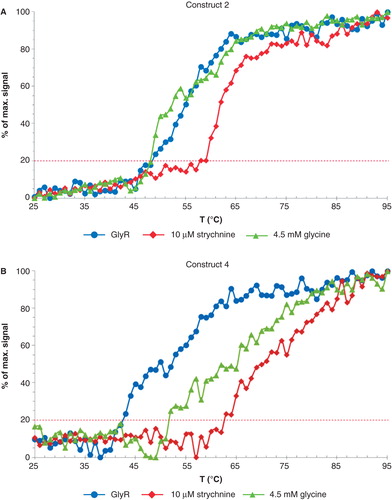
The thermal shift upon addition of ligands was investigated using CD spectroscopy by recording the melting temperatures (TM) in the presence and absence of strychnine or glycine (). The CD spectra show a maximum negative absorption at 220 nm, which was monitored as a function of temperature. The thermal denaturation was not reversible, and aggregation precipitation occurred at elevated temperatures (visible inspection). Hence the observed CD signals are due to combined effects of changes in secondary structure, protein concentration and light scattering effects, and temperature transitions could not convincingly be fitted with a single sigmoidal curve. Therefore we choose to interpret thermal stability in terms of the onset of unfolding (the melting temperature TM is defined here as the temperature where a 20% increase of signal was observed, indicated by the dotted line). The individual TM of construct 2–4 of apo GlyR and in complex with ligand is summarized in . While apo protein of the different constructs shows variation in TM, construct 3 and 4 show a substantial increased thermal stability in the presence of ligands. These results indicate that the preparations are ligand binding competent, and are stabilized by ligands independent of the length of loop 2.
Figure 4. Thermal denaturation curves of (A) construct 2 and (B) construct 4. The traces are outlined using the following color scheme: GlyR (purple), in complex with 10 μM strychnine (blue) and 4.5 mM glycine (yellow). Data were continuously recorded using a Jasco J-715 spectropolarimeter at 220 nm in the temperature range from 25–95°C at 1°C/min intervals and a protein concentration of 0.5 mg/ml. The constructs exhibit a clear temperature shift upon addition of strychnine. This Figure is reproduced in color in Molecular Membrane Biology online.
Protein stability over time
Protein stability against aggregation was assessed by analytical gelfiltration. represents changes in the GF profile of constructs 2 (5A) and 3 (5B) in the presence and absence of strychnine followed over seven days. It is striking how the traces differ from each other. The major proportion of pentameric GlyR of construct 2 has already lost its structure after storage on ice for one day (compare with , purple trace) and could not be recovered upon addition of strychnine. In contrast, construct 3 produced a stable pentameric complex for a prolonged period of time, with a constant ratio of aggregated to intact protein (). Construct 4 behaves very similarly with the exception of the presence of a slightly larger fraction of higher molecular weight species (data not shown). It should be noted that the height of the top peak decreased over time for both constructs. This observation is interpreted as protein loss due to precipitation, which stayed in the filter of the column. The protein decrease was particularly pronounced for apo protein, where a loss of 53% for construct 3 and 42% for construct 4 after storage for one week on ice has been observed. Contrarily, in complex with strychnine 90% of the protein was recovered for both constructs. The long-term stability of GlyR variants generated from constructs 3 and 4, make these suitable for biophysical and structural analysis. The highly homogenous protein obtained from construct 4 is particularly interesting for crystallographic analysis.
Figure 5. Graphical representation of protein stability. In (A) construct 2 and (B) construct 3 are monitored over a period of seven days in the presence (right) and absence (left) of 10 μM strychnine. The curves are presented as follows: day 1 (purple), day 2 (blue), day 3 (yellow), day 4 (green), day 5 (light blue), day 6 (grey) and day 7 (purple, dashed line). Absorption at 1 ml elution volume was set to zero for all individual chromatograms. This Figure is reproduced in color in Molecular Membrane Biology online.
How to generate ITC data for membrane proteins
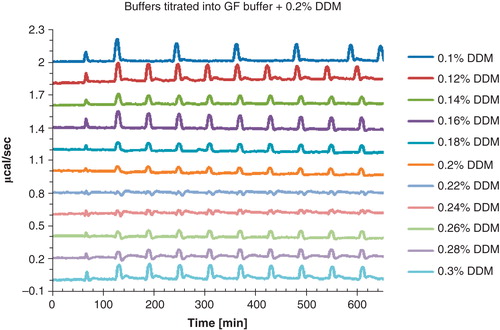
In ITC experiments small changes in heat are recorded that arise from ligand binding effects. However, these signals may be dwarfed by heat changes arising from differences in composition between titrant and protein solution. For detergent MP solutions particularly large heat effects are observed. Thus, the significance of this problem, the buffer mismatch, was investigated using control experiments, where a series of defined detergent concentrations between 0.1 and 0.3% DDM dissolved in GFB was titrated into GFB containing 0.2% DDM (). A negligible mismatch was only observed at a detergent concentration of 0.22 and 0.24% DDM, respectively. Additional control experiments showed that this buffer mismatch became increasingly difficult to minimize when buffers contained higher concentrations of total DDM. The exact cause of the mismatch is not fully understood, but it is characteristic for the nature of DDM. Thus, to obtain a low detergent and high protein content, only the most concentrated fractions after GF were collected and concentrated 2- to 4-fold. Typically a final protein concentration of 4 mg/ml and a detergent concentration of 0.06 ± 0.03% were obtained (). Using this approach, a system for thermodynamic characterization of ligand binding has been established. The optimized protocol is summarized in the methods section.
Table III. Ligand titrations into purified GlyR (construct 2).
Figure 6. Visualization of the buffer mismatch that appears when aliquots of buffer containing a defined DDM concentration (0.1–0.3%) is titrated into 20 mM Bis Tris-propane pH 7.4, 200 mM KCl, 0.0125 mg/ml lipids and 0.2% DDM. A negligible mismatch is only observed at 0.22% and 0.24% detergent. To avoid curve overlap, the graphs were horizontally shifted. This Figure is reproduced in color in Molecular Membrane Biology online.
Thermodynamic parameters of GlyR characterized using ITC
The thermodynamic binding energetics of the association between GlyR and ligands were measured by ITC. The given numbers for the stoichiometry of binding (n), the dissociation constant (KD), the binding enthalpy (ΔH) and binding entropy (ΔS) are mean values of seven independent direct strychnine, two direct glycine titrations and two strychnine saturation binding experiments. The outcome of each experiment is summarized in .
Strychnine titrations were performed using a direct titration experiment from which a 1:5 stoichiometry was calculated, with a KD of 138 ± 55 nM, a ΔH of −9708 ± 1195 cal/mol and a ΔS of −1.0 ± 4.1 cal/mol/K (). The KD value was in agreement with the dissociation constant of 52 ± 6 nM measured by radioligand saturation binding on purified GlyR.
Figure 7. ITC titrations of (A) 300 μM strychnine and (B) 800 μM glycine into purified GlyR (construct 2). In (C) a displacement experiment of 300 μM strychnine titrated into purified GlyR (construct 2) containing a saturating glycine concentration is shown. The upper panel represents the ITC thermogram, whereas the lower panel corresponds to the fitted binding isotherms. The measurements were conducted at 20°C with a protein concentration of 17.5 μM.
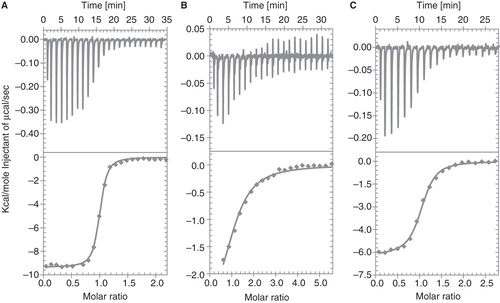
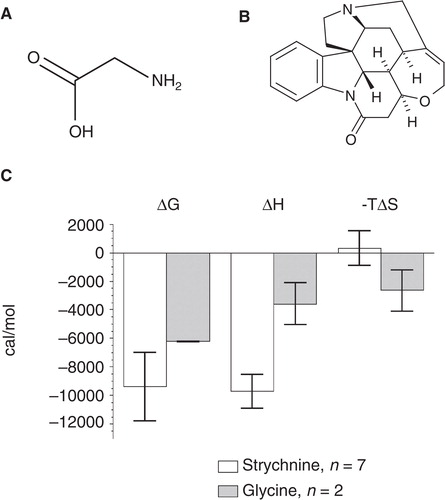
The direct titration of glycine is shown in . The experiment showed a low C-value titration and the stoichiometry of binding could not be extracted from the data, as it does not present the full titration from unsaturated to saturated GlyR. Assuming a 1:5 stoichiometry allows for the determination of the thermodynamic parameters: KD 3.2 ± 0.8 μM, ΔH −2228 ± 1012 cal/mol and ΔS 17.7 ± 2.8 cal/mol/K. To obtain more accurate values a competition experiment was chosen where glycine was first titrated into macromolecular solution until saturation occurred, followed by the addition of strychnine. The slope at the inflection point of the sigmoidal titration curve describes the association constant of the interaction (KA). Thus, the difference in the apparent KA in the presence of glycine and KA determined in the direct titration of strychnine only was used to calculate the thermodynamic parameters. The displacement experiment revealed that strychnine and glycine binding is competitive () with a KD of 29 ± 0.2 μM, a ΔH of −3584 ± 1481 cal/mol and a ΔS of 8.9 ± 6.5 cal/mol/K. The values are in good agreement with the numbers obtained from our direct glycine titration. Interestingly, the binding characteristics of the two ligands show a very different behavior (). Strychnine binding was largely driven by enthalpy while glycine was driven predominantly by an entropic contribution.
Figure 8. The chemical structures of (A) glycine and (B) strychnine are shown. (C) Thermodynamic parameters of strychnine and glycine binding to GlyR (data from ). Strychnine titration is determined by an enthalpic contribution while the interaction of glycine is driven by a large entropic contribution to ΔG.
Discussion
Construct development
In this article we have described a method for recombinant production and purification to provide highly pure and stable GlyR at mg scale. A range of parameters were optimized: Modifications on the N-terminus, cleavage sites, length of loop 2 and different P. pastoris strains. N-terminal sequencing was key to recognize heterogeneity of the N-terminus and to identify protease sensitive sites in intracellular loop 2. Lack of homogeneity of the N-terminus may arise from variable processing of the α-MF signal sequence and/or in vivo cleavage of this protein region by P. pastoris proteases. In vitro cleavage at the engineered TEV site did not resolve the issue, instead a series of N-terminal truncations were required to obtain protein (construct 4) with a homogeneous N-terminus. Interestingly, the only N-terminal truncation; construct that resulted in protein production was the +2 N-terminal truncation; further truncations (+4, +7, +11, +16 and +17 of the mature protein) led to a decrease in protein expression below detectable levels. This may be indicative of a structural or functional role of the N-terminus, which might be involved in folding or responsible for subunit assembly. Our observations relating to N-terminal truncations are in agreement with literature, where it was reported that the first 100 aa of the extracellular domain of GlyR are thought to be important for subunit assembly. More specifically, six out of eight key residues that form putative contact surfaces are positioned in this part and are critical for homo-oligomerization (Griffon et al. Citation1999).
The proteolytic degradation observed predominantly in construct 1, mapped to intracellular loop 2 or M3-M4 loop. For secondary structure prediction and alignment of GlyR with GluCl, GLIC and other Cys-loop receptors see (Hibbs and Gouaux Citation2011). The M3-M4 loop is known to have high plasticity and both short and long loop inserts have been observed for different species. For example, a rat splice variant has a considerably shorter loop region, while retaining its function when expressed using HEK293 cells (Inoue et al. Citation2005; GLRA1_RAT, Q5PSQ6). The M3-M4 loop of construct 2 in this work is based on this shorter rat splice variant. Although proteolytic degradation is substantially reduced, it is not completely circumvented, presumably since one of the two protease sensitive sites is still present in construct 2 (384-GANNSN-389). Proteolytic degradation products are abolished only when the M3-M4 loop is replaced by the short sequence VESQPA (construct 3 and 4), a short M3-M4 linker based on the work of Hilf and Dutzler (Citation2008). Hibbs and Gouaux have applied a similar strategy where the loop region of GluCl was replaced by a tripeptide with retention of functionality (Hibbs and Gouaux Citation2011), further illustrating the plasticity of this loop. A similar approach has been successfully applied to GPCRs, either by replacing flexible intracellular loops by a short linker or by T4L domain, i.e., β1-AR (Warne et al. Citation2008) and β2-AR-T4L (Rosenbaum et al. Citation2007).
Expression levels for construct 4 were as low as 0.4 mg/l cells using the double protease deficient strain SMD1163H (Daly and Hearn Citation2005). This strain exhibits decreased transformation efficiency, slower growth, is more difficult to induce and is less robust as other strains (Cregg et al. Citation2009). As construct 4 has proven to produce considerable stable protein, the single protease deficient strain SMD1168H was considered for protein production. Consequently, a 10-fold increase in expression level has been achieved, while showing no signs of proteolytic degradation and maintaining a homogeneous N-terminus. Thus, through a combination of expression studies and protein engineering strategies GlyR constructs have been created, which allows for mg-scale purification of stable, homogeneous and strychnine binding competent receptor.
Secondary structure of GlyR using CD spectroscopy
The secondary structure elements of GlyR were analyzed by CD spectroscopy at wavelengths of 200–260 nm, and suggest a mixed α/β structure dominated by β-sheet characteristics. Our data agrees with work from Cascio et al. (Citation2001) and Vogel et al. (Citation2009), where a folded structure of predominantly β-sheets with a low α-helical content was reported. Moreover, the presence of properly folded GlyR is supported by a defined transition temperature upon thermal denaturation. However, it should be pointed out that the unfolding process is non reversible, with noticeable protein precipitation. These effects may explain the biphasic CD response under thermal denaturation observed for construct 2 in complex with glycine and for construct 3 and 4 (). Interestingly the TM for the apo protein of construct 3 and 4 is substantially lower compared to construct 2, while the value for protein stability in complex with the agonist and antagonist stays approximately the same. Apparently the loop deletion destabilizes GlyR receptor in the absence of ligand, but the deletion does not destabilize the receptor in ligand bound conformation. However, to fully understand how intracellular loop 2 affects conformation and stability of the receptor, crystal structures are needed. From the stability data obtained using CD spectroscopy we conclude that both constructs, 3 and 4, possess good properties for crystallization and will aid structural studies.
Solving ITC buffer mismatch caused by detergents
A protocol to generate ITC data for DDM solubilized GlyR has been established. This required development of a robust protein production system that yields high protein amounts while keeping detergent concentration low, as well as a protocol for detergent content determination. Our data shows that in order to obtain a buffer match the DDM concentration of titrant deviates less than 0.02–0.04% from the DDM content in the protein solution (). Interestingly, experiments using n-decyl-β-D-glucopyranoside (DM) reveal that a larger difference in detergent concentration can be tolerated while retaining a low background. However, GlyR precipitated during purification using DM and was therefore not chosen as an alternative detergent. In literature, ITC data of bacterial MPs using a variety of detergents such as n-octyl-β-D-glucopyranoside (Destoumieux-Garzon et al. Citation2005, Housden et al. Citation2005), DM (Sikora and Turner Citation2005a, Citation2005b, Zimmermann Citation2006, Fang et al. Citation2007), zwittergent 3–14 (Krell et al. Citation2003), Tween 20 (Krell et al. Citation2003), Brij-35 (Bizouarn et al. Citation2005) but also DDM (Krell et al. Citation2003, Chao and Fu Citation2004, Wei and Fu Citation2005, Bundschuh et al. Citation2009) are presented. For the generation of the data extensive dialysis steps were necessary (Krell et al. Citation2003, Bizouarn et al. Citation2005, Destoumieux-Garzon et al. Citation2005) and Sikora and co-workers (Sikora and Turner Citation2005a, Citation2005b) have reported laborious exploration of experimental conditions before heats of binding could be detected. Alternative approaches to overcome the buffer mismatch are to reconstitute the protein into small unilamellar vesicles (Sikora and Turner Citation2005a, Citation2005b) or to use a detergent concentration below the cmc. However, reconstitution is not always efficient and many MPs are not stable at low detergent concentrations. While we do not fully understand the molecular mechanism causing the differences in background signal during titration, it is likely that these effects are detergent and protein dependent. Thus, our approach is an efficient method to tackle buffer mismatches encountered during ITC titration in detergent containing systems particularly for DDM, as it is widely used for membrane protein purification.
Thermodynamic profiling and stoichiometry of ligand binding
The results from ITC titrations show a 1:5 stoichiometry of strychnine binding to GlyR with a KD of 138 ± 55 nM. The KD value is in good agreement with our radioactive strychnine binding data and reported values, 73 nM (Gentet and Clements Citation2002), 62 nM (Kumamoto and Murata Citation1996) and 20 nM (Pfeiffer and Betz Citation1981). The fact that purified GlyR displays near-native affinities to glycine and strychnine is indicative of a preserved native fold in the purified state.
Stoichiometry can solely be determined with confidence, if exact values for ligand and protein concentrations are available. In this work, strychnine concentration was determined using 1H-NMR with high accuracy, and protein concentrations using UV-VIS. However, the specific strychnine binding activity could not be determined with an independent method. Nevertheless, as strychnine affinity purification is applied we assume that fully active purified GlyR is isolated. Moreover the observed 1:5 stoichiometry was observed in seven independent experiments () and the shape of the saturation curve indicates a single binding event (). In addition, our saturation radioactive ligand binding experiments have been analyzed with a one set of binding as well. However, the Rosenthal/Scatchard plot indicates some curvilinearity, and hints to additional low affinity binding sites (data not shown). Nevertheless, the data does not allow the analysis of a KD value of a putative low affinity site.
The stoichiometry of glycine binding could not be accurately determined from direct titrations as the experiment was designed as a low C-value measurement. The data hints to a 1:5 stoichiometry, but must be interpreted with caution as too few data points were measured to fully characterize the interaction. To obtain a reliable value, the ITC experiment requires higher protein concentrations, which inevitably results in an increase in detergent concentration causing an irresolvable buffer mismatch. A previous study suggests that channel activation requires three sequential strychnine dissociation events, prior to two cooperative glycine binding steps (Gentet and Clements Citation2002). This model does not preclude the existence of more than three binding sites but suggests that only three sites are functional at a time, while the remaining two become unavailable after binding. A rational explanation could be steric hindrance, conformational changes or a strong negative cooperativity for ligand binding after the third molecule has bound. In contrast, the crystal structure of GluCl reveals a 5:5 interaction with glutamate (Hibbs and Gouaux Citation2011). However, glutamate is an agonist of GluCl, whereas strychnine is an antagonist of GlyR and therefore one cannot eliminate the possibility of allosteric binding. Thus, to develop more insight in the mechanism and stoichiometry of ligand binding, further structural analysis is required.
Site-directed mutagenesis studies suggest that glycine and strychnine bind to distinct, but overlapping sites on recombinant receptors (Marvizon et al. Citation1986). From displacement experiments, it is apparent that the ligands compete with each other while yielding a binding affinity for glycine of 29 ± 0.2 μM. The value is in good agreement with data obtained from the low C-value titration and matches the numbers in literature that cover a range of EC50 from 18–151 μM (Pfeiffer and Betz Citation1981, Lynch Citation2004).
The binding energetics in show that the enthalpic contribution of strychnine binding is relatively large compared to glycine. Judging from its chemical structure, glycine should instead be largely driven by hydrogen interactions. However, the effect of single hydrogen bonds cannot be correlated to the obtained binding parameters, as the enthalpic and entropic effect is a sum of all factors contributing to ΔG such as solvation and desolvation of both the ligand and the protein binding site.
In drug discovery, to generate a valuable medicine, both the affinity and specificity of a given target has to be increased (Ladbury et al. Citation2010). Optimizing affinity is not a trivial task, as it represents the heat energy that is necessary to capture a state and includes hydrogen bonds, van der Waals interactions and desolvation of polar groups (Chaires Citation2008). In addition, an enthalpic gain often comes with an entropic loss, resulting in minor changes in affinity. To overcome this enthalpy-entropy compensation is the key in drug discovery, an area where ITC will have great impact in the future as it can aid the understanding of interaction parameters (Ladbury et al. Citation2010).
Conclusions
We demonstrate the development of a system that produces highly pure, uniform and exceptionally stable GlyR on mg scale using P. pastoris. The protein is suitable for crystallization, biophysical characterization or screening and as such may complement cell based lead generation approaches. Furthermore, a rational approach for generating ITC data for membrane proteins is outlined, and thermodynamic parameters of ligand binding on a human LGIC are presented and stoichiometry of binding is discussed.
Appendix A
Download MS Word (26 KB)Acknowledgements
We acknowledge financial support from HEALTH-F4-2007-201924 (EDICT). We thank Ewa Nilsson and David Månsson for assistance with the generation of different P. pastoris constructs, Fritz Schweikart for N-terminal sequencing and Paul Wan for scientific discussions and proof-reading the manuscript.
Declaration of interest: The authors report no conflicts of interest. The authors alone are responsible for the content and writing of the paper.
References
- BetzH. 1991. Glycine receptors: Heterogeneous and widespread in the mammalian brain. Trends Neurosci14:458–461.
- BetzH, LaubeB. 2006. Glycine receptors: Recent insights into their structural organization and functional diversity. J Neurochem97:1600–1610.
- BizouarnT, van BoxelGI, BhaktaT, JacksonJB. 2005. Nucleotide binding affinities of the intact proton-translocating transhydrogenase from Escherichia coli. Biochim Biophys Acta1708:404–410.
- BundschuhFA, HannappelA, AnderkaO, LudwigB. 2009. Surf1, associated with leigh syndrome in humans, is a heme-binding protein in bacterial oxidase biogenesis. J Biol Chem284:25735–25741.
- CascioM, ShenkelS, GrodzickiRL, SigworthFJ, FoxRO. 2001. Functional reconstitution and characterization of recombinant human alpha 1-glycine receptors. J Biol Chem276:20981–20988.
- ChairesJB. 2008. Calorimetry and thermodynamics in drug design. Annu Rev Biophys37:135–151.
- ChaoY, FuD. 2004. Thermodynamic studies of the mechanism of metal binding to the Escherichia coli zinc transporter YiiP. J Biol Chem279:17173–17180.
- CreggJM, TolstorukovI, KusariA, SungaJ, MaddenK, ChappellT. 2009. Chapter 13, expression in the yeast Pichia pastoris. Academic Press; San Diego, California, United States.
- DalyR, HearnMT. 2005. Expression of heterologous proteins in Pichia pastoris: A useful experimental tool in protein engineering and production. J Mol Recognit18:119–138.
- Destoumieux-GarzonD, DuquesneS, PeduzziJ, GoulardC, DesmadrilM, LetellierL, 2005. The iron-siderophore transporter FhuA is the receptor for the antimicrobial peptide microcin J25: Role of the microcin Val11-Pro16 beta-hairpin region in the recognition mechanism. Biochem J389:869–876.
- FangY, Kolmakova-PartenskyL, MillerC. 2007. A bacterial arginine-agmatine exchange transporter involved in extreme acid resistance. J Biol Chem282:176–182.
- FreireE. 2008. Do enthalpy and entropy distinguish first in class from best in class?Drug Discov Today13:869–874.
- Garcia-CalvoM, Ruiz-GomezA, VazquezJ, MoratoE, ValdiviesoF, MayorF. 1989. Functional reconstitution of the glycine receptor. Biochemistry28:6405–6409.
- GentetLJ, ClementsJD. 2002. Binding site stoichiometry and the effects of phosphorylation on human alpha1 homomeric glycine receptors. J Physiol544:97–106.
- GrenninglohG, SchmiedenV, SchofieldPR, SeeburgPH, SiddiqueT, MohandasTK, 1990. Alpha subunit variants of the human glycine receptor: Primary structures, functional expression and chromosomal localization of the corresponding genes. EMBO J9:771–776.
- GriffonN, ButtnerC, NickeA, KuhseJ, SchmalzingG, BetzH. 1999. Molecular determinants of glycine receptor subunit assembly. EMBO J18:4711–4721.
- GrudzinskaJ, SchemmR, HaegerS, NickeA, SchmalzingG, BetzH, 2005. The beta subunit determines the ligand binding properties of synaptic glycine receptors. Neuron45:727–739.
- HarveyRJ, DepnerUB, WassleH, AhmadiS, HeindlC, ReinoldH, 2004. GlyR alpha3: An essential target for spinal PGE2-mediated inflammatory pain sensitization. Science304:884–887.
- HenryCM. 2001. Structure-based drug design. Chem Eng News79:69–74.
- HibbsRE, GouauxE. 2011. Principles of activation and permeation in an anion-selective cys-loop receptor. Nature474:54–60.
- HilfRJ, DutzlerR. 2008. X-ray structure of a prokaryotic pentameric ligand-gated ion channel. Nature452:375–379.
- HousdenNG, LoftusSR, MooreGR, JamesR, KleanthousC. 2005. Cell entry mechanism of enzymatic bacterial colicins: Porin recruitment and the thermodynamics of receptor binding. Proc Natl Acad Sci USA102:13849–13854.
- HwangTL, ShakaAJ. 1995. Water suppression that works. excitation sculpting using arbitrary wave-forms and pulsed-field gradients. J Magnetic Reson Ser A112:275–279.
- InoueK, UenoS, YamadaJ, FukudaA. 2005. Characterization of newly cloned variant of rat glycine receptor alpha1 subunit. Biochem Biophys Res Commun327:300–305.
- KrellT, Renauld-MongenieG, NicolaiMC, FraysseS, ChevalierM, BerardY, 2003. Insight into the structure and function of the transferrin receptor from Neisseria meningitidis using microcalorimetric techniques. J Biol Chem278:14712–14722.
- KumamotoE, MurataY. 1996. Glycine current in rat septal cholinergic neuron in culture: Monophasic positive modulation by Zn2+. J Neurophysiol76:227–241.
- LadburyJE, KlebeG, FreireE. 2010. Adding calorimetric data to decision making in lead discovery: A hot tip. Nat Rev Drug Discov9:23–27.
- LegendreP. 2001. The glycinergic inhibitory synapse. Cell Mol Life Sci58:760–793.
- LynchJW. 2009. Native glycine receptor subtypes and their physiological roles. Neuropharmacology56:303–309.
- LynchJW. 2004. Molecular structure and function of the glycine receptor chloride channel. Physiol Rev84:1051–1095.
- MarvizonJC, Garcia CalvoM, VazquezJ, MayorFJr, Ruiz GomezA, ValdiviescoF, 1986. Activation and inhibition of 3H-strychnine binding to the glycine receptor by eccles' anions: Modulatory effects of cations. Mol Pharmacol30:598–602.
- PfeifferF, BetzH. 1981. Solubilization of the glycine receptor from rat spinal cord. Brain Res226:273–279.
- PfeifferF, GrahamD, BetzH. 1982. Purification by affinity chromatography of the glycine receptor of rat spinal cord. J Biol Chem257:9389-9393.
- RiquelmeG, MoratoE, LopezE, Ruiz-GomezA, FerragutJA, Gonzalez RosJM, 1990. Agonist binding to purified glycine receptor reconstituted into giant liposomes elicits two types of chloride currents. FEBS Lett276:54–58.
- RosenbaumDM, CherezovV, HansonMA, RasmussenSG, ThianFS, KobilkaTS, 2007. GPCR engineering yields high-resolution structural insights into beta2-adrenergic receptor function. Science318:1266–1273.
- SchaggerH, von JagowG. 1991. Blue native electrophoresis for isolation of membrane protein complexes in enzymatically active form. Anal Biochem199:223–231.
- SikoraCW, TurnerRJ. 2005a. Investigation of ligand binding to the multidrug resistance protein EmrE by isothermal titration calorimetry. Biophys J88:475–482.
- SikoraCW, TurnerRJ. 2005b. SMR proteins SugE and EmrE bind ligand with similar affinity and stoichiometry. Biochem Biophys Res Commun335:105–111.
- SineSM, EngelAG. 2006. Recent advances in cys-loop receptor structure and function. Nature440:448–455.
- UnwinN. 2003. Structure and action of the nicotinic acetylcholine receptor explored by electron microscopy. FEBS Lett555:91–95.
- VogelN, KluckCJ, MelzerN, SchwarzingerS, BreitingerU, SeeberS, 2009. Mapping of disulfide bonds within the amino-terminal extracellular domain of the inhibitory glycine receptor. J Biol Chem284:36128–36136.
- WarneT, Serrano-VegaMJ, BakerJG, MoukhametzianovR, EdwardsPC, HendersonR, 2008. Structure of a beta1-adrenergic G-protein-coupled receptor. Nature454:486–491.
- WeberPC, SalemmeFR. 2003. Applications of calorimetric methods to drug discovery and the study of protein interactions. Curr Opin Struct Biol13:115–121.
- WeiY, FuD. 2005. Selective metal binding to a membrane-embedded aspartate in the Escherichia coli metal transporter YiiP (FieF). J Biol Chem280:33716–33724.
- WittigI, BeckhausT, WumaierZ, KarasM, SchaggerH. 2010. Mass estimation of native proteins by blue native electrophoresis: Principles and practical hints. Mol Cell Proteomics9:2149–2161.
- ZhangW, Hywood PotterKJ, PlantzBA, SchlegelVL, SmithLA, MeagherMM. 2003. Pichia pastoris fermentation with mixed-feeds of glycerol and methanol: growth kinetics and production improvement. J Ind Microbiol Biotechnol30:210–215.
- ZimmermannK, HeckM, FrankJ, KernJ, VassI, ZouniA. 2006. Herbicide binding and thermal stability of photosystem II isolated from Thermosynechococcus elongatus. Biochim Biophys Acta1757:106–114.
- ZimmermannP. 2006. The prevalence and significance of PDZ domain-phosphoinositide interactions. 7Biochim Biophys Acta1761:947–956.