Abstract
Aquaporins (AQPs) are channel proteins which facilitate the bidirectional membrane permeation of small neutral molecules such as water and glycerol. A convenient way to characterize their permeability is by growth of transformed Saccharomyces cerevisiae deletion strains on nutrient-limited substrates. We selected a yeast strain deficient in its endogenous ammonium transporters Mep1-3 and aquaglyceroporin Fps1 in order to study the ammonia permeability of heterologously expressed AQPs. Surprisingly, AQP-expression improved yeast growth at high, not low, concentrations of unprotonated ammonia. At neutral or mildly alkaline pH, ammonia concentrations above 10 μM decreased the growth rate and especially the number of yeast cell duplications, but did not affect the lag phase. AQP-expression raised the threshold to about 100 μM. The exchange of ammonium ions for amino acids or urea did not completely abolish this effect. AQPs capable of rescuing growth had a selectivity filter wide enough to permit passage of molecules larger than water but smaller than glycerol. It appears that the endogenous aquaglyceroporin Fps1 may, under alkaline conditions, be beneficial to yeast by facilitating the membrane permeation of an as yet unidentified molecule other than glycerol.
Keywords::
Introduction
Yeast growth assays are a common tool for the characterization of aquaporin water and solute channels (AQPs). They have been employed in the study of AQP-mediated permeability for polyols (Karlgren et al. Citation2005), urea (Klebl et al. Citation2003), arsenite and antimonite (Wysocki et al. Citation2001), acetic acid (Mollapour and Piper Citation2007), ethanol (Teixeira et al. Citation2009), various amides and alcohols (Shepherd and Piper Citation2010), hydrogen peroxide (Bienert et al. Citation2007), boric acid (Nozawa et al. Citation2006), methylamine (Loqué et al. Citation2005), ammonia (Jahn et al. Citation2004) and even cations (Wu et al. Citation2009). Given the availability of appropriate yeast deletion strains, they are particularly useful for the rapid initial characterization of AQP mutants (Beitz et al. Citation2006). They have led to the cDNA library-based discovery of the Saccharomyces cerevisiae aquaglyceroporin Fps1 (Van Aelst et al. Citation1991), as well as a class of ammonia-permeable aquaporins (Jahn et al. Citation2004). Yeast growth assays have been proposed to be suitable for the testing of potential AQP inhibitors (Pettersson et al. Citation2006, Wu et al. Citation2008).
We previously characterized the ammonia permeability of a range of rat AQP1 selectivity filter mutants (Beitz et al. Citation2006), making use of a S. cerevisiae mep1-3▵ deletion strain which lacks its three ammonium transporters (methylamine permeases) Mep1-3. The assay indicates AQP-mediated ammonia permeability by improved yeast growth on media containing low concentrations of ammonium salts as the only nitrogen source (Jahn et al. Citation2004). We found its ‘signal-to-noise ratio' to be disappointingly small, however, and suggested this to be caused by the expression of the endogenous aquaglyceroporin Fps1. Yet, subsequent generation of the mep1-3▵ fps1▵ strain, which lacks ammonium transporters and Fps1, has not increased the sensitivity of the assay. Instead, and unlike for the corresponding experiments performed by others (Jahn et al. Citation2004, Loqué et al. Citation2005), we found a sufficiently high pH to be a requirement for a pronounced growth contrast.
Here, we present evidence that the assay indicates AQP-conferred ammonia tolerance rather than yeast growth improvement by facilitated ammonia uptake (). We further show that the effect persists to some degree if ammonium ions are exchanged for urea or amino acids (), given a sufficiently high pH of the growth medium.
Methods
Yeast strain and plasmids
Saccharomyces cerevisiae strain 31019b fps1▵ (MATa ura3▵ mep1▵ mep2::LEU2 mep3::kanMX2 yll043w▵0) lacking its three ammonium transporters as well as its aquaglyceroporin Fps1 was used. It was generated from strain 31019b (Marini et al. Citation1997). The cells were transformed using the lithium acetate/single stranded carrier DNA/PEG procedure described by Gietz et al. (Citation1995). Most aquaporins were expressed from the plasmid pRS426MET25 (Mumberg et al. Citation1994). Fps1 was expressed from pRS416MET25. Point mutations in rat AQP1 were generated according to the ‘QuikChange Site-Directed Mutagenesis Kit' (Stratagene) and verified by DNA-sequencing.
Growth media
The standard composition of synthetic defined (SD) medium was: 0.17% yeast nitrogen base (YNB) without amino acids and ammonium (Beckton Dickinson), 38 mM ammonium sulfate, 100 mM D-glucose. Its pH was set to 5.6 with NaOH before autoclaving. SD KHL medium contained 0.11 mM L-lysine HCl, 0.095 mM L-histidine HCl, and 0.76 mM L-leucine in addition. Ammonia assay medium was made of 0.17% YNB, 5 mM ammonium sulfate, 150 mM D-glucose, 40 mM MOPS/NaOH pH 7.1, unless mentioned otherwise. 40 mM MES/NaOH was used to buffer pH values below 6.9. Liquid media were filtered sterile with polyether sulfone or polyvinylidene difluoride filters of 0.2 μm mean pore diameter (‘Filtropur S', Sarstedt). To prepare solid media, 2% agar (Oxoid) was used, with filter-sterilized YNB, glucose and amino acid solutions added after autoclaving. Chemicals were obtained from AppliChem, Fluka, Roth or Sigma-Aldrich, with purities stated as higher than 98% or more, except for ammonium acetate (≥ 97%).
Yeast growth assays
A fresh yeast transformant colony or a scraping from a glycerol stock (aqueous yeast suspension, 40% V/V glycerol, −70°C) was grown in 1.6 ml SD KHL medium inside a glass tube at 29°C and 180 rpm orbital shaking overnight or until turbid. Cells were harvested by centrifugation, washed twice with 1 ml and resuspended in 0.5 ml doubly deionized water. The apparent absorption at 600 nm (OD600, 1 cm) was determined after appropriate dilution, and the suspension diluted to the desired OD600. Yeast cell suspensions were either pipetted onto agar plates (5 μl) or into microplate wells (‘Honeycomb 2', Oy Growth Curves Ab Ltd) containing growth medium (10 μl into 290 μl). Agar plates were incubated at 29°C, and yeast growth was documented by scanning. Liquid cultures were incubated in the ‘Bioscreen C MBR' (Oy Growth Curves Ab Ltd), with the following settings: 29°C, 10 s medium intensity shaking before measurements, 30 min measurement interval, 420–580 nm wideband filter. The net starting OD420-580 was approximately 0.05–0.08 (7.5 mm path length due to the well fill level, blanks subtracted). Areas under growth curves were calculated by adding rectangle areas obtained with the formula 0.5 · (ODi + ODi+1) · (t i+1 - t i), i denoting the ith measurement, not the wavelength in this case, and t the time. The starting OD (t = 0 h) was subtracted from each value.
Results
Brief comparison of yeast transformant growth on solid and in liquid media
Saccharomyces cerevisiae transformants lacking the endogenous ammonium transporters Mep1-3 and the aquaglyceroporin Fps1 (mep1-3▵ fps1▵) were grown at 29°C on agar or in liquid media containing ammonium/ammonia (NH4 +/NH3, pKa ≈ 9.25 at 25°C, Khoo et al. Citation1977) as the sole nitrogen source (). The liquid cultures were incubated in 100-well microplates with 300 μl sample volume and intermittent shaking (10 s at 30 min intervals). On solid and in liquid media, yeast transformants expressing the ammonia-permeable Fps1 or rat AQP1 H180A were more able to thrive at slightly alkaline pH than those expressing the water-selective wild-type rat AQP1 or no AQP. This is suggestive of AQP-dependent uptake of unprotonated ammonia.
Figure 1. Comparison of Saccharomyces cerevisiae mep1-3▵ fps1▵ transformant growth on solid or in liquid media with ammonium as the sole nitrogen source. (A) Transformants expressing the aquaglyceroporin Fps1, the water-selective rat AQP1, an ammonia-permeable mutant of rat AQP1 (H180A), or no AQP, were grown on SD KHL medium containing 76 mM ammonium and micromolar concentrations of lysine, histidine and leucine (pH 5.6 set before autoclaving, not additionally buffered) or on assay medium containing 10 mM ammonium as the sole nitrogen source (40 mM MOPS/NaOH, pH 7.7). From left to right, the OD600 of the yeast suspensions placed on the agar decreased from 1 to 10-3 in ten-fold dilution series. Growth was documented after 3 days of incubation at 29°C. (B) Growth of the same yeast transformants in 300 μl liquid media (10 mM ammonium, 40 mM MOPS/NaOH, pH 7.1, 29°C) detected turbidimetrically (OD420-580). Dashed lines mark the boundaries used to calculate areas under the curves (AUC 48 h). For clarity, every other data point is shown.
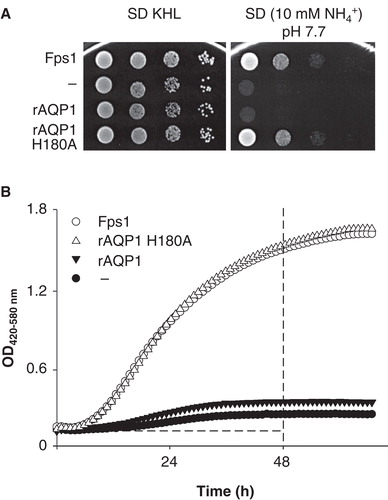
Previous experiments had shown that the nominal pH of solid media needs to be about 7.5 or higher for differences in mep1-3▵ fps1▵ yeast transformant growth to show, but the preparation of agar plates is cumbersome and rather wasteful if numerous conditions are to be tested. In addition, their true pH cannot be measured easily and it probably shifts due to the autoclaving, even with buffering (for this reason a nominal pH of 7.7 was used in the plate assay shown in , whereas a pH of 7.1 was sufficient for liquid media, as seen in ). The automated growth monitoring of liquid cultures provided an opportunity to define more accurately the conditions under which the assay would yield differences in growth between yeast transformants expressing various AQPs. The areas under the growth curves (AUC) were chosen as a measure of yeast growth (Skyttä and Mattila-Sandholm Citation1991) since they do not require prior inspection of whether cells have reached logarithmic or stationary phase. Calculation of AUCs for durations ranging from 12–96 h (starting at 0 h) had indicated a duration of 48 h as a satisfactory compromise between growth contrast (no contrast meaning that two transformants grow equally well) and the length of an experiment (shorter duration preferred).
Expression of Fps1 increases yeast transformant tolerance to alkaline pH at high ammonium concentrations
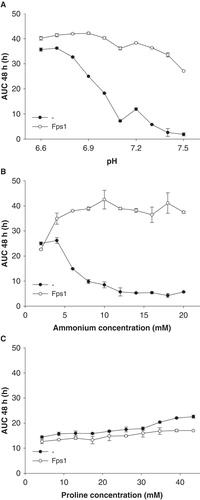
Initially, the pH as well as the ammonium concentration were varied, and proline was tested as an alternative nitrogen source (). By increasing the pH from 6.7–7.5 at a constant ammonium concentration of 10 mM, growth of the AQP-deficient yeast was almost fully abolished, whereas growth of the Fps1-expressing yeast was robust up to a pH of about 7 (). The dependence of AUC on pH appears to be sigmoidal, and although data beyond pH 7.5 is missing, there seems to have been an alkaline shift of the Fps1-AUC-curve by about 0.6 units. Varying the ammonium concentration at a constant pH of 7.1 had a surprising effect (): At 2 mM ammonium (∼ 14 μM ammonia), there was no difference in growth, at 14 mM ammonium (∼ 99 μM ammonia) the difference was fully developed, the opposite of what had been expected. One would have proposed that especially at low concentrations the presence of ammonia-conducting AQPs could provide better access to the external ammonia pool, as shown by the experiments of Jahn et al. (Citation2004), but in this case a different phenomenon seemed to be involved. With proline as the nitrogen source (), AQP-deficient yeast transformants grew slightly more than Fps1-expressing ones. It appeared to be a less efficient nitrogen source than ammonium.
Figure 2. Dependence of Saccharomyces cerevisiae mep1-3▵ fps1▵ transformant growth on pH (A), ammonium concentration (B), and proline as an alternative nitrogen source (C), in the presence or absence of plasmid-encoded Fps1. Unless mentioned otherwise, the pH was 7.1 (40 mM MOPS/NaOH) and the only nitrogen source was ammonium (10 mM). In the experiment shown in Graph A the medium of pH 7.1 was of a different lot, and pH values below 6.9 were buffered by 40 mM MES/NaOH. Growth was detected turbidimetrically (OD420-580) and quantified by calculating areas under growth curves to 48 h (AUC 48 h). Error bars represent SD (n = 3).
Expression of specific aquaporins increases yeast transformant tolerance to unprotonated ammonia
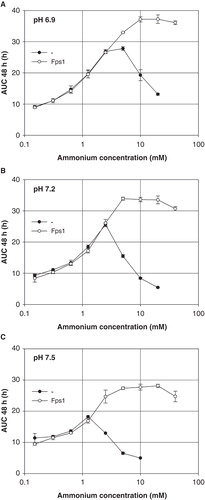
To repeat the experiment and to extend the ammonium concentration range towards lower values, the latter was varied in twofold dilution series at three different pH values (). The previous result () was confirmed. At pH 6.9 or 7.2, Fps1-expressing and AQP-deficient yeast grew equally well up to an ammonium concentration of approximately 2.5 mM (∼ 11 or 22 μM ammonia). At pH 7.5, growth was equal for an ammonium concentration of up to about 1.5 mM (∼ 27 μM ammonia). Higher concentrations of ammonium permitted Fps1 transformants to grow more, although beyond 10 mM (∼ 100 μM ammonia) they were affected as well. The maximum AUC decreased with increasing pH.
Figure 3. Dependence of Saccharomyces cerevisiae mep1-3▵ fps1▵ transformant growth on the ammonium concentration at pH 6.9 (A), 7.2 (B) or 7.5 (C) (40 mM MOPS/NaOH), in the presence or absence of plasmid-encoded Fps1. Growth was detected turbidimetrically (OD420-580) and quantified by calculating areas under growth curves to 48 h (AUC 48 h). Missing data for non-expressing transformants is due to yeast sticking to the edges of the well bottoms after less than 48 h. Error bars represent SD (n = 3).
The individual growth curves confirmed the results of the AUC-plots (Supplementary Figure S1): Below the above-mentioned ammonium concentration thresholds, they were nearly identical for both yeast transformants. At sufficiently high ammonium concentrations, differences in growth showed mainly in differing growth rates and final OD values, whereas lag phase durations appeared to be unaffected.
Plotting the logarithm of the initial ammonia concentration, as calculated by the Henderson-Hasselbalch equation, against the relative growth difference (▵AUC divided by AUCFps1) revealed a remarkable sigmoidal dependence (Supplementary Figure S2A). The experiment was repeated with yeast expressing ammonia-permeable rat AQP1 H180A, and a similar sigmoidal dependence was seen (Figure S2B, online). In both cases ammonia concentrations above about 100 μM were necessary for a marked difference in growth to occur. Concentrations above 700 μM were not obtainable due to precipitation of an unidentified salt (lowering the yeast nitrogen base concentration by half allowed a doubling of the ammonium sulfate concentration, or an increase of the pH by about 0.3 units, but this possibility was not applied).
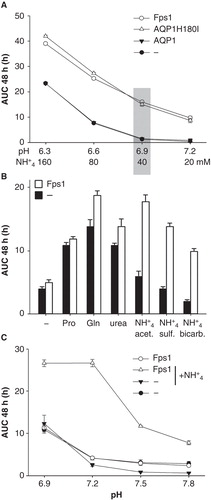
To find out whether the effectiveness of the assay depends on the concentration of unprotonated ammonia, irrespective of the pH, media containing 180 μM ammonia were prepared and tested: 160 mM ammonium at pH 6.3, 80 mM ammonium at pH 6.6, 40 mM ammonium at pH 6.9, and 20 mM ammonium at pH 7.2 (). It turned out that the difference in growth did not depend on the initial ammonia concentration alone. The pH was important as well. Thus, two conditions had to be met for assay media to be effective: The initial pH had to be close to 7, and the initial ammonia concentration had to be above about 100 μM. Following this experiment, a pH of 6.9 and an ammonium concentration of 40 mM were decided upon for subsequent assays (grey shaded area in ), based on considerations of both absolute and relative growth differences between yeast transformants.
Figure 4. Growth of Saccharomyces cerevisiae mep1-3▵ fps1▵ transformants in media of different pH values and various nitrogen sources. (A) Media of different pH but the same initial concentration of unprotonated ammonia (∼ 180 μM) were tested. pH 6.3 and 6.6 were buffered by 40 mM MES/NaOH, pH 6.9 and 7.2 by 40 mM MOPS/NaOH. (B) Yeast expressing Fps1 or no AQP were grown in media at pH 6.9 (40 mM MOPS/NaOH) containing 40 mM proline (Pro), glutamine (Gln), urea, ammonium acetate (NH4 + acet.), ammonium sulfate (NH4 + sulf., 40 mM ammonium ions), ammonium bicarbonate (NH4 + bicarb.) or no (–) added nitrogen source, corresponding to the conditions marked by the grey shaded area in Graph A. (C) Growth of yeast expressing Fps1 or no AQP with 10 mM proline as nitrogen source, and with or without 5 mM ammonium (sulfate salt), as indicated. Please note the different pH-range and ordinate scale as compared to Graph A. Buffering by 40 mM MOPS/NaOH. Growth was detected turbidimetrically (OD420-580) and quantified by calculating areas under growth curves to 48 h (AUC 48 h). Error bars represent SD (n = 4).
Exchange of ammonium by other nitrogen sources does not completely abolish aquaporin-enhanced yeast transformant growth at neutral pH
To explore systematically which nitrogen source may best be suited for a control medium ensuring AQP-independent growth, ammonium ions were replaced with various other nitrogenous compounds. Their choice was based on availability, solubility, and on physiological considerations. Four ammonium salts, urea and 15 amino acids were tested. Data for proline, glutamine, urea and three ammonium salts are shown in . Very similar results were obtained with yeast expressing rat AQP1 H180A (Supplementary Table S1) and Plasmodium falciparum AQP (Hansen et al. Citation2002, data not shown).
The nominal absence of a nitrogen source nevertheless sustained significant yeast growth. The maximum concentration of residual ammonium, coming from the preculture medium (SD KHL), is estimated to have been about 1 μM. Besides the more commonly used proline and glutamine, urea could serve as a nitrogen source. Ammonium ions were a good nitrogen source only for the AQP-expressing yeast. The acetate salt allowed the best growth but the lowest growth contrast, whereas the bicarbonate salt allowed the least growth but the highest contrast. The sulfate salt was intermediate in growth promotion and contrast, as was the chloride (Supplementary Table S1).
Despite the AQP-independent uptake of amino acids, both Fps1- and rat AQP1 H180A-expression improved yeast growth in the presence of amino acids, as seen for glutamine in . In fact, in an experiment using solid media of a nominal pH of 7.6, it did not matter whether glutamine or ammonium served as nitrogen source (Supplementary Figure S3): In both cases water-selective rat AQP1-expressing and non-expressing yeast transformants grew poorly compared to those expressing Fps1, rat AQP1 H180A, or the human aquaglyceroporin AQP9 (Tsukaguchi et al. Citation1999). Since this may have been due to the slow overall growth (colonies appearing after more than five days) and the possibility of glutamine hydrolysis to glutamate and ammonium, an experiment was performed with liquid media of pH 6.9, 7.2, 7.5 and 7.8, containing 10 mM proline as the only nitrogen source (). Proline was chosen assuming that its nitrogen is not as easily extractable as the amide nitrogen of glutamine. It turned out that Fps1-expressing and non-expressing yeast transformants grew almost equally well at pH 6.9–7.8. However, adding 5 mM ammonium to the media (and verifying this did not affect their pH) markedly improved growth of Fps1-expressing yeast at any pH within the range, while subduing growth of non-expressing yeast above pH 6.9. Analogous results were obtained with yeast expressing wild-type rat AQP1 or its mutant H180A (not shown).
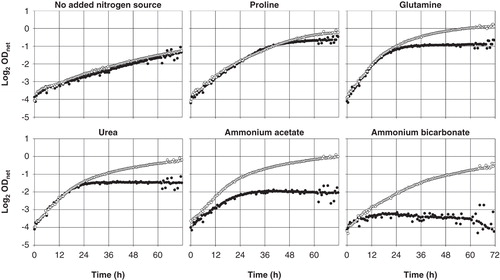
Nevertheless, when looking at individual growth curves () the difference between Fps1-expressing and non-expressing mep1-3▵ fps1▵ yeast transformants is apparent with glutamine or urea as nitrogen sources, indicating an ammonia-independent pH effect. With proline, it is less apparent, or later so (measurements beyond 72 h were not made). Among other proteinogenic amino acids, excluding aromatic and sulfur-containing ones, only isoleucine was comparable to proline in this respect, leucine and serine less so (Supplementary Table S1). The nearly identical growth rates during exponential phase, as seen for glutamine and urea in , were a common feature, with the number of duplications most affected, while ammonium salts clearly affected growth rates as well. Remarkably, the nominal absence of a nitrogen source allowed equal growth of Fps1-expressing and non-expressing yeast, and a similar number of approximately three duplications within 72 h as compared to growth under amino acid or ammonium supplementation, albeit at a lower rate.
Figure 5. Growth of Saccharomyces cerevisiae mep1-3▵ fps1▵ transformants expressing Fps1 (empty circles) or no AQP (filled circles) in media containing 40 mM of the indicated nitrogen source at pH 6.9 (40 mM MOPS/NaOH), detected turbidimetrically (OD420-580). The binary logarithm of the net OD (blank subtracted) is plotted against time. Values up to about 2-1 correlate closely with yeast cell concentration. OD fluctuations are due to a failing light source. Decreasing OD values (ammonium acetate and bicarbonate) are due to yeast sticking to the edges of the well bottoms. Sample growth curves representative of sets of four each, used to calculate the data shown in .
Discussion
We have shown that the growth of S. cerevisiae strain 31019b fps1▵ (mep1-3▵ fps1▵) is decreased by the presence of more than about 10 μM unprotonated ammonia ( and Supplementary Figure S2), especially at neutral or mildly alkaline pH (), and that the expression of some AQPs such as Fps1 increases this threshold to about 100 μM ammonia. This is in contrast with the experiments of Jahn et al. (Citation2004) and Loqué et al. (Citation2005), who found the opposite to be true ( and of the respective publications). A major difference is their use of strain 31019b (mep1-3▵) which retains control over Fps1-expression. Seemingly minor differences include their choice of plasmid, buffer, and potassium concentration.
The exchange of ammonium ions for a variety of amino acids or urea does not fully abolish this effect, a finding that points at a neutral or alkaline pH as the ultimate cause. The literature on S. cerevisiae cytosolic pH (pHc) regulation reveals that the pHc changes with the extracellular pH (Peña et al. Citation1972), that the degree of this change depends on the growth stage of the yeast cells (Imai and Ohno Citation1995, Weigert et al. Citation2009), that it increases upon addition of glucose (Orij et al. Citation2009), and that it increases upon addition of some monovalent cations, notably potassium (Calahorra et al. Citation1998) and ammonium (Peña et al. Citation1987).
The mep1-3▵ fps1▵ yeast strain used in the present work lacks all three ammonium transporters, and the cells were usually added to the medium in their late log or stationary phase, following washing in deionized water. The assay media contained about 150 mM glucose, 7 mM potassium (0.17% yeast nitrogen base), and varying ammonium concentrations. The pH was 6.9 or higher. The lack of ammonium transporters meant that ammonium ions could not enter freely. The potassium ions would have prevented ammonium ions from taking the possible alternative path through potassium channels (Hess et al. Citation2006). The bulk pHc was not measured but may be expected to have been close to 7. Unfacilitated ammonia diffusion through the lipid bilayer portion of the plasma membrane probably contributed significantly to its entry into the cells, since expression of AQPs did not enhance yeast growth at low ammonia concentrations (). When transferring the washed yeast into assay medium, they were probably suffused with ammonia/ammonium before the first duplication, and this likely led to an increase in both cytosolic and vacuolar pH (Greenfield et al. Citation1987, Makarow and Nevalainen Citation1987).
How did some AQPs rescue growth of yeast cells under these conditions? All tested aquaglyceroporins, including Fps1 and human AQP9 (Supplementary Figure S3), had the required property, as did two rat AQP1 selectivity filter mutants but not the water-selective wild-type rat AQP1 (, and Supplementary S2B). Thus, the rescuing property of some AQPs probably had to do with their permeability characteristics. We have shown (Beitz et al. Citation2006) that expression of rat AQP1 H180A by Xenopus laevis oocytes increases their ammonia permeability, while glycerol and urea remain excluded, so the unknown permeant is probably smaller than either of these. It may be ammonia, although why its facilitated membrane permeation should improve yeast tolerance to it remains elusive. Alternatively, Fps1 and rat AQP1 H180A may improve yeast growth by facilitating the permeation of other small molecules such as carbon dioxide (Otto et al. Citation2010) or ethanol (Teixeira et al. Citation2009).
Another clue is provided by the growth curves (Fernandez-Ricaud et al. Citation2007): Increasing ammonia concentrations decreased the growth rate and especially the number of cell duplications (final OD), but did not affect the duration of the lag phase (, and Supplementary Figure S1). In experiments with toxic substances such as mercuric chloride or methylammonium (not shown), the lag phase was strongly affected, pointing to a different kind of growth impairment by ammonia. Replacing ammonium ions with urea or amino acids reduced the effect, with almost only the number of cell duplications affected (). It should be mentioned that the shaking parameters used (10 s shaking every 30 min) did not lead to appreciable resuspension of the yeast cells, as judged by the eye. However, corresponding cultures in Erlenmeyer flasks under constant orbital shaking gave similar results (not shown). Growth on solid media also gave similar results ( and Supplementary Figure S3), although it necessitated a higher nominal pH, possibly due to the autoclaving.
Serrano et al. (Citation2004) have shown that the deleterious effect of alkaline pH on yeast growth is in large part due to the limited availability of copper and iron, probably due to their decreased solubility and intracellular utilization, and that supplementation of these trace elements synergistically improves growth. They have also shown (Casamayor et al. Citation2012) that a concomitant increase of the glucose concentration to 4% (∼ 220 mM) further improves growth. Incidentally, the authors mention the importance of vacuolar function for alkaline tolerance, pointing out that increased alkaline sensitivity caused by deletion of vacuolar function-related genes (e.g., genes encoding vacuolar proton-ATPase subunits) could in many cases not be alleviated by copper and iron supplementation (Serrano et al. Citation2004). Taking these results into consideration, it becomes apparent that ammonia may aggravate the effects of mildly alkaline medium on yeast growth by its accumulation in acidic compartments (Marceau et al. Citation2012). In addition, its strong binding to copper(II) ions (Hathaway and Tomlinson Citation1970) could conceivably hamper uptake of the metal present at approximately 0.25 μM (0.17% yeast nitrogen base) in our experiments.
It is worth mentioning that the intracellular concentration of ammonium/ammonia was found to be about 0.7 mmol/kg of washed and centrifuged yeast (∼ 1.4 mmol/l of cell water) of a commercial strain, using a diffusion/acid trap/titration method (Conway and Breen Citation1945), or about 3–7 mmol/kg of nitrogen-starved, washed and filtered yeast (∼ 6–14 mmol/l of cell water) of strain BY4741, using a commercial ammonium determination kit (Van Nuland et al. Citation2006). In other words, the intracellular ammonium ion concentration of S. cerevisiae cells is of the order of 1–10 mM, and the intracellular ammonia concentration at pH 7 correspondingly 5–50 μM, the concentration range of extracellular ammonia at which growth of AQP-deficient yeast transformants in our experiments began to decrease.
Further experiments may be directed at comparing S. cerevisiae strains 31019b and 31019b fps1▵, and at comparing the effects of ammonia and other amines as done for Dictyostelium discoideum by Davies et al. (Citation1993). Measurements of intracellular ammonia accumulation and of pHc would be worthwhile, as would be iron and copper supplementation to find out whether high concentrations of ammonia or amino acids affect the assimilation of these metal ions at neutral or mildly alkaline pH.
Conclusion
It was our intention to optimize a yeast growth assay for the study of aquaporin-facilitated ammonia permeation. Its development led to the discovery of a curious and unexplained alkaline tolerance-conferring effect of aquaporins with particular selectivity filter characteristics. Ammonia appeared to potentiate this effect, but its presence was not absolutely required. Understanding the nature of this increased tolerance may reveal an overlooked function of aquaporins, possibly regarding energy metabolism.
Figures S1–S3.
Download MS Word (687 KB)Acknowledgements
This work was funded by the European Commission (FP7-HEALTH 201924 EDICT). We wish to thank R. Bill for suggesting the use of an automated microplate incubator, S. Hohmann for kindly providing AQP9-encoding cDNA, and J. von Bülow for helpful comments on the draft.
Declaration of interest: The authors report no conflicts of interest. The authors alone are responsible for the content and writing of the paper.
References
- Beitz E, Wu B, Holm LM, Schultz JE, Zeuthen T. 2006. Point mutations in the aromatic/arginine region in aquaporin 1 allow passage of urea, glycerol, ammonia, and protons. Proc Natl Acad Sci USA 103:269–274.
- Bienert GP, Møller AL, Kristiansen KA, Schulz A, Møller IM, Schjoerring JK, 2007. Specific aquaporins facilitate the diffusion of hydrogen peroxide across membranes. J Biol Chem 282:1183–1192.
- Calahorra M, Martínez GA, Hernández-Cruz A, Peña A. 1998. Influence of monovalent cations on yeast cytoplasmic and vacuolar pH. Yeast 14:501–515.
- Casamayor A, Serrano R, Platara M, Casado C, Ruiz A, Ariño J. 2012. The role of the Snf1 kinase in the adaptive response of Saccharomyces cerevisiae to alkaline pH stress. Biochem J 444:39–49.
- Conway EJ, Breen J. 1945. An ammonia-yeast and some of its properties. Biochem J 39:368–371.
- Davies L, Satre M, Martin JB, Gross JD. 1993. The target of ammonia action in Dictyostelium. Cell 75:321–327.
- Fernandez-Ricaud L, Warringer J, Ericson E, Glaab K, Davidsson P, Nilsson F, 2007. PROPHECY – a yeast phenome database, update 2006. Nucleic Acids Res 35:D463–D467.
- Gietz RD, Schiestl RH, Willems AR, Woods RA. 1995. Studies on the transformation of intact yeast cells by the LiAc/SS-DNA/PEG procedure. Yeast 11:355–360.
- Greenfield NJ, Hussain M, Lenard J. 1987. Effects of growth state and amines on cytoplasmic and vacuolar pH, phosphate and polyphosphate levels in Saccharomyces cerevisiae: A 31P-nuclear magnetic resonance study. Biochim Biophys Acta 926:205–214.
- Hansen M, Kun JF, Schultz JE, Beitz E. 2002. A single, bi-functional aquaglyceroporin in blood-stage Plasmodium falciparum malaria parasites. J Biol Chem 277:4874–4882.
- Hathaway BJ, Tomlinson AAG. 1970. Copper(II) ammonia complexes. Coordin Chem Rev 5:1–43.
- Hess DC, Lu W, Rabinowitz JD, Botstein D. 2006. Ammonium toxicity and potassium limitation in yeast. PLoS Biol 4:e351.
- Imai T, Ohno T. 1995. Measurement of yeast intracellular pH by image processing and the change it undergoes during growth phase. J Biotechnol 38:165–172.
- Jahn TP, Møller AL, Zeuthen T, Holm LM, Klaerke DA, Mohsin B, 2004. Aquaporin homologues in plants and mammals transport ammonia. FEBS Lett 574:31–36.
- Karlgren S, Pettersson N, Nordlander B, Mathai JC, Brodsky JL, Zeidel ML, 2005. Conditional osmotic stress in yeast: A system to study transport through aquaglyceroporins and osmostress signaling. J Biol Chem 280:7186–7193.
- Khoo KH, Culberson CH, Bates RG. 1977. Thermodynamics of the dissociation of ammonium ion in seawater from 5 to 40°C. J Solution Chem 6:281–290.
- Klebl F, Wolf M, Sauer N. 2003. A defect in the yeast plasma membrane urea transporter Dur3p is complemented by CpNIP1, a Nod26-like protein from zucchini (Cucurbita pepo L.), and by Arabidopsis thaliana delta-TIP or gamma-TIP. FEBS Lett 547:69–74.
- Loqué D, Ludewig U, Yuan L, von Wirén N. 2005. Tonoplast intrinsic proteins AtTIP2;1 and AtTIP2;3 facilitate NH3 transport into the vacuole. Plant Physiol 137:671–680.
- Makarow M, Nevalainen LT. 1987. Transport of a fluorescent macromolecule via endosomes to the vacuole in Saccharomyces cerevisiae. J Cell Biol 104:67–75.
- Marceau F, Bawolak MT, Lodge R, Bouthillier J, Gagné-Henley A, C-Gaudreault R, 2012. Cation trapping by cellular acidic compartments: Beyond the concept of lysosomotropic drugs. Toxicol Appl Pharmacol 259:1–12.
- Marini AM, Soussi-Boudekou S, Vissers S, Andre B. 1997. A family of ammonium transporters in Saccharomyces cerevisiae. Mol Cell Biol 17:4282–4293.
- Mollapour M, Piper PW. 2007. Hog1 mitogen-activated protein kinase phosphorylation targets the yeast Fps1 aquaglyceroporin for endocytosis, thereby rendering cells resistant to acetic acid. Mol Cell Biol 27:6446–6456.
- Mumberg D, Müller R, Funk M. 1994. Regulatable promoters of Saccharomyces cerevisiae: Comparison of transcriptional activity and their use for heterologous expression. Nucleic Acids Res 22:5767–5768.
- Nozawa A, Takano J, Kobayashi M, von Wirén N, Fujiwara T. 2006. Roles of BOR1, DUR3, and FPS1 in boron transport and tolerance in Saccharomyces cerevisiae. FEMS Microbiol Lett 262:216–222.
- Orij R, Postmus J, Ter Beek A, Brul S, Smits GJ. 2009. In vivo measurement of cytosolic and mitochondrial pH using a pH-sensitive GFP derivative in Saccharomyces cerevisiae reveals a relation between intracellular pH and growth. Microbiology 155:268–278.
- Otto B, Uehlein N, Sdorra S, Fischer M, Ayaz M, Belastegui-Macadam X, 2010. Aquaporin tetramer composition modifies the function of tobacco aquaporins. J Biol Chem 285:31253–31260.
- Peña A, Cinco G, Gómez-Puyou A, Tuena M. 1972. Effect of the pH of the incubation medium on glycolysis and respiration in Saccharomyces cerevisiae. Arch Biochem Biophys 153:413–425.
- Peña A, Pardo JP, Ramírez J. 1987. Early metabolic effects and mechanism of ammonium transport in yeast. Arch Biochem Biophys 253:431–438.
- Pettersson N, Hagström J, Bill RM, Hohmann S. 2006. Expression of heterologous aquaporins for functional analysis in Saccharomyces cerevisiae. Curr Genet 50:247–255.
- Serrano R, Bernal D, Simón E, Ariño J. 2004. Copper and iron are the limiting factors for growth of the yeast Saccharomyces cerevisiae in an alkaline environment. J Biol Chem 279:19698–19704.
- Shepherd A, Piper PW. 2010. The Fps1p aquaglyceroporin facilitates the use of small aliphatic amides as a nitrogen source by amidase-expressing yeasts. FEMS Yeast Res 10:527–534.
- Skyttä E, Mattila-Sandholm T. 1991. A quantitative method for assessing bacteriocins and other food antimicrobials by automated turbidometry. J Microbiol Methods 14:77–88.
- Teixeira MC, Raposo LR, Mira NP, Lourenço AB, Sá-Correia I. 2009. Genome-wide identification of Saccharomyces cerevisiae genes required for maximal tolerance to ethanol. Appl Environ Microbiol 75:5761–5772.
- Tsukaguchi H, Weremowicz S, Morton CC, Hediger MA. 1999. Functional and molecular characterization of the human neutral solute channel aquaporin-9. Am J Physiol 277:F685–F696.
- Van Aelst L, Hohmann S, Zimmermann FK, Jans AW, Thevelein JM. 1991. A yeast homologue of the bovine lens fibre MIP gene family complements the growth defect of a Saccharomyces cerevisiae mutant on fermentable sugars but not its defect in glucose-induced RAS-mediated cAMP signalling. EMBO J 10:2095–2104.
- Van Nuland A, Vandormael P, Donaton M, Alenquer M, Lourenço A, Quintino E, 2006. Ammonium permease-based sensing mechanism for rapid ammonium activation of the protein kinase A pathway in yeast. Mol Microbiol 59:1485–1505.
- Weigert C, Steffler F, Kurz T, Shellhammer TH, Methner FJ. 2009. Application of a short intracellular pH method to flow cytometry for determining Saccharomyces cerevisiae vitality. Appl Environ Microbiol 75:5615–5620.
- Wu B, Altmann K, Barzel I, Krehan S, Beitz E. 2008. A yeast-based phenotypic screen for aquaporin inhibitors. Pflugers Arch 456:717–720.
- Wu B, Steinbronn C, Alsterfjord M, Zeuthen T, Beitz E. 2009. Concerted action of two cation filters in the aquaporin water channel. EMBO J 28:2188–2194.
- Wysocki R, Chéry CC, Wawrzycka D, Van Hulle M, Cornelis R, Thevelein JM, 2001. The glycerol channel Fps1p mediates the uptake of arsenite and antimonite in Saccharomyces cerevisiae. Mol Microbiol 40:1391–1401.