Abstract
Solid-state NMR combined with sample deuteration was used to probe the proximity of the low-affinity substrate D-glucose to its binding site within the Escherichia coli sugar transport protein GalP. Samples of E. coli inner membranes with amplified expression of GalP were incubated in D2O with D-[13C6]glucose and 13C NMR signals from the substrate were assigned in two-dimensional dipolar-assisted rotational resonance (DARR) spectra. The signals were confirmed as representing D-glucose bound to GalP as the peaks were abolished after the substrate was displaced from the specific site with the inhibitor forskolin. The 13C chemical shift values for D-[13C6]glucose in solution revealed some differences compared to those for ligand bound to GalP, the differences being most pronounced for positions C1 and C2, and especially for C1 in the α-anomer. 13C cross-polarization build-up was measured for C1 and C2 of D-[13C6]glucose and D-[2H7, 13C6]glucose in GalP membranes suspended in D2O. The build-up curves for the deuterated substrate reflect intermolecular 1H-13C interactions between the protein and the fully deuterated substrate; the signal build-up suggests that the α-anomer is situated closer to the protein binding site than is the β-anomer, consistent with its relatively high signal intensities and more pronounced chemical shift changes in the 2D-correlation spectra. These results demonstrate the utility of solid-state NMR combined with sample deuteration for mapping the binding interface of low affinity ligands with membrane proteins.
Introduction
Despite the widespread importance and abundance of membrane proteins in biological systems and the fact that they are the molecular targets for approximately half of current validated medicines (Drews Citation2000, Hopkins and Groom Citation2002, Lundstrom Citation2006, Overington et al. Citation2006) and remain a principal target for new drug discovery (Rask-Andersen et al. Citation2011), they represent less than 1% of protein structures deposited in the Protein Data Bank (PDB) (http://blanco.biomol.uci.edu/Membrane_Proteins_xtal.html, White Citation2009). This is due to various challenges associated with applying the main biophysical techniques used for high-resolution protein structure elucidation: X-ray crystallography and solution-state NMR spectroscopy (Tate Citation2010, Bill et al. Citation2011, Patching Citation2011).
The use of solid-state NMR dipolar recoupling experiments combined with isotope-labelling of ligand and protein (using 2H, 13C, 15N, 19F, 31P), can provide high-resolution structural details about ligands in membrane proteins. This information can be determined in the absence of a high-resolution structure for the whole protein or combined with a protein structure obtained using other techniques. The technique has been particularly successful with systems that have tight-binding (nM to low μM affinity) ligands (Williamson Citation2009). Examples of such experiments include observations of light-induced structural changes of retinal within rhodopsin (Gröbner et al. Citation2000), the conformation of the neurotransmitter acetylcholine bound to the nicotinic acetylcholine receptor (Williamson et al. Citation2007), the structure of the neuropeptide bradykinin bound to the human G-protein coupled receptor bradykinin B2 (Lopez et al. Citation2008), the structure of the high-affinity amantadine binding site in the M2 proton channel from influenza A virus (Cady et al. Citation2010, Wang et al. Citation2011) and the conformation of ATP within the Na+,K+-ATPase nucleotide site (Middleton et al. Citation2011). To gain a more detailed picture of the protein-ligand complex it is also important to understand how ligands make contact with their binding sites; with appropriate method development, solid-state NMR can also provide such details.
The Escherichia coli sugar transporter GalP, which has a molecular weight of 52 kDa (Martin et al. Citation1994, Citation1995), transports hexose sugars including D-glucose and D-galactose into the cell across the inner bacterial membrane and is homologous with the human D-glucose transport protein GLUT1 (Baldwin and Henderson Citation1989). It is particularly common for transporters like GalP to have low affinity ligands, since efficient release is just as important as binding for physiological activity. 13C cross-polarization magic-angle spinning (CP-MAS) solid-state NMR has already been used to observe signals for the specific binding of 13C-labelled D-glucose to GalP expressed up to levels of 50% of total protein in native inner membrane preparations (), and the signals are abolished when glucose is displaced by the high-affinity competitor ligand forskolin (Spooner et al. Citation1994, Appleyard et al. Citation2000, Patching et al. Citation2004a). The ability to observe signals from specifically bound (forskolin-displaceable) glucose has been used to screen mutant forms of GalP for sugar binding (Patching et al. Citation2008a) and to detect a through-space interaction between the α-anomer of D-glucose and tryptophan residues in the sugar binding site of GalP using the dipolar recoupling experiment dipolar-assisted rotational resonance (DARR) (Patching et al. Citation2008b). This latter work detected a selective through-space interaction between C-1 in the α-anome of D-glucose and C-1 in tryptophan residues of the protein, whereas no interaction was detected with the β-anomer.
In this work we assess whether Hartmann-Hahn 1H-13C cross polarization build-up rates can provide useful information on the interaction between the GalP protein and the α- and β-anomers of D-glucose (). Ligand perdeuteration is exploited to detect contacts between protons in the GalP protein and 13C in the glucose substrate. We also report some of the general technical issues which must be overcome before performing such measurements on low affinity ligands of membrane proteins.
Materials and methods
Membrane preparation
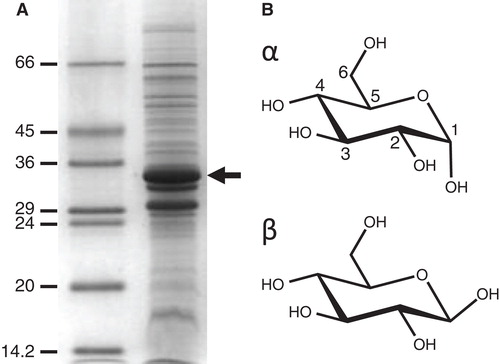
E. coli strain JM1100 with the plasmid pPER3(His6) for expressing wild-type GalP with a His6-tag was grown in minimal medium containing 28 mM D-glucose, as described previously (Ward et al. Citation2000), in batch culture or in a 30-l fermenter (Applikon). E. coli cells were disrupted using a French press (Sim Aminco) or by using a cell disruptor (Constant Cell Disruption Systems) followed by separation of inner/outer membranes by sucrose-density gradient ultracentrifugation (Ward et al. Citation2000). The inner membrane fraction was washed three times by resuspension in 20 mM Tris-HCl buffer (pH 7.5) followed by ultracentrifugation, resuspension in the same buffer and storage at −80°C after rapid freezing. The total protein concentration in the final suspensions was determined by the method of Schaffner and Weissmann (Citation1973) and the % GalP content was estimated by densitometric analysis on the proteins resolved by SDS-PAGE and stained with Coomassie Brilliant Blue ().
Figure 1. Amplified expression of the E. coli sugar transport protein GalP and chemical structures of its substrate D-glucose. (A) Coomassie-stained SDS-PAGE separation of proteins in an E. coli inner membrane preparation with amplified expression of GalP (arrow). The numbers on the left-hand side represent the sizes of the molecular weight markers in kDa. (B) Structure of the GalP substrate D-glucose drawn in its α and β configurations.
NMR sample preparation
NMR measurements were performed on E. coli inner membrane preparations that contained ∼ 5 mg (100 nmoles) of GalP protein at a concentration of ∼ 1 mM and 13C-labelled D-glucose at a concentration of 10 mM. The membranes were thawed and suspended to a volume of 8 ml in 20 mM Tris-HCl buffer (pH 7.5) or in D2O, then incubated at 4°C for 1 h. The membranes were collected by ultracentrifugation (100,000 g) then resuspended to a volume of 3 ml in 20 mM Tris-HCl buffer (pH 7.5) or in D2O with D-[13C6]glucose (99% 13C; Cambridge Isotope Laboratories) or with D-[2H7, 13C6]glucose (99% 13C, 97% 2H; Cortecnet) at a concentration of 10 mM with brief vortexing to mix the sample, followed by incubation at 4°C overnight. When used, forskolin (2 mM with 2% ethanol, final concentrations) was pre-incubated with the membranes for 30 min at 4°C before adding the labelled D-glucose. The membranes were collected by ultracentrifugation (100,000 g) and then packed into a zirconia MAS NMR sample rotor (4 mm external diameter, 100 μl volume) using brief slow spins in a bench-top centrifuge.
NMR conditions
1H-13C CP-MAS NMR experiments were performed with the sample at a temperature of −15°C using a Bruker Avance 400 spectrometer equipped with a double-resonance solid-state MAS probe tuned to 100.13 MHz for 13C and 400.1 MHz for 1H. A sample spinning frequency of 4 kHz was used throughout and spectra were acquired with 8 k or 20 k scans. A spin-lock field of 63 kHz was applied at the proton frequency during Hartmann-Hahn cross-polarization at contact times of 1–8 ms, and TPPM decoupling (Bennett et al. Citation1995) at 85 kHz was applied during the acquisition period. A linear ramped pulse was applied at the 1H frequency during the contact time. The 13C power level during pulses in CP experiments was 60 kHz. A recycle delay of 1 sec was used in both cross polarization and direct pulse experiments. The estimated 1H T1 is around 200 ms, and the recycle delay is sufficient to re-establish the equilibrium spin populations before collecting each transient. The estimated 13C T1 is around 1–2 sec, and so a 1 sec recycle delay does not allow complete longitudinal relaxation between transients. This does not present a problem for interpreting the experiments presented as only comparative ligand peak intensities before and after adding the inhibitor forskolin are of interest. Chemical shifts were referenced to adamantane at 37.8 ppm and spectra were processed with 40 Hz exponential line broadening. The true sample temperature was estimated by observing the sideband signals in a separate sample of DOPC lipids at a temperature of −23°C, which have a phase transition at −18.3 ± 3.6°C (Koynova and Caffrey Citation1998). Two-dimensional 13C-13C broadband dipolar recoupled spectra were obtained using the dipolar-assisted rotational resonance (DARR) experiment (Takegoshi et al. 2001). Spectra were recorded with 128 hypercomplex points in the indirect dimension and averaging of 800 transients per t1 increment. After evolution in the indirect dimension, the 13C magnetization was stored longitudinally with a 4 μs pulse and a mixing time of 20 ms was applied during which the proton nutation frequency was adjusted to the spinning frequency of 4 kHz. A final 4 μs read-out pulse was applied at the 13C frequency prior to digitization. The 13C power level during pulses was 62.5 kHz. The spectral width was 349.9 ppm in both directions.
Results and discussion
Selective detection of D-glucose bound to GalP
In this work, all 13C CP-MAS NMR experiments were performed at −15°C on preparations of E. coli inner membranes with amplified expression of GalP () and D-glucose at a concentration of 10 mM. The low temperature is necessary to reduce substrate dynamics within the binding site (to facilitate cross-polarization) and substrate exchange between the free and bound environments. The high D-glucose concentration is necessary to saturate the binding sites of the low affinity (KD ∼ 0.2 mM, Walmsley et al. Citation1994) substrate. shows a 13C CP-MAS NMR spectrum of D-[13C6]glucose in the E. coli membranes, highlighting the well-resolved peaks for C1 of the substrate in the 1:2 intensity ratio representing the equilibrium concentrations of the α and β anomers. The remaining substrate peaks occur in the 60–80 ppm region, where they overlap with each other and with background signals from the membrane proteins and lipids. The effective concentration of binding sites within the overexpressed protein is approximately 1 mM (based on measurement of the total protein concentration in the membranes and the % contribution of GalP determined by densitometric analysis of the proteins resolved by SDS-PAGE). Hence, with low-affinity substrate binding approximately 9 mM of D-glucose will remain free in the aqueous medium. Under these frozen conditions, the peaks for D-glucose potentially contain contributions from the substrate in its free and bound environments, and the extent that each environment contributes to the observed peak intensities depends on both the substrate populations and mobility.
Figure 2. 13C NMR spectra (obtained with 4 kHz MAS) of inner membrane preparations from E. coli with amplified expression of GalP (∼ 1 mM) in H2O with 10 mM D-[13C6]glucose. The sample temperature was −15°C and each spectrum is the result of accumulating 20480 transients. (A–C) 13C CP-MAS NMR spectra obtained before (A) and after (B) addition of forskolin in ethanol (final concentrations 2 mM and 2%, respectively) and a difference spectrum (C) obtained by subtracting B from A. (D–E) Direct excitation 13C MAS spectra of the same samples obtained before (D) and after (E) addition of forskolin and a difference spectrum (F) obtained by subtracting E from D. The negative peaks in F are from the ethanol solvent. Addition of ethanol alone to the membranes had no effect upon either the CP-MAS or direct excitation spectra. Note that disappearance of signals for carbonyl carbons in the direct excitation spectra D and E is the result of their fast relaxation rate; this does not affect the conclusions drawn from the comparison of spectra D and E.
![Figure 2. 13C NMR spectra (obtained with 4 kHz MAS) of inner membrane preparations from E. coli with amplified expression of GalP (∼ 1 mM) in H2O with 10 mM D-[13C6]glucose. The sample temperature was −15°C and each spectrum is the result of accumulating 20480 transients. (A–C) 13C CP-MAS NMR spectra obtained before (A) and after (B) addition of forskolin in ethanol (final concentrations 2 mM and 2%, respectively) and a difference spectrum (C) obtained by subtracting B from A. (D–E) Direct excitation 13C MAS spectra of the same samples obtained before (D) and after (E) addition of forskolin and a difference spectrum (F) obtained by subtracting E from D. The negative peaks in F are from the ethanol solvent. Addition of ethanol alone to the membranes had no effect upon either the CP-MAS or direct excitation spectra. Note that disappearance of signals for carbonyl carbons in the direct excitation spectra D and E is the result of their fast relaxation rate; this does not affect the conclusions drawn from the comparison of spectra D and E.](/cms/asset/e8bc61d4-41d7-418f-8801-5a7f8955150b/imbc_a_743193_f0002_b.jpg)
To obtain useful information about substrate binding, measures must be taken to observe signals exclusively from D-glucose bound to the transport site of GalP and free of overlapping background signals. This was achieved with the addition of forskolin to the membranes, which selectively displaces D-[13C6]glucose from the GalP transport site (Martin et al. Citation1994, Citation1995, Spooner et al. Citation1994, Appleyard et al. Citation2000, Patching et al. Citation2004a, Citation2008a, Citation2008b). Forskolin displacement of D-[13C6]glucose diminishes the intensities of the substrate peaks, leaving the background signals unchanged (). This occurs probably because the displaced glucose moves from a constrained environment in the GalP binding site, which facilitates rapid cross-polarization, to the aqueous environment where it is less constrained, even at −15°C, and cross-polarization is very inefficient. We confirmed this explanation by performing identical 13C CP-MAS NMR measurements on 10 mM D-[13C6]glucose alone in aqueous solution at −15°C. In the absence of GalP, no signal from glucose was observed at contact times of 1–8 ms (data not presented). For the membrane sample, a small signal from D-[13C6]glucose remains after addition of forskolin, which probably represents residual D-glucose bound to GalP and inaccessible to forskolin, or to a minor population of D-glucose associated with other sites in the membrane. Subtraction of the second spectrum from the first leaves a difference spectrum in which only resonances for D-[13C6]glucose bound to GalP are represented (). When measuring 1H-13C cross-polarization rates for D-glucose bound to GalP, spectra representing total glucose and forskolin-displaced glucose must be obtained at each contact time and the build-up intensity curves are obtained from the difference spectra.
When the forskolin displacement procedure is observed using MAS NMR with direct 13C excitation, the entire spectrum remains essentially unaffected by the addition of forskolin (). This is because direct 13C excitation detects the total D-glucose in the membranes and cannot discriminate between the different substrate environments, and so is insensitive to redistribution of the substrate following displacement by forskolin.
Assignment of 13C peaks for D-[13C6]glucose under frozen conditions
It was necessary to assign the peaks for substrate in the spectrum of D-[13C6]glucose in the E. coli inner membranes with amplified expression of the GalP protein. Peak assignment was accomplished using a two-dimensional 13C-13C DARR experiment with a short mixing time () to observe cross-peaks for 13C nuclei in close proximity with each other (within ∼ 6 Å). Signals which could be assigned include the majority of positions from the β-anomer and just C1 and C2 from the α-anomer, which give a notably strong cross-peak signal in this experiment despite its smaller anomeric contribution. Signals for the other positions (C3-C6) in the α-anomer are not resolved from those of the β-anomer. The 13C chemical shift values for D-[13C6]glucose in these membranes are compared with the values recorded for D-[13C6]glucose by solution-state NMR (, top, and ). This revealed differences, which were minor for C5 and C6, but were more pronounced with C1 and C2, especially for C1 in the α-anomer with a difference of ∼ 2 ppm. Note however that the DARR spectrum was obtained in the absence of forskolin and so the measured chemical shifts represent total glucose in the membranes and do not necessarily reflect the environment of glucose within GalP. The assignments are nevertheless valid for D-glucose bound to GalP because the peaks in the difference spectrum obtained with forskolin displacement (, bottom) occur at the same frequencies as the cross peaks in the DARR spectrum.
Figure 3. Experiments to assign the 13C NMR spectrum of D-[13C6]glucose in inner membrane preparations from E. coli with amplified expression of GalP. (A) Top: A simulated 1D 13C NMR spectrum of D-glucose calculated from the measured chemical shift values for D-[13C6]glucose in water but using line widths comparable to those for D-[13C6]glucose in the membrane preparations. Bottom: An experimental 1D CP-MAS NMR spectrum of D-[13C6]glucose in the GalP membranes obtained with 4 kHz MAS and a contact time of 1 ms. Comparison of the simulated and experimental spectra with similar line widths highlights the differences in chemical shifts for glucose in the two environments. (B) Region of a 2D DARR spectrum of D-[13C6]glucose in the GalP membranes obtained with 8 kHz MAS, showing the cross peaks assigned to glucose. The measured chemical shifts were used to peak fit the 1D spectrum in (B), by varying only the peak widths and areas (as shown in the overlaid deconvolution in B). The experimental temperature was −15°C.
![Figure 3. Experiments to assign the 13C NMR spectrum of D-[13C6]glucose in inner membrane preparations from E. coli with amplified expression of GalP. (A) Top: A simulated 1D 13C NMR spectrum of D-glucose calculated from the measured chemical shift values for D-[13C6]glucose in water but using line widths comparable to those for D-[13C6]glucose in the membrane preparations. Bottom: An experimental 1D CP-MAS NMR spectrum of D-[13C6]glucose in the GalP membranes obtained with 4 kHz MAS and a contact time of 1 ms. Comparison of the simulated and experimental spectra with similar line widths highlights the differences in chemical shifts for glucose in the two environments. (B) Region of a 2D DARR spectrum of D-[13C6]glucose in the GalP membranes obtained with 8 kHz MAS, showing the cross peaks assigned to glucose. The measured chemical shifts were used to peak fit the 1D spectrum in (B), by varying only the peak widths and areas (as shown in the overlaid deconvolution in B). The experimental temperature was −15°C.](/cms/asset/4f66fa9f-3d64-4f13-a52c-a2bf1e0336f4/imbc_a_743193_f0003_b.jpg)
Table I. 13C chemical shifts for D-[13C6]glucose.
Intermolecular 1H-13C polarization transfer for 13C-labelled D-glucose bound to GalP
The objective of this work was to use 1H-13C CP-MAS ‘build-up' rates measured from peak intensities obtained at different cross-polarization contact times to provide qualitative information on the interactions between the two anomers of D-glucose and GalP. The principle of the 1H-13C CP-MAS build-up experiment is illustrated in . Magnetization is excited on 1H nuclei and transferred under the Hartmann-Hahn condition to nearby 13C nuclei during contact times typically ranging from 1–10 ms. The magnetization that has been transferred to the 13C nuclei is then detected to give signals in the 13C NMR spectrum. Only 13C nuclei that are close enough to 1H nuclei and immobilized sufficiently for the cross-polarization process to be efficient will give a 13C NMR signal. For fully protonated D-[13C6]glucose in membranes suspended in H2O, the 13C signal build-up is rapid because polarization transfer is dominated by short-range intramolecular 1H-13C interactions between directly bonded nuclei, and also because the substrate is motionally restrained by freezing (). Consequently, signal from the substrate is detected even at the relatively short contact time of 1 ms (, top). At a contact time of 8 ms the signal from substrate diminishes owing to nuclear relaxation in the rotating frame (, bottom). These dominant intramolecular interactions do not provide useful information about ligand-protein contacts.
Figure 4. Investigation of using NMR samples in D2O and with a 2H,13C-labelled ligand for solid-state NMR measurements on membrane proteins with low affinity ligands under frozen conditions. A shows the possible sources of 1H-13C CP interactions that can contribute to the 13C signal for a membrane protein sample in H2O with a 13C-labelled ligand under frozen conditions (< −10°C). The grey circle represents a 13C-labelled ligand that binds to a membrane protein expressed in native membranes or that is purified and reconstituted in lipid membranes. The 1H-13C CP interactions are labelled as follows: (i) 1H in the ligand backbone; (ii) 1H in ligand hydroxyl groups (or other exchangeable groups); (iii) 1H in water molecules that are frozen/immobilized (non-specific); (iv) protein non-exchangeable 1H (specific binding); (v) protein exchangeable 1H (specific binding); (vi) membrane non-exchangeable 1H (non-specific); (vii) membrane exchangeable 1H (non-specific). B shows 1H-13C CP-MAS NMR spectra for E. coli inner membranes with amplified expression of GalP containing D-[13C6]glucose at a concentration of 10 mM prepared in H2O with the sample at a temperature of −15°C and acquired using CP contact times of 1 ms (upper spectrum) and 8 ms (lower spectrum). C shows the possible sources of 1H-13C CP interactions that can contribute to the 13C signal for a membrane protein sample in D2O with a 2H,13C-labelled ligand under frozen conditions (< −10°C), where the 1H-13C interactions are labelled as described above. D shows 1H-13C CP-MAS NMR spectra for E. coli inner membranes with amplified expression of GalP containing D-[2H7,13C6]glucose at a concentration of 10 mM prepared in D2O with the sample at a temperature of −15°C and acquired using CP contact times of 1 ms (upper spectrum) and 8 ms (lower spectrum). In B and D, the hatched box highlights the region where the 13C signals for D-glucose appear in the spectrum.
![Figure 4. Investigation of using NMR samples in D2O and with a 2H,13C-labelled ligand for solid-state NMR measurements on membrane proteins with low affinity ligands under frozen conditions. A shows the possible sources of 1H-13C CP interactions that can contribute to the 13C signal for a membrane protein sample in H2O with a 13C-labelled ligand under frozen conditions (< −10°C). The grey circle represents a 13C-labelled ligand that binds to a membrane protein expressed in native membranes or that is purified and reconstituted in lipid membranes. The 1H-13C CP interactions are labelled as follows: (i) 1H in the ligand backbone; (ii) 1H in ligand hydroxyl groups (or other exchangeable groups); (iii) 1H in water molecules that are frozen/immobilized (non-specific); (iv) protein non-exchangeable 1H (specific binding); (v) protein exchangeable 1H (specific binding); (vi) membrane non-exchangeable 1H (non-specific); (vii) membrane exchangeable 1H (non-specific). B shows 1H-13C CP-MAS NMR spectra for E. coli inner membranes with amplified expression of GalP containing D-[13C6]glucose at a concentration of 10 mM prepared in H2O with the sample at a temperature of −15°C and acquired using CP contact times of 1 ms (upper spectrum) and 8 ms (lower spectrum). C shows the possible sources of 1H-13C CP interactions that can contribute to the 13C signal for a membrane protein sample in D2O with a 2H,13C-labelled ligand under frozen conditions (< −10°C), where the 1H-13C interactions are labelled as described above. D shows 1H-13C CP-MAS NMR spectra for E. coli inner membranes with amplified expression of GalP containing D-[2H7,13C6]glucose at a concentration of 10 mM prepared in D2O with the sample at a temperature of −15°C and acquired using CP contact times of 1 ms (upper spectrum) and 8 ms (lower spectrum). In B and D, the hatched box highlights the region where the 13C signals for D-glucose appear in the spectrum.](/cms/asset/4a964639-4636-4014-b10e-2e8e97a4c910/imbc_a_743193_f0004_b.jpg)
The dominance of intramolecular polarization transfer can in principle be circumvented by perdeuterating the substrate. When the same experiment is performed for D-[2H7, 13C6]glucose in D2O (to exchange the OH protons for deuterons), 13C signal build-up is substantially slower because polarisation transfer is, in principle, now limited to longer-range intermolecular 1H-13C interactions (). Consequently, little or no signal for D-glucose is observed at short (e.g., 1 ms) contact times (, top), but the signal increases substantially at a contact time of 8 ms as a result of the slow build-up of polarization via long-range 1H-13C couplings (, bottom). These intermolecular 1H-13C interactions may involve protons within the substrate binding site of GalP and at other membrane sites outside the specific site, and so the forskolin displacement procedure (e.g., ) is required to observe build-up rates exclusively for the specifically bound substrate. Furthermore, residual OH protons in D-[2H7, 13C6]glucose (i.e., arising from exchange with HDO in the aqueous medium) could provide a mechanism for intramolecular 1H-13C transfer which contributes to the observed build-up curves. The proton MAS spectrum of E. coli membranes washed and suspended in D2O gives a residual water (HDO) signal that is 10.6% of the water signal in membranes suspended in H2O. Hence a tenth of the glucose hydroxy groups are protonated in the membranes suspended in D2O, and this needs to be taken into account in the analysis of the build-up curves. With appropriate control experiments, build-up curves on the deuterated sample could therefore provide useful details about the proximity of different carbon sites of D-glucose with the binding interface of GalP.
Cross-polarization build-up rates for D-glucose
shows the build-up of measured peak intensities for D-glucose from variable contact time 13C CP-MAS experiments on D-[13C6]glucose in membranes suspended in D2O and D-[2H,13C6]glucose in membranes suspended in D2O. The peak intensities were measured only at the frequencies of C1 and C2 of D-glucose, because they are the only positions that show distinct resonances for the α and β anomers. The signal intensities were measured from difference spectra obtained with forskolin displacement as described earlier, and therefore correspond specifically to D-glucose in the GalP transport site. Peaks for C1 in the two anomers are well separated from the other peaks for D-glucose and so the intensities could be measured unambiguously. Peaks for C2 occur in a crowded region of the D-glucose spectrum and intensities could only be obtained by line fitting analysis (e.g., , bottom), and so are less reliable than the measurements for C1.
Figure 5. Cross-polarization build-up curves for C1 and C2 in D-glucose from samples of GalP membranes in D2O. 13C signal intensities normalized to the highest value are shown for C1 and C2 in the α and β anomers of D-glucose (based on chemical shifts from the DARR spectrum in ) from 1H-13C CP-MAS spectra recorded at a range of contact times on samples of GalP membranes in D2O with D-[13C6]glucose (A) and with D-[2H7, 13C6]glucose (B) under frozen conditions. Both samples contained GalP at a concentration of ∼ 1 mM and the labelled D-glucose at a concentration of 10 mM. A sample temperature of −15°C and MAS at 4 kHz was used. Spectra were recorded over 20480 scans at each contact time.
![Figure 5. Cross-polarization build-up curves for C1 and C2 in D-glucose from samples of GalP membranes in D2O. 13C signal intensities normalized to the highest value are shown for C1 and C2 in the α and β anomers of D-glucose (based on chemical shifts from the DARR spectrum in Figure 3B) from 1H-13C CP-MAS spectra recorded at a range of contact times on samples of GalP membranes in D2O with D-[13C6]glucose (A) and with D-[2H7, 13C6]glucose (B) under frozen conditions. Both samples contained GalP at a concentration of ∼ 1 mM and the labelled D-glucose at a concentration of 10 mM. A sample temperature of −15°C and MAS at 4 kHz was used. Spectra were recorded over 20480 scans at each contact time.](/cms/asset/362e190f-a516-41ec-96e0-e17526d23fb0/imbc_a_743193_f0005_b.jpg)
For the sample with D-[13C6]glucose () peaks for C1 and C2 of the two anomers reached maximum intensity at a contact time of 2 ms because intramolecular 1H-13C interactions between directly bonded spins dominate the rate of cross-polarization. The sample with D-[2H7, 13C6]glucose () gave somewhat slower intensity build-ups for C1 and C2, arising from longer range 1H-13C cross-polarization involving protons in the GalP protein and possibly also the fraction of protonated hydroxyl groups in D-glucose. Control measurements were conducted to estimate the contribution to the build-up curves made by 13C coupling to the residual hydroxyl protons of glucose. A 10 mM solution of glucose (i.e., the total glucose concentration in the membrane samples) was prepared in 10% H2O/90% D2O (representing the residual HDO observed in the membrane sample) and 13C CP-MAS measurements were performed under virtually identical conditions to those above, except that the temperature was reduced to −50°C to immobilize D-glucose in solution and facilitate cross-polarization (as confirmed with fully protonated glucose). Under these conditions, no signal was detected above the noise from D-[2H7, 13C6]glucose with 10% of hydroxyl groups protonated. The signal build-up curves for D-[2H7, 13C6]glucose in the E. coli membranes in D2O can be confidently attributed to intermolecular 1H-13C interactions.
For the measurements on D-[2H7, 13C6]glucose, the rate of cross-polarization build-up for C1 and C2 of the β-anomer is slower than for the α-anomer. As the build-up curves represent intermolecular 1H-13C transfer between GalP and glucose, the data suggest that C1 and C2 of the β-anomer do not come into as close contact with the protein binding site as do C1 and C2 in the α-anomer. A closer proximity with the protein binding site of C1 and C2 in the D-glucose α-anomer over the β-anomer is also consistent with our previous DARR experiments performed on 13C-labelled D-glucose bound to GalP in native membranes in which tryptophan residues were labelled at C1 with 13C (Patching et al. Citation2008b). This work detected a selective through-space interaction between C1 in the α-anomer of D-glucose and C1 in tryptophan residues of the protein and no interaction was detected with the β-anomer. Together these results suggest that there is anomeric discrimination for D-glucose transport by GalP, a phenomenon that has been suggested for other sugar transport proteins (Fukasawa et al. Citation2009, Citation2012).
Conclusions
CP-MAS solid-state NMR has been used to characterize ligand binding with GalP and a number of other transport proteins expressed in native membranes that have low affinity ligands (Spooner et al. Citation1994, Citation1998, Patching et al. Citation2004a, Citation2004b, Xie et al. Citation2004, Basting et al. Citation2006, Patching et al. Citation2008a, Citation2008b, Rahman et al. Citation2008). Here, this work has established the utility of deuteration in solid-state NMR samples to eliminate potential non-specific contributions to ligand signals in spectra from samples of a membrane protein interacting with a low affinity ligand at temperatures below freezing, including cryogenic conditions. These conditions enabled successful acquisition of 2D-correlation spectra from dipolar recoupling experiments to detect signals for D-glucose specifically bound to the E. coli sugar transport protein GalP in native membranes. A comparison of signal intensities and measurement of chemical shift values in the 2D spectra for D-glucose suggested that the C1 and C2 positions, especially C1 in the α-anomer, are in closest proximity with the protein binding site and/or are held in the most rigid environments. This was supported by measurement of cross-polarization build-up for C1 and C2 from samples of GalP membranes in D2O with D-[13C6]glucose and D-[13C6, 2H7]glucose, which distinguish intramolecular (within the ligand) from intermolecular (ligand-protein) interactions, respectively. The developed conditions can now be combined with isotope-labelling of the protein and dipolar recoupling experiments to probe further interactions and measure precise distances between the ligand and the protein and so elucidate structure of the ligand binding site. These types of sample conditions will also be useful with membrane protein systems that have ligand-protein interactions in which conformational flexibility plays a role in mechanism.
Acknowledgements
This work was funded by the EPSRC [EP/G035695/1] and the EU EDICT consortium (contract 201924). The authors thank Malcolm Levitt (University of Southampton) for support.
Declaration of interest: The authors report no conflicts of interest. The authors alone are responsible for the content and writing of the paper.
References
- Appleyard AN, Herbert RB, Henderson PJF, Watts A, Spooner PJR. 2000. Selective NMR observation of inhibitor and sugar binding to the galactose-H+ symport protein GalP, of Escherichia coli. Biochim Biophys Acta 1509:55–64.
- Baldwin SA, Henderson PJF. 1989. Homologies between sugar transporters from eukaryotes and prokaryotes. Ann Rev Physiol 51:459–471.
- Basting D, Lehner I, Lorch M, Glaubitz C. 2006. Investigating transport proteins by solid state NMR. N-S Arch Pharmacol 372:451–464.
- Bennett AE, Rienstra CM, Auger M, Lakshmi KV, Griffin RG. 1995. Heteronuclear decoupling in rotating solids. J Chem Phys 103:6951–6958.
- Bill RM, Henderson PJF, Iwata S, Kunji ER, Michel H, Neutze R, 2011. Overcoming barriers to membrane protein structure determination. Nat Biotechnol 29:335–340.
- Cady SD, Schmidt-Rohr K, Wang J, Soto CS, DeGrado WF, Hong M. 2010. Structure of the amantadine binding site of influenza proton channels in lipid bilayers. Nature 463:689–692.
- Drews J. 2000. Drug discovery: A historical perspective. Science 287:1960–1964.
- Fukasawa T, Sakurai H, Nogi Y, Baruffini E. 2009. Galactose transporters discriminate steric anomers at the cell surface in yeast. FEMS Yeast Res 9:723–731.
- Fukasawa T, Abe A, Nakamura A, Horigome M, Naito A. 2012. Solid-state NMR spectroscopy reveals anomer specific transport of galactose in the milk yeast Kluyveromyces lactis. FEMS Yeast Res 12:415–422.
- Gröbner G, Burnett IJ, Glaubitz C, Choi G, Mason AJ, Watts A. 2000. Observations of light-induced structural changes of retinal within rhodopsin. Nature 405:810–813.
- Hopkins AL, Groom CR. 2002. The druggable genome. Nat Rev Drug Discov 1:727–730.
- Koynova R, Caffrey M. 1998. Phases and phase transitions of the phosphatidylcholines. Biochim Biophys Acta 1376:91–145.
- Lopez JJ, Shukla AK, Reinhart C, Schwalbe H, Michel H, Glaubitz C. 2008. The structure of the neuropeptide bradykinin bound to the human G-protein coupled receptor bradykinin B2 as determined by solid-state NMR spectroscopy. Angew Chem Int Edit 47:1668–1671.
- Lundstrom K. 2006. Latest development in drug discovery on G protein-coupled receptors. Curr Protein Pept Sci 7:465–470.
- Martin GEM, Seamon KB, Brown FM, Shanahan MF, Roberts PE, Henderson PJF. 1994. Forskolin specifically inhibits the bacterial galactose-H+ symport protein, GalP, of Escherichia coli. J Biol Chem 269:24870–24877.
- Martin GEM, Walmsley AR, Henderson PJF. 1995. The kinetics and thermodynamics of the binding of forskolin to the galactose-H+ transport protein, GalP, of Escherichia coli. Biochem J 308:261–268.
- Middleton DA, Hughes E, Esmann M. 2011. The conformation of ATP within the Na,K-ATPase nucleotide site: A statistically constrained analysis of REDOR solid-state NMR data. Angew Chem Int Edit 50:7041–7044.
- Overington JP, Al-Lazikani B, Hopkins AL. 2006. Opinion – how many drug targets are there? Nat Rev Drug Discov 5:993–996.
- Patching SG, Herbert RB, O'Reilly J, Brough AR, Henderson PJF. 2004a. Low 13C-background for NMR-based studies of ligand binding using 13C-depleted glucose as carbon source for microbial growth: 13C-Labeled glucose and 13C-forskolin binding to the galactose-H+ symport protein GalP in Escherichia coli. J Am Chem Soc 126:86–87.
- Patching SG, Brough AR, Herbert RB, Rajakarier AR, Henderson PJF, Middleton DA. 2004b. Substrate affinities for membrane transport proteins determined by 13C cross polarisation magic-angle spinning nuclear magnetic resonance spectroscopy. J Am Chem Soc 126:3072–3080.
- Patching SG, Psakis G, Baldwin SA, Baldwin J, Henderson PJF, Middleton DA. 2008a. Relative substrate affinities of wild-type and mutant forms of the Escherichia coli sugar transporter GalP determined by solid-state NMR. Mol Memb Biol 25:474–484.
- Patching SG, Henderson PJF, Herbert RB, Middleton DA. 2008b. Solid-state NMR spectroscopy detects interactions between tryptophan residues of the E. coli sugar transporter GalP and the alpha-anomer of the D-glucose substrate. J Am Chem Soc 130:1236–1244.
- Patching SG. 2011. NMR structures of polytopic integral membrane proteins. Mol Memb Biol 28:370–397.
- Rahman M, Patching SG, Ismat F, Henderson PJF, Herbert RB, Baldwin SA, 2008. Probing metal ion substrate-binding to the E. coli ZitB exporter in native membranes by solid-state NMR. Mol Memb Biol 25:683–690.
- Rask-Andersen M, Sällman Almén M, Schiöth HB. 2011. Trends in the exploitation of novel drug targets. Nat Rev Drug Discov 10:579–590.
- Schaffner W, Weissmann C. 1973. Rapid, sensitive and specific method for determination of protein in dilute solution. Anal Biochem 56:502–514.
- Spooner PJR, Rutherford NG, Watts A, Henderson PJF. 1994. NMR observation of substrate in the binding-site of an active sugar-H+ symport protein in native membranes. Proc Natl Acad Sci USA 91:3877–3881.
- Spooner PJR, O'Reilly WJ, Homans SW, Rutherford NG, Henderson PJF, Watts A. 1998. Weak substrate binding to transport proteins studied by NMR. Biophys J 75:2794–2800.
- Tate CG. 2010. Practical considerations of membrane protein instability during purification and crystallisation. Methods Mol Biol 601:187–203.
- Takegoshi K, NakamuraS, Terao. 2001. 13C-1H dipolar-assisted rotational resonance in magic-angle spinning NMR. Chem Phys Lett 344:631–637.
- Walmsley AR, Martin GE, Henderson PJF. 1994. 8-Anilino-1-naphthalenesulfonate is a fluorescent probe of conformational changes in the D-galactose-H+ symport protein of Escherichia coli. J Biol Chem 269:19009–17019.
- Wang J, Qiu JX, Soto C, DeGrado WF. 2011. Structural and dynamic mechanisms for the function and inhibition of the M2 proton channel from influenza A virus. Curr Opin Struct Biol 21:68–80.
- Ward A, Sanderson NM, O'Reilly J, Rutherford NG, Poolman B, Henderson PJF. 2000. The amplified expression, identification, purification, assay and properties of hexahistidine-tagged bacterial membrane transport proteins. In: Baldwin SA, editor. Membrane transport – a practical approach. Oxford, UK: Blackwell. pp 141–166.
- White SH. 2009. Biophysical dissection of membrane proteins. Nature 459:344–346.
- Williamson PTF, Verhoeven A, Miller KW, Meier BH, Watts A. 2007. The conformation of acetylcholine at its target site in the membrane-embedded nicotinic acetylcholine receptor. Proc Natl Acad Sci USA 104:18031–18036.
- Williamson PTF. 2009. Solid-state NMR for the analysis of high affinity ligand/receptor interactions. Concept Magnetic Res 34A:144–172.
- Xie H, Patching SG, Gallagher MP, Litherland GJ, Brough AR, Venter H, 2004. Purification and properties of the Escherichia coli nucleoside transporter NupG, a paradigm for a major facilitator transporter sub-family. Mol Memb Biol 21:323–336.