Abstract
We report details of the interaction of sodium metasilicate with osteoblast cellular membranes using Fluoresceinphosphatidylethanolamine (FPE) as a fluorescent indicator of membrane interactions. Fluorescence imaging studies of the FPE-based indicator system revealed areas of localized binding that would be consistent with the presence of a structure with ‘receptor-like’ properties. From these results, it seems unlikely that silica binds ‘non-specifically’ to the osteoblast surface. Moreover, the receptors are localized into membrane domains. Such regions of the cell membrane could well be structures such as ‘rafts’ or other such localized domains within the membrane. The binding profile of silica with the osteoblast cell surface takes place with all the characteristics of a receptor-mediated process best represented by a cooperativity (sigmoidal) binding model with a Hill coefficient of 3.6.
Introduction
Silicon is the second most prevalent element on the earth after oxygen (Carlisle Citation1982) and can be found in many different forms in food, drink and the environment. Deprivation of dietary silica has shown consistent deficiency signs in all studies conducted to date, including effects on the skull, long bones and other connective tissues (Carlisle Citation1972, Citation1974, Citation1976a, Citation1976b, Citation1980a, Citation1980b, Citation1982, Schwarz and Milne Citation1972, Carlisle and Alpenfels Citation1980). These abnormalities suggest that silica plays an essential role in bone biology. Much research has been directed towards the role of silica in bone growth but there is a significant lack of understanding of the processes by which silica can interact directly with bone cells (Brasser et al. Citation2008, Ehrlich et al. Citation2010). In particular, it is not clear whether silica interacts non-specifically with the cell surface or whether there are receptor systems that underlie the interaction. The latter could include specific receptors for silica in its various chemical forms or others with their own ligands but which are subverted to interact with silica. The subsequent signaling processes that follow the interaction and consequently the mechanism by which cells respond to the presence of silica will, therefore, to a certain extent be dependent upon which type of binding mechanism takes place.
In recent years these latter questions have come to the fore as there has been an accelerating interest in structures associated with molecular scaffolds for regenerative medicine of which silica-based structures feature prominently (Arcos and Vallet-Regi Citation2010, Wang et al. Citation2011). Thus a range of silica containing bioactive glasses, (composed of Na2O-CaO-P2O5-SiO2), have been developed and are now in clinical use (Hench Citation1994, Cao and Hench Citation1996, Arcos and Vallet-Regi Citation2010). These materials are reported to react at a cellular level in the body to enhance osteoblast proliferation a process termed osteoproductive (Wilson and Low Citation1992). They are also osteoconductive, a term meaning that the bone grows in direct contact with the implant surface in the body (Hench Citation1998). How silica affects the behaviour of living cells therefore, is becoming a major question that must be answered if we are to exploit fully the enormous potential of stem cells for next-generation medicine.
In the present study we make use of our longstanding expertise in measuring intermolecular interactions with cells. A particularly versatile tool for making such measurements involves the modified phospholipid Fluoresceinphosphatidylethanolamine (FPE). This has been characterized as a real-time indicator of the electrostatic surface potential (ψs) of cell membranes originally by Wall et al. (Citation1995b), using phospholipid membranes (Golding et al. Citation1996) and with the mammalian cell surface (Wall et al. Citation1995a). Under appropriate conditions, cells may be labelled with FPE, at a level of ca. one molecule of FPE to 1000 molecules of phospholipids which is a level of labelling which is virtually non-invasive. As the surface potential is a function of the net surface charged density, the binding of charged molecules leads to changes in the surface potential and are observed as changes in fluorescence. This method is suitable therefore for monitoring the interaction of charged molecules with biological membranes (Sim et al. Citation2004). In the present study, this method has been utilized to evaluate the interaction of silica with osteoblast cellular membranes in real time and with great sensitivity.
There are two virtues that FPE offers in making measurements of molecular interactions with cells. The first is that as FPE is essentially a phospholipid it can be used in studies with both cell membranes and model membranes (Wall et al. Citation1995a, Citation1995b). Thus a direct comparison can be made between the cell membrane and a phospholipid membrane to identify if there are specific, i.e., receptor-mediated interactions or whether the interactions are simply lipid-based. The second advantage of this approach is that FPE is a fluorescent probe and so for cell interactions by implementing a fluorescence imaging approach it is possible to obtain information of any localization of the silica-cell interactions. In the present study therefore we have taken advantage of both of these properties to define the nature of the cell interactions of silica. The results indicate that silica appears to target cell surface receptors and that these receptors are clustered on the cell surface most likely in membrane rafts.
Materials and methods
Materials
Tissue culture reagents, sodium metasilicate and all other chemicals were supplied by Sigma, UK. Tissue culture plastics were supplied by Becton Dickinson, UK. The fluorescent probe FPE was synthesized as described previously (Wall et al. Citation1995a).
Isolation of primary human osteoblasts
Primary human osteoblasts were isolated from femoral head trabecular bone obtained from patients undergoing hip replacement surgery. Cells were characterized as osteoblasts by measuring bone cell markers including alkaline phosphatase, osteocalcin and type I collagen production (Sim et al. Citation2004).
Stopped-flow spectrofluorimetry
Labelling of primary human osteoblasts with FPE
Cells were harvested at a concentration of 2 × 10⁶/ml and centrifuged at 1200 RPM for 5 min. The pellet was resuspended in 5 ml of sucrose buffer (10 mM Tris, 280 mM Sucrose pH 7.5). The primary human osteoblasts were labelled with the FPE dye. Briefly, 15 μl of FPE dye (2 mg/ml) in methanol/chloroform was added into a polycarbonate tube. The organic solvent was removed under a stream of nitrogen gas followed by re-solvation with 15 μl of ethanol. The cell suspension was added to the FPE suspension and the mixture was incubated for 45 min at 37°C in the dark. Unbound FPE was removed by repeated washing with sucrose buffer (two times) by centrifugation. The final cell pellet was then resuspended in 5 ml of sucrose buffer.
The interaction of sodium metasilicate with FPE labelled primary human osteoblasts was investigated to obtain binding profiles. Time resolution of silica interactions with the osteoblasts were monitored with an Applied Photophysics Ltd (Leatherhead, Surrey, UK) SX.18MV-R stopped-flow fluorimeter. Cells and sodium metasilicate concentrations (1, 5, 10, 50 and 100 µg/ml) were loaded into separate syringes. The volumes were mixed equally together in the mixing chamber and measured for any changes of fluorescence following excitation at 490 nm. Measurements were taken over a split time scale of 0.1 sec and 1 sec. For each concentration of silica, four readings were taken and then averaged. The Applied Photophysics Ltd SX.18MV-R stopped-flow fluorimeter software was used to fit the average values to a single exponential rate equation (Equation 1).
where y is equal to the fluorescence signal at the time t and y1 is the axis intercept for the rate constant k1. The offset represents any offset to the level of fluorescence.
The changes in fluorescence amplitude obtained by fitting the stopped-flow traces to the single exponential equation were further analyzed using standard data-fitting software such as EasyPlot or Prism. The change in fluorescence amplitude versus the corresponding silica concentration were plotted and fitted to various binding models (Equation 2 and 3) as follows:
Hyperbolic binding model
where ‘a’ is equal to the saturation point and ‘b’ is the molecular dissociation constant Kd.
Cooperative binding model
where ‘a’ is the asymptotic saturation, ‘b’ is the Kd and ‘c’ is the ‘Hill coefficient’ which indicates the number of monomers interacting.
The data obtained from Equations 2 and 3 were assessed by calculating the standard deviation and the ‘goodness of fit’ r 2 parameter for each binding model. The lower the standard deviation (SD) and the closer r 2 is to 1, the better the data fits to the model.
Spatial imaging of localized interactions of sodium metasilicate on the human osteoblast cell surface
Primary human osteoblasts were harvested from a confluent flask and seeded at a concentration of 2 × 10³/ml on to a dish which was modified with a glass cover slip insert, in complete DMEM. Cells were incubated for 24 h at 37°C. FPE was prepared as described previously. DMEM from the cell culture dish was removed and the cells were washed with sucrose buffer. The FPE/sucrose mixture (2 ml) was added to the dish and the cells were incubated for 45 min at 37°C. After the incubation, the dye solution was discarded and any excess dye was removed by washing the cell layer using sucrose buffer. This was then replaced with fresh buffer (2 ml). Cells were then used for confocal imaging. Primary human osteoblasts were viewed using a Leica Confocal Laser Scanning Microscope (CLSM), (Leica, UK). The objective was immersed under oil. A representative group of individual cells were selected. A 1024 × 1024 pixel field was scanned using the 488 nm laser line. Optical sections were taken every 0.3 μm. Fluorescence images of the cells were taken at ×63 (objective) magnification.
Sodium metasilicate was then added to the dish to give a final concentration of 100 µg/ml. Fluorescence images of the cells were collected again keeping all the parameters the same. To the same cells, 25 μl of 1 M Ca2+ (5 mM final concentration) was added to saturate the membrane. Following this, again, fluorescence images were taken keeping all the parameters the same. Images were analyzed using the Leica Confocal Software package, (Leica, UK) on maximum projection images. Region of Interest lines (ROIs) were drawn across ‘hot spots’ in the osteoblast membrane in the same region of the cell for those with and without the silica addition. Maximum amplitude values were recorded. Levels of fluorescence in other areas of the cell membrane were also recorded.
Results
The interaction of sodium metasilicate with human osteoblasts studied using stopped-flow spectrofluorimetry
Solutions of sodium metasilicate and FPE labelled human osteoblasts were mixed in a stopped-flow mixing spectrofluorimeter. Addition of the sodium metasilicate led to an initial increase of FPE fluorescence, as shown in followed by a slower decline in fluorescence. These signal changes are characteristic of the addition of the sodium metasilicate and are essentially an increase in the concentration of the total ambient electrolyte. The increase of fluorescence therefore, is consistent with well-characterized response of the FPE-based electrostatic indicator system to electrolyte concentration (Wall et al. Citation1995b).
Figure 1. Example trace showing the change in fluorescence upon mixing (arrow) of 100 µg/ml sodium metasilicate and FPE labelled HOBs with the single exponential fit. This Figure is reproduced in colour in the online version of Molecular Membrane Biology.
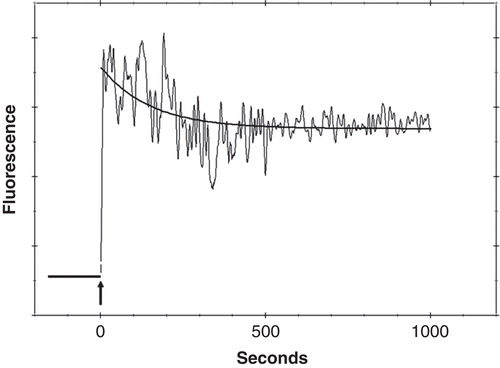
The slower decline of fluorescence, however, is most likely the result of the addition of negative charge to the cell membrane surface as the silica binds and is consistent with the mode of action of the indicator system. In other words elevated levels of electrolyte lead to an increase of fluorescence signal but additional binding of either a positively-charged or negatively-charged species leads to an increase or decrease of fluorescence, respectively. Addition of a simpler electrolyte than sodium metasilicate such as KCl or CaCl2 simply leads to an increase of fluorescence of the HOB cells as illustrated in our earlier publications [ (Sim et al. Citation2004)] and with single cells below in . In fact the fluorescence response of FPE-labelled cells to challenge from increased electrolyte serves as a verification that the osteoblast membranes have been successfully labelled with FPE and that the fluorophore is correctly located at the membrane surface and responds to changes in the surface potential in the same fashion as other previously characterized cell types (Asawakarn et al. Citation2001, Cladera et al. Citation2001).
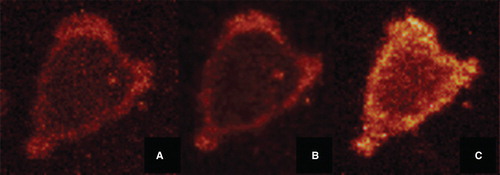
Figure 2. FPE labelled osteoblast imaged using a Leica SP2 Confocal Laser Scanning Microscope. (A) shows a FPE labelled osteoblast – fluorescence can be clearly identified at the cell membrane. (B) shows the same cell, after the addition of 100 µg/ml sodium metasilicate. A decrease in fluorescence is observed. (C) shows the same cell, after the addition of Ca2+ ions (5 mM CaCl2). An increase in fluorescence is clearly visible. This Figure is reproduced in colour in the online version of Molecular Membrane Biology.
The solid line illustrated in represents a theoretical fit to the negative changes of fluorescence consistent with a pseudo-first order reaction. The equation of the line (see Equation 1, Materials and methods) yields a rate constant and an amplitude parameter. The latter represents the extent of the reaction of the sodium metasilicate with the HOBs cell surface.
Receptor-mediated binding of the interaction of sodium metasilicate with human osteoblasts
Following titration with increasing levels of sodium metasilicate with the HOBs and subsequent data fitting as detailed above, a series of values of the fluorescence amplitudes were obtained and plotted against the respective amount of sodium metasilicate added. The change in fluorescence observed with increasing sodium metasilicate concentrations reached saturation point at ca. 50 µg/ml.
The cumulative data obtained from complete sets of titrations of sodium metasilicate indicated that a sigmoidal function (Equation 3) best fitted the observed data rather than the simpler hyperbolic profile characteristic of a single population of binding sites with no cooperativity. For the sake of clarity an attempt to fit the data to a hyperbolic binding isotherm function (Equation 2) is also illustrated in . It is clear that the hyperbolic ‘fits’ poorly to the data set and indicates that a more sophisticated binding mechanism is taking place.
Figure 3. Binding profile based on a complete set of sodium metasilicate titrations with FPE labelled human osteoblasts. The black line shows the fit for a hyperbolic function (Equation 2). The dashed line shows the fit for a sigmoidal function (Equation 3). This Figure is reproduced in colour in the online version of Molecular Membrane Biology.
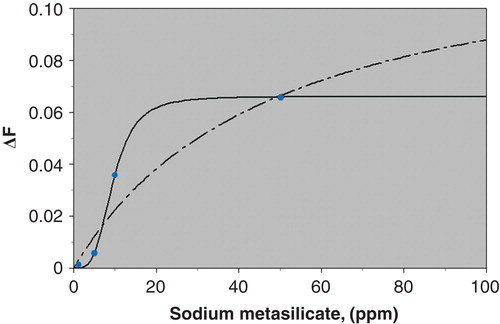
The sigmoidal binding profile suggests that sodium metasilicate may bind to the HOB cell membranes in a cooperative manner. The index of cooperativity sometimes referred to as the Hill coefficient (see Equation 3) obtained from the sigmoidal fit was 3.60, suggesting that sodium metasilicate binds to the membrane as a trimeric complex. The various reasons for this are discussed below but the implication is that the binding is most likely to be receptor-medicated rather than just simple adsorption to the cell membrane.
Fluorescence imaging of the interaction of sodium metasilicate with human osteoblasts
There are indications from the foregoing sections that sodium metasilicate binding to HOBs may well be receptor-mediated. In the remaining sections of the present study, therefore, we explore the possibility that the receptor-mediated binding is spatially localized about the cell surface. This is feasible because one of the virtues of the electrostatic-indicator system we have developed is that it is fluorescence-based and it lends itself to imaging studies using Confocal laser scanning microscopy or other fluorescence-based imaging systems (Cladera et al. Citation2001, Cladera and O’Shea Citation2001). This facilitates direct comparisons between studies with populations of cells (as above) with those of single cells.
Images of the spatial variation of fluorescence about the single HOB cell surface were obtained as shown in in a similar manner to studies with many other cell types (Cladera et al. Citation2001, Cladera and O’Shea Citation2001, O’Shea, Citation2004). The variation of the fluorescence intensity indicates the variation of the surface charge density about the cell surface. With the addition of an electrolyte such as CaCl2 however, the overall fluorescence intensity increases as anticipated according to the mode of action of FPE and as outlined above. Experiments designed to study the interaction of the sodium metasilicate are also illustrated in . In these studies the addition of metasilicate leads to a reduction in the fluorescence signal intensities. According to the fluorescence excursion shown in this is to be expected as the second (binding) phase of the metasilicate leads to a signal reduction. For the sake of clarity, it is worth emphasizing that in these imaging experiments the earlier effects of the sodium ion additions are obscured and only the slower changes resulting from the addition of the metasilicate binding are recorded. Attempts at quantification were undertaken by determining the fluorescence intensity of localized regions of a single cell following the additions of sodium metasilicate.
Spatial localization of the interactions of sodium metasilicate on the human osteoblast cell surface
Fluorescence images of human osteoblasts were acquired prior to and following the addition of sodium metasilicate. It is clear from the images that the effects of this are highly heterogeneous spatially with some changes in particular regions much more pronounced than others. The implication of this is that the sodium metasilicate is binding to a greater and lesser extent depending upon the locality of the binding region. In an attempt to quantitate this we have determined the maximum fluorescence intensities over defined spatial regions before and after the sodium metasilicate addition.
illustrates the protocol devised to illustrate the localized interactions. This Figure shows a region of interest drawn onto the image and this same ROI is compared before and after the addition of the sodium metasilicate. The intensity profiles are then recorded as shown in . It is clear from these profiles that the anticipated reduction of the fluorescence intensity takes place following addition of sodium metasilicate. After several such studies it was apparent, however, that the intensity changes were not uniform about the cell surface. In other words if the metasilicate binding is as we suggest, receptor-mediated, then the receptors may well be clustered on the cell surface. This proposition is discussed further below.
Figure 4. Human osteoblasts labelled with FPE and imaged using a Leica SP2 Confocal Laser Scanning Microscope. Fluorescence can be clearly identified at the cell membrane. The region of interest for analysis is identified by the arrow across the cell membrane (A). Intensity profiles were generated by measuring the fluorescence intensity across the ROI before (black) and after (grey) the addition of sodium metasilicate (B). This Figure is reproduced in colour in the online version of Molecular Membrane Biology.
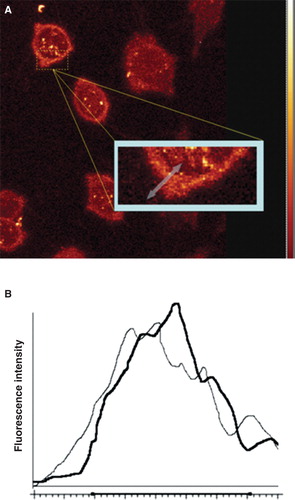
It is worth also emphasizing that the well-established mode of action of the FPE measurement system (O’Shea Citation2003) responds to the addition of salt by increasing the fluorescence yield as the salt concentration increases (Wall et al. Citation1995b, Cladera and O’Shea Citation2001). This is distinct from the effect of binding silicate which leads to a decrease of signal. Thus indicates the effect of the salt concentration increase (as sodium metasilicate) followed by the slower decrease of signal due to the binding of the negatively charged silicate. In there are observable increases of the total signal which implies that no silicate is ultimately binding; however, in other regions a net decrease is observed to take place thus indicating that silicate must bind as this would not be easily explained by any other means.
Discussion
Sodium metasilicate has a net electronegative charge making the electrostatic sensing method appropriate for the study of the silica binding profile. Information on the binding capacity and the affinity of silica for the osteoblast membrane was therefore obtained in a manner similar to several other studies we have performed with a variety of molecular species thought to interact with cell membranes (Cladera and O’Shea Citation2001). This can then be analyzed by mathematical fitting of the experimental data to specific binding models in order to more fully understand the cellular interactions of this important inorganic anion.
Experiments were undertaken to study the early interactions of silica with FPE-labelled osteoblast membranes. Titrations showed that the saturation of silica binding to the osteoblast membrane occurs at approximately 50 µg/ml sodium metasilicate. Data obtained from a complete set of titrations of sodium metasilicate were used to determine the binding profile, which was found to be best described by a sigmoidal function (Equation 3) as opposed to the much simpler hyperbolic function (Equation 2). The sigmoidal shape of the curve (), reveals an element of cooperativity upon the binding of silica to the osteoblast membrane. When fitted to this binding model, the data yields a Hill coefficient of 3.6. One interpretation of this is that at least three molecules of silica come together in a cooperative manner in order to reach a final conformation necessary for binding. On this basis, it seems likely that the silica-cell interactions are mediated by a ‘receptor system’. This system may not be specific just for silica; it is possible that the silica may be interacting with the osteoblast by using an existing receptor system for other soluble species. Members of the scavenger receptor family, for example, are expressed by both osteoclasts and osteoblasts and have been implicated in bone biology including osteoclast differentiation and uptake of cholesterol by osteoblasts (Lin et al. Citation2007, Brodeur et al. Citation2008). In macrophages, scavenger receptors have been shown to bind silica (Hamilton et al. Citation2008). It is, therefore, feasible that a member of this receptor family may be facilitating the binding of silica to osteoblasts observed in this study.
FPE labelled osteoblasts were used to study the molecular interactions of silica on the cell membrane. Any fluorescent technique can also be implemented in an imaging system and the FPE binding technique has been developed in this way (O’Shea Citation2003). Thus, studies were undertaken to measure any localized binding that may take place that would be consistent with the presence of a structure with ‘receptor-like’ properties. Osteoblasts were labelled with FPE and then imaged. The addition of silica to the FPE labelled osteoblasts showed a decrease in fluorescence localized in ‘hot spots’ on the membrane surface. However, the background levels of fluorescence (where the region of interest line spans areas of the cell membrane not in the hot spot), range in-between similar values suggesting that the binding of sodium metasilicate is localized to the hot spot in the membrane. From these results it seems likely that certain regions on the osteoblast membrane are involved in the binding of silica and suggest that it is less likely that the silica binds ‘non-specifically’ to the surface. In other words, a ‘receptor-mediated’ binding is present. Moreover, the receptors are localized into membrane domains. Such regions of the cell membrane could well be structures such as ‘rafts’ or clathrin-coated pits.
Rafts are plasma membrane domains that serve as docking sites for some proteins involved in signal transduction. Similarly to receptor mediated endocytosis, rafts play roles in endocytosis and transcytosis (Simons and Ikonen Citation1997). It is possible that membrane receptors, possibly in rafts or pits, could therefore play a role in the uptake and trafficking of silica by the osteoblast, but further work would be needed to confirm this.
Conclusions
The present study demonstrates the suitability of the use of the membrane electrostatic surface potential sensor FPE to monitor the interaction of silica with the osteoblast cell membrane and in particular to define the nature of the silica binding site on the membrane. Although the role of silica in bone has been well documented, a mechanism of action between silica and the osteoblast has hitherto not been established. The present study provides an insight into the molecular processes involved in the interaction between silica and the osteoblast cell membrane and contributes to an understanding of material implants on cellular behaviour. This may prove valuable in promoting beneficial interactions between implants and human tissue and the future design of bioactive materials. The next stage of this work will necessitate studies to determine the nature of any signaling processes that are consequent to the binding reactions following confirmation of the nature of the receptor type to which the silica binds.
Declaration of interest: The authors report no conflicts of interest. The authors alone are responsible for the content and writing of the paper.
References
- Arcos D, Vallet-Regi M. 2010. Sol-gel silica-based biomaterials and bone tissue regeneration. Acta Biomater 6:2874–2888.
- Asawakarn T, Cladera J, O’Shea P. 2001. Effects of the membrane dipole potential on the interaction of saquinavir with phospholipid membranes and plasma membrane receptors of Caco-2 cells. J Biol Chem 276:38457–38463.
- Brasser HJ, Krijger GC, Wolterbeek HT. 2008. On the beneficial role of silicon to organisms: A case study on the importance of silicon chemistry to metal accumulation in yeast. Biol Trace Elem Res 125:81–95.
- Brodeur MR, Brissette L, Falstrault L, Luangrath V, Moreau R. 2008. Scavenger receptor of class B expressed by osteoblastic cells are implicated in the uptake of cholesteryl ester and estradiol from LDL and HDL3. J Bone Miner Res 23:326–337.
- Cao WP, Hench LL. 1996. Bioactive materials. Ceramics Int 22:493–507.
- Carlisle EM. 1972. Silicon – essential element for the chick. Science 178:619–621.
- Carlisle EM. 1974. Silicon as an essential element. Federation Proc 33:1758–1766.
- Carlisle EM. 1976a. Bone cell silicon stores and interrelationships established with other elements. Federation Proc 35:256–256.
- Carlisle EM. 1976b. In vivo requirement for silicon in articular-cartilage and connective-tissue formation in the chick. J Nutrit 106:478–484.
- Carlisle EM. 1980a. Biochemical and morphological-changes associated with long-bone abnormalities in silicon deficiency. J Nutrit 110:1046–1056.
- Carlisle EM. 1980b. Silicon requirement for normal skull formation in chicks. J Nutrit 110:352–359.
- Carlisle EM. 1982. The nutritional essentiality of silicon. Nutrit Rev 40:193–198.
- Carlisle EM, Alpenfels WF. 1980. Silicon requirement for normal growth of cartilage in culture. Federation Proc 39:787–787.
- Cladera J, Martin I, O’Shea P. 2001. The fusion domain of HIV gp41 interacts specifically with heparan sulfate on the T-lymphocyte cell surface. EMBO J 20:19–26.
- Cladera J, O’Shea P. 2001. Generic techniques for fluorescence measurements of protein-ligand interactions; real-time kinetics and spatial imaging. In: Harding SE, Chowdhry B, editors. Protein-ligand interactions: Structure and spectroscopy. Oxford, UK: University Press.
- Ehrlich H, Demadis KD, Pokrovsky OS, Koutsoukos PG. 2010. Modern views on desilicification: Biosilica and abiotic silica dissolution in natural and artificial environments. Chem Rev 110:4656–4689.
- Golding C, Senior S, Wilson MT, O’Shea P. 1996. Time resolution of binding and membrane insertion of a mitochondrial signal peptide: Correlation with structural changes and evidence for cooperativity. Biochemistry 35:10931–10937.
- Hamilton RF Jr, Thakur SA, Holian A. 2008. Silica binding and toxicity in alveolar macrophages. Free Radic Biol Med 44:1246–1258.
- Hench LL. 1994. Bioactive ceramics: Theory and clinical applications. Bioceramics 7:3–14.
- Hench LL. 1998. Bioactive materials: The potential for tissue regeneration. J Biomed Mat Res 41:511–518.
- Lin YL, De Villiers WJ, Garvy B, Post SR, Nagy TR, Safadi FF, et al. 2007. The effect of class a scavenger receptor deficiency in bone. J Biol Chem 282:4653–4660.
- O’Shea P. 2003. Intermolecular interactions with/within cell membranes and the trinity of membrane potentials: Kinetics and imaging. Biochem Soc Trans 31:990–996.
- O’Shea P. 2004. Membrane potentials; measurement, occurrence and roles in cellular function In: Walz D, Teissie J, Milazzo G, editors. Bioelectrochemistry of membranes. Basel: Birkhauser Verlag.
- Schwarz K, Milne DB. 1972. Growth-promoting effects of silicon in rats. Nature 239:333–334.
- Sim B, Cladera J, O’Shea P. 2004. Fibronectin interactions with osteoblasts: Identification of a non-integrin-mediated binding mechanism using a real-time fluorescence binding assay. J Biomed Mater Res A 68:352–359.
- Simons K, Ikonen E. 1997. Functional rafts in cell membranes. Nature 387:569–572.
- Wall J, Ayoub F, O’Shea P. 1995a. Interactions of macromolecules with the mammalian cell surface. J Cell Sci 108(Pt 7):2673–2682.
- Wall J, Golding CA, Van Veen M, O’Shea P. 1995b. The use of fluoresceinphosphatidylethanolamine (FPE) as a real-time probe for peptide-membrane interactions. Mol Membr Biol 12:183–192.
- Wang S, Falk MM, Rashad A, Saad MM, Marques AC, Almeida RM, et al. 2011. Evaluation of 3D nano-macro porous bioactive glass scaffold for hard tissue engineering. J Mater Sci Mater Med 22:1195–1203.
- Wilson J, Low SB. 1992. Bioactive ceramics for periodontal treatment – comparative-studies in the patus monkey. J Appl Biomater 3:123–129.