Abstract
Posttraumatic stress disorder (PTSD) disrupts hypothalamic-pituitary-adrenal (HPA) axis function. Given the established role of HPA axis hormones in regulating bone metabolism, we tested the hypothesis that traumatic stress has a negative impact on bone development. We employed a variant single prolonged stress (SPS) model in which several stressors were applied to three week old C57BL/6J mice. Compared to the controls, the stressed mice showed increased freezing behavior reminiscent of PTSD symptoms. At two weeks, bone mineral content (BMC), bone area (B area) and bone mineral density (BMD) in total body based on dual-energy X-ray absorptiometry (DXA) analysis were reduced by 10.2%, 7.0% and 3.6%, respectively. Micro-CT analysis of the metaphyseal region of the excised tibia revealed that SPS caused a deterioration of trabecular architecture with trabecular number (Tb.N), BV/TV, connectivity density (Conn-Den) decreasing 12.0%, 18.9%, 23.3% and trabecular spacing (Tb.Sp), structure model index (SMI) increasing 13.9%, 21.8%, respectively. Mechanical loading increased the cross-sectional area in the mid-shaft region of the loaded right versus unloaded left tibia by 7.6% in the controls, and 10.0% in the stressed mice. Therefore, SPS applied to pre-pubertal young mice produced strong negative impact on both bone mass acquisition and trabecular architecture. Mechanical loading can be employed to increase bone size, a parameter related to bone strength, in normal as well as stressed conditions.
Introduction
Post-traumatic stress disorder (PTSD) is a severe anxiety disorder that can develop after exposure to life threatening events that evoke intense fear, helplessness and horror (for example, mortal peril, serious illness or natural disasters). Most people experiencing traumatic events eventually recover. However, a certain proportion of individuals, approximately 20–40%, develop PTSD symptoms that persist over a period of time (Kessler et al., Citation2005; Kuljic et al., Citation2004). Animal studies show that similar proportions of the animals exposed to traumatic stress develop PTSD-like symptoms (Cohen & Zohar, Citation2004; Cohen et al., Citation2006; Siegmund & Wotjak, Citation2007). PTSD can be a debilitating disorder, negatively affecting a person's mental and physical health, work and relationships. People with PTSD are at increased risk for developing other mental health and physical health problems.
PTSD can affect bone health. One mechanism for induction of stress-related bone dysfunction involves activation of the hypothalamic–pituitary–adrenal (HPA) axis, which is responsible for coordinating hormonal response to stress (Skelton et al., Citation2012). Alterations of the HPA axis are one of the most consistent neurobiological findings in PTSD (Mehta & Binder, Citation2012). Serum levels of stress hormones, such as glucocorticoids, are altered in patients with PTSD (Golier et al., Citation2007; Miller et al., Citation2007; Morris et al., Citation2012; Yehuda, Citation2002; Yehuda et al., Citation2005; Young & Breslau, Citation2004). The changes in glucocorticoid levels may predispose individuals to PTSD (Aardal-Eriksson et al., Citation2001; Faravelli et al., Citation2012). The activation of the HPA axis by traumatic stress can have profound effect on bone metabolism (Morris et al., Citation2004). In this regard, PTSD stressor-stimulated glucocorticoid responses many have adverse effects on bone metabolism (Canalis, Citation2005; Mazziotti et al., Citation2006). However, the specific regulation patterns of individual stress hormones in PTSD and their relative contribution to the overall negative effect on bone metabolism are not clear. For example, cortisol is known to reduce bone formation (Chyun et al., Citation1984; Pereira et al., Citation2001). Yet most people with PTSD show a low secretion of cortisol (Mason et al., Citation1988) except in the normative fight-or-flight response, in which cortisol levels are elevated after exposure to a stressor (Bohnen et al., Citation1991). The negative effect of acute stress on bone formation appears to be temporary in animal studies (Yu et al., Citation2012a). Therefore, the elevated corticosterone levels caused by acute stress (Chauveau et al., Citation2010) could in part contribute to the overall reduced bone mass. Modulation of non-adrenergic activities in the HPA axis could also lead to blunted response of growth hormone (Morris et al., Citation2004) and insulin-like growth factor 1 (IGF-1), both of which are well known contributors to peak bone mass (Mohan et al., Citation2003; Mohan & Baylink, Citation2005). Recently, we employed electric shocks with and without prior injection of an anxiogenic drug as the stressors in a mouse study, and documented direct evidence that traumatic stress had a negative effect on bone mass acquisition (Yu et al., Citation2012a).
PTSD can be studied with various animal models for traumatic stress. Among these, single prolonged stress (SPS) in rats (Liberzon et al., Citation1997, Citation1999) replicates some of the specific neuroendocrinological abnormalities observed in PTSD patients, such as enhanced glucocorticoid negative feedback (Yamamoto et al., Citation2009). In SPS, animals go through the following procedures in a single session: restraint for 2 hours, 20 min forced swimming at 24 °C thereafter, and following 15 min recuperation, exposure to diethyl ether vapor until they lose consciousness. Another version of SPS includes delivery of footshock (Wang et al., Citation2008, Citation2010).
Although we found in a previous study that traumatic stress had a negative effect on bone mass acquisition in young mice (Yu et al., Citation2012a), we and others have not examined other aspects of the impact of traumatic stress on postnatal bone development. Since SPS models consist of a combination of stressors, it is generally believed that they would produce a maximum stress with a stronger impact on the bone. In the current study, we applied a variant SPS model that included footshock in mice. Our objective was to evaluate the impact of traumatic stress not only on bone mass acquisition, but also on the size and density of cortical bone and parameters of trabecular architecture. In addition, we also intended to examine the expression of biochemical marker genes related to bone formation, and determine whether mechanical loading could mitigate the negative impact, if any, induced by traumatic stress.
Materials and methods
Animals
The experiment was carried out in 3-week-old female C57BL/6J mice. Young animals experience rapid growth, and were thus used to maximize our ability to determine the impact of traumatic stress on measures of bone health. Mice were purchased from the Jackson Laboratory (Bar Harbor, Maine), and shipped as pups with their mothers at 2 weeks of age, and weaned onsite at 3 weeks. There were a total of 22 mice, with 13 undergoing stress treatment, and 9 as controls. The experiment ended 5 weeks after the stress treatment (at 8 weeks of age). Euthanasia was carried out with 70% carbon dioxide inhalation, followed by decapitation. Trunk blood was collected at euthanasia, and centrifuged at 10 kg for 15 min at 4 °C. The serum was stored at −70 °C for IGF-1 assay. Both tibias were collected, fixed in 4 % formaldehyde for 48 h, and preserved in 1× phosphate buffered saline for micro-CT. The right femur was collected, and stored in liquid nitrogen for RNA isolation for real time RT-PCR.
All animals were housed at the Veterinary Medical Unit of the Jerry L. Pettis Memorial VA Medical Center under standard conditions of lighting (14 h light, 10 h darkness), ambient temperature (20 °C), and humidity (30–60%). All experimental protocols were in compliance with pertinent animal welfare regulations, and approved by the Institutional Animal Care and Use Committee of the Medical Center.
Stress treatment
Our modified SPS model included restraining for 2 hours, forced swimming for 20 min, and three electric shocks, which were carried out in sequence within a 3 h period. We omitted the ether exposure step that is common in SPS models due to safety concerns regarding the use of diethyl ether vapor. There were no restraining, no forced swimming, and no footshock for control mice (although control mice were exposed to the shock apparatus to control for novel chamber placement). After the stress treatment, all mice were left untouched for a week. To enforce the stress effect, we also introduced singly housing after the stress treatment for the SPS mice only (social isolation). All control mice were housed three animals per cage after the mock shock procedure.
The restraining was achieved in 50 ml plastic test tubes containing several holes for ventilation. Each mouse was introduced into the tube with the head facing the bottom. Sponge foam was inserted to prevent it from turning around or backing up inside the tube. The tubes were laid horizontally inside their cages for 2 h. Following restraining, the mice were immediately placed for forced swimming in plastic cages (11 in. long, 7 in. wide and 5 in. high) filled to a height of 3 in. with warm water, which was maintained at 24 °C in a water bath. Each animal was forced to swim for 20 min. During this period, if it was at risk of drowning, it was rescued and placed in water again. After the forced swimming, the mice were dried using a paper towel, and returned to their cages, which were on heating pads, to recuperate for 20–30 min. Then, they were placed in a Freeze Monitor (San Diego Instruments, San Diego, CA) for electric shocks. Three foot shocks spaced 1 min apart with an intensity of 3 mA and duration of 3 sec were delivered in a 6 min session as described previously (Yu et al., Citation2012a).
In vivo tests and measurements
Freezing behavior was determined in the freeze monitor by three 10 s tests in a 6 min session. The three freeze tests were associated with the three electric shocks in the stress treatment through co-termination with acoustic cue presentations. The weekly freeze tests started at the end of the incubation period. The detailed method of the tests was described previously (Yu et al., Citation2012a). This test has been validated with correlation coefficients (r) between computer measures and hand scoring ranging from 0.87 for latency 1 to 0.94 for latency 3 (Valentinuzzi et al., Citation1998). We chose latency 3 since it had the highest correlation with hand scoring. The average percentage of latency 3 in the three 10 s test bins co-terminating with sound presentation was used as the freezing time. Bone mass measurements were taken on live mice using a PIXImus densitometer (LUNAR Corp., Madison, WI) based on dual-energy X-ray absorptiometry (DXA) densitometry (Masinde et al., Citation2002). The mice were anesthetized by inhalation of isoflurane before and during the procedure. The weekly DXA measurements started two weeks after the stress treatment.
Mechanical loading
Mechanical loading was carried out in the form of four-point bending on the Instron testing device (Instron, Canton, MA). Four-point bending, designed to stimulate cortical bone formation, was applied to the mid-diaphyseal region of the tibia. Loading started 3 weeks after the stress treatment. All mice, stressed and control, were loaded 5 days/week for 2 weeks. Then, the mice were subjected to one last loading and sacrificed on the same day. We only loaded the right tibia while the left tibia was used as the internal control for unloaded bone. The loading protocol consisted of a 9 N load at a frequency of 2 Hz for 36 cycles. The detailed description of the loading regimen was previously described (Kesavan et al., Citation2005; Kesavan & Mohan, Citation2010). Mechanical loading itself should not induce stress as the mice were under isoflurane anesthesia during the procedure.
Micro-CT analyses
Two types of micro-CT analysis of the excised tibias were carried out on the “vivaCT 40” microCT system (Scanco Medical, Bassersdorf, Switzerland). In the cortical analysis, we analyzed 50 slices with the thickness of 10.5 µm at the mid-diaphyseal region of both unloaded left and loaded right tibia as previously described (Yu et al., Citation2012b). In the trabecular analysis, we analyzed the same number of slices that were 15 slices (157.5 µm) below the growth plate in the proximal metaphyseal region of the left tibia. The proximal growth plate was identified by a cross-section at the distal end that contained an apparent bridge-shaped thickening cartilage tissue in the X-ray image. Other micro-CT parameters were described previously (Yu et al., Citation2012b).
Real time RT-PCR
The frozen right femur was ground in liquid nitrogen in a mortar and pestle, and RNA was extracted using Trizol (Invitrogen, Carlsbad, CA). Total RNA was further purified by RNeasy columns (Qiagen, Valencia, CA) and quantified by Nanodrop (Agilent, Santa Clara, CA). An aliquot of 2 µg RNA was reverse-transcribed into cDNA in a 20 µl reaction solution by oligo(dT)12–18 primer. Real-time RT-PCR contained 5 µl template cDNA, 1x SYBR GREEN master mix (Qiagen, Valencia, CA), and 100 nM of specific forward and reverse primers in a 20 µl reaction solution. Alkaline phosphatase (ALP), insulin-like growth factor 1 (IGF-1, isoform 1, 2 and 3) and one of the two osteocalcin isoforms (Desbois et al., Citation1994) osteocalcin-2 (OC) were analyzed with the peptidylprolyl isomerase A (PPIA) used as the internal reference. Delta CT from the internal reference was calculated for each gene. The differences in delta CT between the stressed mice and the controls was calculated as fold change, which was then converted to percentages of the controls in the final results. Primer sequences for all genes are listed in .
Table 1. Primers used in real time RT-PCR.
Serum IGF-1 assay
IGF-1 levels in the serum were measured by radioimmunoassay (RIA) using our in-house assay, which was validated with a correlation coefficient (r) of 0.9 with the established gold standard method (Mohan & Baylink, Citation1995). We used rabbit polyclonal antiserum and recombinant IGF-I (provided by the National Hormone and Pituitary Program, Torrance, CA) as standard and tracer, respectively. IGF binding proteins were removed from the serum by acid gel filtration protocol prior to RIA. The inter- and intra-assay coefficient of variation was less than 10%.
Statistical analyses
Statistical analyses were performed using the Statistica software (StatSoft, Inc., Tulsa, OK). For bone mineral content (BMC), bone area (B area) and bone mineral density (BMD) from DXA, t-test was first performed with raw parameter values. With the exception of BMD at lumbar vertebrae, there were no significant differences between the stressed mice and the controls at all bone sites for week 4 and 5 in all three parameters. Therefore, week 4 and 5 were excluded from further analysis. Then, percentage reductions from the control mean were calculated at each bone site for each time point. The percentage values were used in two-way factorial ANOVA (stress treatment × time points). Fisher’s LSD was used to compare the percentage differences between the stressed and control mice, and between weeks 2 and 3.
Results
Freezing behavior
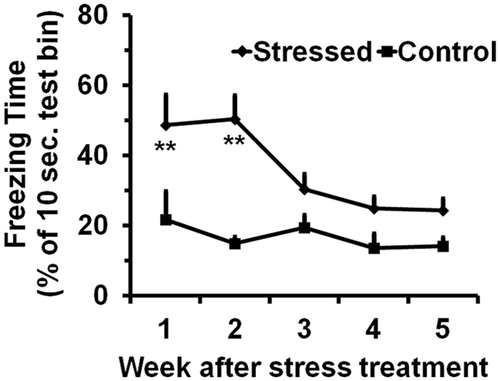
Two-way ANOVA indicated significance for both stress treatment and time points in the freezing behavior (stress treatment: F[1,123] = 15.7, p < 0.01; time points: F[4,123] = 3.4, p < 0.01). Out of the 10-sec test periods, the control mice froze 1.4 to 2.2 s with an average of 1.7 s, which were relatively constant throughout the experiment (). The stressed mice, on the other hand, froze longer, 4.9 and 5.0 s for the first two weeks, which were significantly different from the control values.
Figure 1. Effect of the SPS treatment on freezing behavior. Values are means and SEM of the freezing time (% of 10 sec test bin). The significance (**p < 0.01) of the stress treatment compared to the controls based on Fisher’s LSD test is indicated below each time point.
Bone mass acquisition
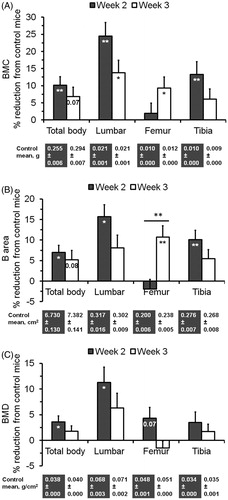
Two-way ANOVA using the percentage values indicated that a significant effect of stress on DXA based bone mass parameters at most bone sites. For example, F[1,40] = 10.8, p < 0.01 for BMC, F[1,40] = 8.7, p < 0.01 for B area, and F[1,40] = 5.2, p < 0.05 for BMD in total body. However, there was no significant effect of time except for B area in the femur. Two weeks after the stress treatment, BMC, B area and BMD in total body were reduced by 10.2% (p < 0.01) (), 7.0% (p < 0.05) () and 3.6% (p < 0.05) (), respectively. Even higher reductions were observed in lumbar vertebrae with 24.5% (p < 0.01) for BMC, 15.7% (p < 0.05) for B area, and 11.2% for BMD (p < 0.05). Significant (p <= 0.05) or near significant (p <= 0.08) reductions of BMC and B area were also observed in total body and lumbar vertebrae at week 3, and in femur and tibia at either week 2 or 3.
Figure 2. Effect of the SPS treatment on bone mass acquisition in total body as well as specific bones. Values are means and SEM of percentage reductions from the control means, which are shown below the graph. (A) Bone mineral content (BMC). (B) Bone area (B area). (C) Bone mineral density (BMD). The significance (p value, *p < 0.05, or **p < 0.01) of the stress treatment compared to the controls in each bone at each time point based on Fisher’s LSD test is indicated inside the corresponding bar. The significance between two time points is indicated above the corresponding bars.
Cortical structure
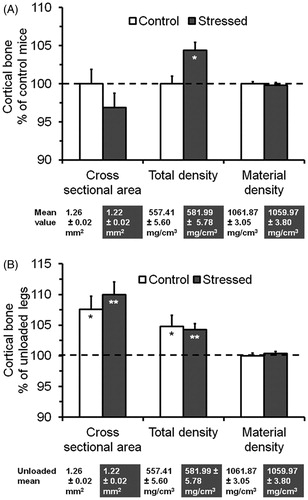
Cross-sectional area at the mid-diaphysis of the unloaded left tibia was reduced by 3.2% in the stressed mice, which was not significant (). Surprisingly, there was a 4.4% increase (p < 0.05) in total density for the stressed mice. However, there was no significant difference in material density between the stressed and control mice.
Figure 3. Effect of the SPS treatment and mechanical loading on cortical structure at the mid-diaphysis of the tibia. Values are means and SEM of percentage changes from the control means or the unloaded means, which are below the graph. (A) Effect of the SPS treatment as measured on the unloaded left tibia. (B) Effect of mechanical loading by comparing the loaded right versus unloaded left tibia. The significance (*p < 0.05 or **p < 0.01) of the stressed mice compared to the controls or the loaded right compared to the unloaded left tibia based on t-test is indicated inside the corresponding bar for each parameter. The cross sectional area, total density and material density were calculated or obtained from VOX-TV, Mean1 and Mean2 of the micro-CT data, respectively.
Trabecular architecture
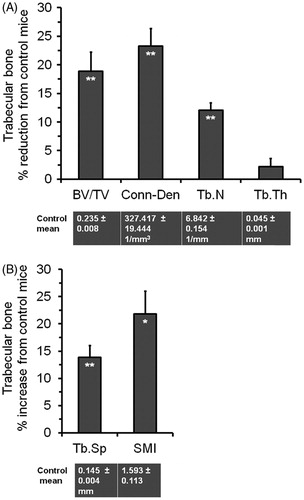
BV/TV at the proximal metaphysis of the left tibia was decreased by 18.9% (p < 0.01) in the stressed mice compared to the controls (), which could be attributed to a 12.0% reduction (p < 0.01) in trabecular number (Tb.N) and a 13.9% increase (p < 0.01) in trabecular spacing (Tb.S) (). Similarly, connectivity density (Conn-Den) was reduced by 23.3% (p < 0.01), while structural model index (SMI) was increased by 21.8% (p < 0.05). However, there was no change in trabecular thickness (Tb.Th) between the two groups.
Figure 4. Effect of the SPS treatment on trabecular architecture at the metaphysis of the unloaded left tibia. Values are means and SEM of percentage reductions from the control means, which are shown below the graph. (A) Trabecular parameters with decreasing values. (B) Trabecular parameters with increasing values. The significance (*p < 0.05, or **p < 0.01) of the stress treatment compared to the controls based on t-test is indicated within the corresponding bar for each parameter.
Expression of bone formation related markers
Real time RT-PCR showed that IGF-1 was up-regulated 25.4% (i.e. 1.25-fold) in the right femur for the stressed versus control mice at the end of the experiment. However, this difference was not significant. Likewise, there were no significant difference between the stressed and control mice in the femoral expression of ALP and OC. Serum IGF-1 levels did not differ by group.
Mechanical loading of cortical bone
Comparison of the loaded right to unloaded left tibia in the control mice indicates that four-point bending in the diaphyseal region increased cross-sectional area and total density by 7.6% and 4.8% (both ps < 0.05), respectively (). Similar changes with a 10.0% increase in cross-sectional area and a 4.3% increase in total density (both ps < 0.01) were also seen in the stressed mice. However, there were no loading-induced changes in material density for both the stressed and control mice.
Discussion
SPS was initially developed for rats (Liberzon et al., Citation1997, Citation1999). This is the first study to apply this model to mice. In a behavioral test, we found that the stressed mice had increased freezing behavior compared to the control mice, significant for the first two weeks. The freezing behavior was a measure of the contextual fear memory for electric shocks, a component of the SPS treatment. Impaired contextual fear memory is associated with PTSD symptoms. However, the freezing response was not as strong as in a previous study, where we used footshock with or without prior injection of the anxiogenic drug FG-7142 (Yu et al., Citation2012a). In that study, we found that the significantly increased freezing behavior lasted as long as 7 weeks. The reduced freezing response indicates that SPS is different from footshock alone. SPS has restraint and forced swimming as additional components. Like other traumatic events, these procedures may result in reduced ability to encode the traumatic experience specifically associated with footshock into memory (Bryant, Citation2011). This may explain the reduced freezing behavior in this study.
Based on the DXA data and consistent with our previous findings using footshock (Yu et al., Citation2012a), SPS significantly reduced bone mass acquisition two and three weeks after the treatment. The reduction varied in different bones at different time points, with the greatest impact on lumbar vertebrae and the impact at two weeks greater than at three weeks. As in the footshock model, these impacts disappeared after three weeks, as the animals had recovered from the stress treatment.
Micro-CT analysis of the metaphyseal region of the left tibia showed that SPS had major impact on trabecular architecture. It reduced trabecular number and increased trabecular spacing, which caused decreased BV/TV and connectivity density. Connectivity of the trabecular bone increases bone strength (Odgaard & Gundersen, Citation1993), and the decreased connectivity density indicates impaired trabecular functions. In addition, SPS also caused an increase in SMI. SMI is the relative proportion of plate-like versus rod-like trabeculae (Ryan & Shaw, Citation2012), a key measure of trabeculae quality in terms of absorbing loads (Hildebrand & Ruegsegger, Citation1997). Increased SMI is associated with the reduced quality of trabecular bone. Consistent with our results, a clinical study using iliac crest bone biopsies from Gulf War veterans with many having traumatic experience showed a decreased trabecular bone volume compared to the age matched controls (Compston et al., Citation2002; Freemont, Citation2002). An evaluation of Vietnam-era male repatriated prisoners also revealed that repatriates with a lifetime history of PTSD had a significantly lower BMD at the hip relative to both repatriates without a life long history of PTSD and the control group of normal subjects (Hain et al., Citation2011).
Since we only used 3-week-old pre-pubertal young mice, which experience rapid growth propelled by changes of sex hormones, the observed effect on bone mass acquisition may have been associated with the imposition of major stressors at an age of rapid skeletal growth. We have previously reported that while femur BMC only increased 25% between 8 and 13 weeks of age, it nearly doubled between 3 and 4 weeks (Mohan et al., Citation2003), making this period ideal for detecting any changes in bone mass acquisition. Indeed, our recent experiment using 14-week-old mice did not show any differences in bone mass parameters between stressed and control mice. However, whether the observed effect on trabecular architecture is age-specific or not remains to be evaluated in future studies.
Since bone mass acquisition was reduced in the stressed mice 2 and 3 weeks after the introduction of traumatic stress, we anticipated a similar decrease in expression of bone formation genes. However, there were no significant differences between the stressed and control mice in the expression of related marker genes. One potential explanation may be related to the time and site of sampling. All samples were collected five weeks after the SPS treatment. Any biochemical changes that may have occurred early would have been missed. In addition, we used the whole right femur in real time RT-PCR. There may have been differences in expression in the trabecular part, but not at the whole bone level. Further studies are needed to evaluate these possibilities.
Micro-CT analysis of the mid-diaphyseal region of the unloaded left tibia showed that there was some decrease in cortical bone size as expressed in the cross-sectional area for the stressed mice. On the other hand, comparison of the loaded right to unloaded left tibia showed that four-point bending increased cortical bone size in both the stressed and control mice. There were no significant differences in material density between the two groups of mice in either the left or right tibia, suggesting that both the stress treatment and subsequent mechanical loading had no effect on this cortical density measure. Thus, it can be inferred that four-point bending is a good model of mechanical loading mainly through increasing and maintaining bone size. Since bone size is an important parameter of bone strength, and along with density, contributes to 40% of the bone strength variation (Wergedal et al., Citation2005), our results suggest that cortical mechanical loading is important for maintaining bone strength in healthy individuals as well as for reversing possible bone strength weakening in stressed individuals.
In conclusion, a behavioral test showed that our variant SPS model applied to pre-pubertal mice produced a contextual fear memory that is reminiscent of PTSD symptoms. SPS also caused significant reductions of bone mass acquisition shortly after the treatment. The negative impact of SPS on bone quality was evident from changes in trabecular architecture. Mechanical loading increased cortical bone size in both the stressed and control mice, implying that physical activity may be beneficial for maintaining bone strength as well as reversing bone weakening associated with PTSD.
Declaration of interest
The authors report no conflicts of interest. The authors alone are responsible for the content and writing of the paper. This work was funded through the Merit Review Program of the Department of Veterans Affairs, and was performed at research facilities provided by the Jerry L. Pettis Memorial VA Medical Center.
Acknowledgements
The authors wish to thank Catrina M. Alarcon and Joe Rung-Aroon for their technical assistance.
References
- Aardal-Eriksson E, Eriksson TE, Thorell LH. (2001). Salivary cortisol, posttraumatic stress symptoms, and general health in the acute phase and during 9-month follow-up. Biol Psychiatry 50(12):986–93
- Bohnen N, Nicolson N, Sulon J, Jolles J. (1991). Coping style, trait anxiety and cortisol reactivity during mental stress. J Psychosom Res 35:141–7
- Bryant R. (2011). Post-traumatic stress disorder vs traumatic brain injury. Dialogues Clin Neurosci 13(3):251–62
- Canalis E. (2005). Mechanisms of glucocorticoid action in bone. Curr Osteoporos Rep 3(3):98–102
- Chauveau F, Tronche C, Pierard C, Liscia P, Drouet I, Coutan M, Beracochea D. (2010). Rapid stress-induced corticosterone rise in the hippocampus reverses serial memory retrieval pattern. Hippocampus 20:196–207
- Chyun YS, Kream BE, Raisz LG. (1984). Cortisol decreases bone formation by inhibiting periosteal cell proliferation. Endocrinology 114:477–80
- Cohen H, Zohar J. (2004). An animal model of posttraumatic stress disorder: the use of cut-off behavioral criteria. Ann N Y Acad Sci 1032:167–78
- Cohen H, Matar MA, Richter-Levin G, Zohar J. (2006). The contribution of an animal model toward uncovering biological risk factors for PTSD. Ann N Y Acad Sci 1071:335–50
- Compston JE, Vedi S, Stephen AB, Bord S, Lyons AR, Hodges SJ, Scammell BE. (2002). Reduced bone formation in UK Gulf War veterans: a bone histomorphometric study. J Clin Pathol 55(12):897–9
- Desbois C, Hogue DA, Karsenty G. (1994). The mouse osteocalcin gene cluster contains three genes with two separate spatial and temporal patterns of expression. J Biol Chem 269:1183–90
- Faravelli C, Lo Sauro C, Lelli L, Pietrini F, Lazzeretti L, Godini L, Benni L, et al. (2012). The role of life events and HPA axis in anxiety disorders: a review. Curr Pharm Des 18(35):5663--74
- Freemont AJ. (2002). Bone and the Gulf War. J Clin Pathol 55(12):884
- Golier JA, Schmeidler J, Legge J, Yehuda R. (2007). Twenty-four hour plasma cortisol and adrenocorticotropic hormone in Gulf War veterans: relationships to posttraumatic stress disorder and health symptoms. Biol Psychiatry 62(10):1175–8
- Hain RE, Hoyt RE, Moore JL, Linnville S, Segovia F, Ambrose MR. (2011). Potential association of posttraumatic stress disorder and decreased bone mineral density in repatriated prisoners of war. Mil Med 176(3):270–5
- Hildebrand T, Ruegsegger P. (1997). Quantification of Bone Microarchitecture with the Structure Model Index. Comput Methods Biomech Biomed Engin 1(1):15–23
- Kesavan C, Mohan S, Oberholtzer S, Wergedal JE, Baylink DJ. (2005). Mechanical loading-induced gene expression and BMD changes are different in two inbred mouse strains. J Appl Physiol 99(5):1951–7
- Kesavan C, Mohan S. (2010). Bone mass gained in response to external loading is preserved for several weeks following cessation of loading in 10 week C57BL/6J mice. J Musculoskelet Neuronal Interact 10(4):274–80
- Kessler RC, Berglund P, Demler O, Jin R, Merikangas KR, Walters EE. (2005). Lifetime prevalence and age-of-onset distributions of DSM-IV disorders in the National Comorbidity Survey Replication. Arch Gen Psychiatry 62(6):593–602
- Kuljic B, Miljanovic B, Svicevic R. (2004). [Posttraumatic stress disorder in Bosnian war veterans: analysis of stress events and risk factors]. Vojnosanit Pregl 61(3):283–9
- Liberzon I, Krstov M, Young EA. (1997). Stress-restress: effects on ACTH and fast feedback. Psychoneuroendocrinology 22(6):443–53
- Liberzon I, Lopez JF, Flagel SB, Vazquez DM, Young EA. (1999). Differential regulation of hippocampal glucocorticoid receptors mRNA and fast feedback: relevance to post-traumatic stress disorder. J Neuroendocrinol 11(1):11–17
- Masinde GL, Li X, Gu W, Wergedal J, Mohan S, Baylink DJ. (2002). Quantitative trait loci for bone density in mice: the genes determining total skeletal density and femur density show little overlap in F2 mice. Calcif Tissue Int 71(5):421–8
- Mason JW, Giller EL, Kosten TR, Harkness L. (1988). Elevation of urinary norepinephrine/cortisol ratio in posttraumatic stress disorder. J Nerv Ment Dis 176:498–502
- Mazziotti G, Angeli A, Bilezikian JP, Canalis E, Giustina A. (2006). Glucocorticoid-induced osteoporosis: an update. Trends Endocrinol Metab 17(4):144–9
- Mehta D, Binder EB. (2012). Gene x environment vulnerability factors for PTSD: the HPA-axis. Neuropharmacology 62(2):654–62
- Miller GE, Chen E, Zhou ES. (2007). If it goes up, must it come down? Chronic stress and the hypothalamic-pituitary-adrenocortical axis in humans. Psychol Bull 133(1):25–45
- Mohan S, Baylink DJ. (1995). Development of a simple valid method for the complete removal of insulin-like growth factor (IGF)-binding proteins from IGFs in human serum and other biological fluids: comparison with acid-ethanol treatment and C18 Sep-Pak separation. J Clin Endocrinol Metab 80(2):637–47
- Mohan S, Baylink DJ. (2005). Impaired skeletal growth in mice with haploinsufficiency of IGF-I: genetic evidence that differences in IGF-I expression could contribute to peak bone mineral density differences. J Endocrinol 185(3):415–20
- Mohan S, Richman C, Guo R, Amaar Y, Donahue LR, Wergedal J, Baylink DJ. (2003). Insulin-like growth factor regulates peak bone mineral density in mice by both growth hormone-dependent and -independent mechanisms. Endocrinology 144(3):929–36
- Morris MC, Compas BE, Garber J. (2012). Relations among posttraumatic stress disorder, comorbid major depression, and HPA function: a systematic review and meta-analysis. Clin Psychol Rev 32(4):301–15
- Morris P, Hopwood M, Maguire K, Norman T, Schweitzer I. (2004). Blunted growth hormone response to clonidine in post-traumatic stress disorder. Psychoneuroendocrinology 29(2):269–78
- Odgaard A, Gundersen HJ. (1993). Quantification of connectivity in cancellous bone, with special emphasis on 3-D reconstructions. Bone 14(2):173–82
- Pereira RM, Delany AM, Canalis E. (2001). Cortisol inhibits the differentiation and apoptosis of osteoblasts in culture. Bone 28:484–490
- Ryan TM, Shaw CN. (2012). Unique suites of trabecular bone features characterize locomotor behavior in human and non-human anthropoid primates. PLoS One 7(7):e41037
- Siegmund A, Wotjak CT. (2007). A mouse model of posttraumatic stress disorder that distinguishes between conditioned and sensitised fear. J Psychiatr Res 41(10):848–60
- Skelton K, Ressler KJ, Norrholm SD, Jovanovic T, Bradley-Davino B. (2012). PTSD and gene variants: new pathways and new thinking. Neuropharmacology 62(2):628–37
- Valentinuzzi VS, Kolker DE, Vitaterna MH, Shimomura K, Whiteley A, Low-Zeddies S, Turek FW, et al. (1998). Automated measurement of mouse freezing behavior and its use for quantitative trait locus analysis of contextual fear conditioning in (BALB/cJ x C57BL/6J)F2 mice. Learn Mem 5:391–403
- Wang HN, Peng Y, Tan QR, Chen YC, Zhang RG, Qiao YT, Wang HH, et al. (2010). Quetiapine ameliorates anxiety-like behavior and cognitive impairments in stressed rats: implications for the treatment of posttraumatic stress disorder. Physiol Res 59(2):263–71
- Wang W, Liu Y, Zheng H, Wang HN, Jin X, Chen YC, Zheng LN, et al. (2008). A modified single-prolonged stress model for post-traumatic stress disorder. Neurosci Lett 441(2):237–41
- Wergedal JE, Sheng MH, Ackert-Bicknell CL, Beamer WG, Baylink DJ. (2005). Genetic variation in femur extrinsic strength in 29 different inbred strains of mice is dependent on variations in femur cross-sectional geometry and bone density. Bone 36(1):111–22
- Yamamoto S, Morinobu S, Takei S, Fuchikami M, Matsuki A, Yamawaki S, Liberzon I. (2009). Single prolonged stress: toward an animal model of posttraumatic stress disorder. Depress Anxiety 26(12):1110–17
- Yehuda R. (2002). Post-traumatic stress disorder. N Engl J Med 346(2):108–14
- Yehuda R, Engel SM, Brand SR, Seckl J, Marcus SM, Berkowitz GS. (2005). Transgenerational effects of posttraumatic stress disorder in babies of mothers exposed to the World Trade Center attacks during pregnancy. J Clin Endocrinol Metab 90(7):4115–18
- Young EA, Breslau N. (2004). Cortisol and catecholamines in posttraumatic stress disorder: an epidemiologic community study. Arch Gen Psychiatry 61(4):394–401
- Yu H, Watt H, Kesavan C, Johnson PJ, Wergedal JE, Mohan S. (2012a). Lasting consequences of traumatic events on behavioral and skeletal parameters in a mouse model for post-traumatic stress disorder (PTSD). PLoS One 7(8):e42684
- Yu H, Wergedal JE, Zhao Y, Mohan S. (2012b). Targeted disruption of TGFBI in mice reveals its role in regulating bone mass and bone size through periosteal bone formation. Calcif Tissue Int 91(1):81–7