
Abstract
We have previously reported that in response to early life stress, such as maternal hyperthyroidism and maternal separation (MS), the rat hypothalamic vasopressinergic system becomes up-regulated, showing enlarged nuclear volume and cell number, with stress hyperresponsivity and high anxiety during adulthood. The detailed signaling pathways involving cell death/survival, modified by adverse experiences in this developmental window remains unknown. Here, we report the effects of MS on cellular density and time-dependent fluctuations of the expression of pro- and anti-apoptotic factors during the development of the hypothalamus. Neonatal male rats were exposed to 3 h-daily MS from postnatal days 2 to 15 (PND 2–15). Cellular density was assessed in the hypothalamus at PND 21 using methylene blue staining, and neuronal nuclear specific protein and glial fibrillary acidic protein immunostaining at PND 36. Expression of factors related to apoptosis and cell survival in the hypothalamus was examined at PND 1, 3, 6, 9, 12, 15, 20 and 43 by Western blot. Rats subjected to MS exhibited greater cell-density and increased neuronal density in all hypothalamic regions assessed. The time course of protein expression in the postnatal brain showed: (1) decreased expression of active caspase 3; (2) increased Bcl-2/Bax ratio; (3) increased activation of ERK1/2, Akt and inactivation of Bad; PND 15 and PND 20 were the most prominent time-points. These data indicate that MS can induce hypothalamic structural reorganization by promoting survival, suppressing cell death pathways, increasing cellular density which may alter the contribution of these modified regions to homeostasis.
Introduction
Major developmental processes occur postnatally in the brain. Deletion of cells, through a natural highly regulated process of programmed cell death (PCD, particularly apoptosis), has been found to be crucial for the regulation of neural population size and the establishment of appropriate neural networks (Buss et al., Citation2006; Clarke, Citation1985; Oppenheim, Citation1991). The highest levels of PCD occur during the first postnatal weeks in rat brain regions such as the brainstem, neocortex and hippocampus (White & Barone, Citation2001), as well as in mouse hypothalamus (Ahern et al., Citation2013). Therefore, experiences occurring throughout this critical developmental window may produce enduring effects, which can impact on behavior in adult life.
We have previously reported that in response to early life stress, such as maternal hyperthyroidism (Zhang et al., Citation2008, Citation2010) and neonatal maternal separation (MS) (Hernandez et al., Citation2012; Zhang et al., Citation2012), the rat hypothalamic vasopressin system becomes up-regulated, showing enlarged volume of the hypothalamic paraventricular and supraoptic vasopressin nuclei and increased cell number, with an increased sensitivity to acute stressors or anxiogenic conditions in adulthood. However, the detailed signaling pathways involving cell death/survival, modified by the adverse experience in this developmental window remain unknown.
MS is a well-validated rodent model used to assess the effect of early postnatal stress on cognition and emotionality in adulthood (Meaney et al., Citation1985; Plotsky & Meaney, Citation1993; Veenema, Citation2009; Zhang et al., Citation2012). It is well established that the neonatal stage is particularly susceptible to MS, during which neuroendocrine responses (Ladd et al., Citation2000; Levine, Citation1994; Plotsky & Meaney, Citation1993), neurotrophin levels (Cirulli et al., Citation2003) and epigenetic patterns (Murgatroyd et al., Citation2009) of the animal undergo modifications. Because the peak of PCD in normal brain development occurs during the early postnatal period (Oppenheim, Citation1991; White & Barone, Citation2001), it seemed important to evaluate the expression of pro- and anti-apoptotic proteins and their ratios as a consequence of MS.
The protein caspase 3 (cysteinyl aspartic protease) is responsible for the irreversible proteolysis of cellular components and is thus considered a key enzyme in both the intrinsic (mitochondrial) and extrinsic pathways, leading to apoptosis during brain development (Hengartner, Citation2000; Kuida et al., Citation1996; Porter & Janicke, Citation1999). The anti-apoptotic Bcl-2 protein (B cell lymphoma 2, a group-II mitochondria mediated cell death suppressor) protects the integrity of the mitochondrial membrane inhibiting apoptosis while pro-apoptotic Bax (Bcl-2 associated X protein, a group-I tumor necrosis factor family mediated cell death effector) is responsible for the release of cytochrome c from the mitochondria, causing caspase activation. Thus, the Bcl-2/Bax ratio is an apoptosis indicator (Oltvai et al., Citation1993). In contrast, the protein kinases ERK1/2 (extracellular signal-regulated kinases 1 and 2) and Akt (protein kinase identified in the AKT virus or protein kinase B) are implicated in pathways leading to neuronal survival/proliferation (Brunet et al., Citation2001; Davies, Citation2003; Hetman & Gozdz, Citation2004; Oppenheim et al., Citation2010) and neurogenesis (Faedo et al., Citation2008). Bad (Bcl-2-associated death promoter protein, group-III endoplasmic reticulum mediated cell death effector) is a pro-apoptotic protein since it disrupts mitochondrial membrane integrity. However, serine phosphorylation by ERK1/2 and Akt inactivates Bad, and consequently phosphorylated Bad has an anti-apoptotic effect (Bonni et al., Citation1999; Fang et al., 1999; Zha et al., Citation1996).
In the present study, we hypothesized that MS, as an adverse stressor for the neonatal pups, up-regulates hypothalamic activity during an early postnatal window, leading to abnormal cell survival, as a result of the premature activation of the stress coping mechanisms. As a first step to test our hypothesis, we designed the following strategy: (1) to determine the effects of MS on the rat hypothalamic cell-density and (2) to find out whether this stress can modify certain pro- and anti-apoptotic protein expression during the development of the postnatal hypothalamus and in young adults.
Methods
Animals
All animal procedures were approved by the local bioethical and research committees, with approval ID CIEFM-085-2013, in accordance with the “Principles of laboratory animal care” detailed in the National Institute of Health Guide for the Care and Use of Laboratory Animals (NIH Publications No. 80-23) revised 1996. Wistar male rats from 24 litters (12 for MS and 12 for animal facility reared rats, AFR, groups) were used in this study. The rats were provided by the local animal facility. Rats were maintained on a 12:12 light–dark cycle (light-on at 07:00 h), in a room with controlled temperature (20–24 °C) and adequate ventilation and given access to standard rat chow and water ad libitum.
MS procedure
MS was performed as described previously (Veenema et al., Citation2006; Zhang et al., Citation2012). Briefly, to establish pregnancy adult female and male rats were caged together for 2 d and these dates were assigned as “gestation-day” (±1 d). Females were then caged in groups of 3 until gestational day 17 when they started to be single-housed in standard rat Plexiglas cages and maintained under standard laboratory conditions as above. On the day after parturition, PND 2, each litter was culled to 8 pups, of which 5–6 were male. During PND 2 to PND 15, pups were separated daily between 09:00 and 12:00 h from their mothers. Pups were removed from the home cage of each litter by the experimenter whose hands were coated by fine bedding-material corresponding to each cage before transfer. The litter was moved to an adjacent room and placed individually into small boxes filled with bedding, and then put into a humid incubator with temperature maintained at 29 ± 1 °C. After the 3 h-separation period, the pups were returned to the home-cage followed by reunion with their respective mother. Non-separated litters (AFR) were left undisturbed, except for changing the bedding material twice a week, and served as control groups for this study. Pups were weaned from their mother on PND 21 and then housed in standard rat Plexiglas cages and maintained under standard laboratory conditions. Pups were weighed daily from PND 2 to PND 15.
Tissue processing for cell density assessment
Brains for methylene blue staining were taken from rats perfused-fixed on PND 21 (n = 3), and for neuronal specific nuclear protein (NeuN) immuno-labeled cell quantification brains were from rats perfused-fixed on PND 36 (n = 3). Briefly, male rats were deeply anesthetized with sodium pentobarbital (63 mg/kg, b.w., i.p. injection, Sedalpharma, Mexico City, Mexico) and perfused via the ascending aorta using gravity-fed system, first with 0.9% saline till the liquid from the scissor-opened right atrium getting clear and the liver becoming pale (about 10 ml, 2 min) and followed by ice-cold fixative containing 4% paraformaldehyde (Sigma-Aldrich, St Louis, MO) in 0.1 M sodium phosphate buffer (PB, pH 7.4) plus 15% v/v of saturated picric acid for 15 min (about 150 ml of fixative for young rats).
Histological procedures for total cell-density assessment using methylene blue
Whole brains were removed, cryoprotected (sucrose solution in PB, 10% for 10 min and 20% for more than 4 h) and coronally cryosectioned (12 µm thickness). One out of every six free-floating sections containing hypothalamus were mounted on gelatine-treated glass slides and stained with methylene blue for histological examination. Methylene blue stained nuclei in the arcuate hypothalamic nucleus (Arc), paraventricular nucleus, medial parvocellular division (PVNmpd), anterior hypothalamic area (AHA), medial preoptic nucleus compact (MPOc), medial preoptic nucleus medial (MPOm) and suprachiasmatic nucleus, dorsolateral division (SChDL) were counted. We selected these hypothalamic nuclei because of their proposed relationship with stress coping (Simerly, Citation1995).
Immunohistochemical procedures for NeuN- and GFAP-expressing cell density assessment
Antibodies
The monoclonal antibodies against neuronal nuclei (NeuN, Chemicon Millipore, Temecula, CA; Cat. No. MAB377, 1 mg/ml stock solution) and against glial fibrillary acidic protein (GFAP, Biocare Medical, Concord, CA, Control Number: 901-065-021513) were raised in mouse, and characterized previously (Estrada et al., Citation2009, Citation2012; McLendon & Bigner, Citation1994, respectively). Biotinylated donkey-anti-mouse antibody was used as second antibody (715-066-150, Jackson ImmunoResearch Laboratories Inc., Pennsylvania, PA, 1:500).
Immunohistochemical procedures
Whole brains were removed and thoroughly rinsed with PB. Vibratome-cut free-floating 50 µm coronal sections containing hypothalamus (spanning from Bregma −0.24 mm to −2.64 mm, Paxinos & Watson, Citation2009) were obtained. One in every six sections was then immersed in Trizma buffer (pH 7.4 at 25 °C), 0.9% NaCl and Triton X-100 0.3% (TBST). To block unspecific labeling, sections were first incubated in TBST plus 10% normal donkey serum (NDS, Jackson Immunoresearch, West Grove, PA) for 1 h at room temperature. Then, sections were incubated with mouse anti-GFAP (1:1000) or mouse anti-NeuN (1:1000) in TBST + 1% NDS at 4 °C over night. After rinsing, sections were incubated with biotinylated donkey-anti-mouse antibody (1:1000) in TBST + 1% NDS over night. After rinsing several times with TBST, sections were then incubated in avidin–biotin–peroxidase complex (Elite ABC kit PK-6100, Vector Laboratories, Peterborough, UK) for 1 h at room temperature. Peroxidase was detected using 3,3′-diaminobenzidine (0.05%, Electron Microscopy Sciences, Hatfield, PA) as a chromogen and hydrogen peroxide (0.01% v/v) as a substrate. Sections were mounted on gelatin-coated slides and allowed to dry for a day, at room temperature. Then they were further dehydrated by soaking in ethanol 100% for 5 min and rinsing with xylene and mounted with Permount mounting medium (Thermo Fischer Scientific, Waltham, MA).
Western blot
Antibody specifications
The following rabbit antibodies were obtained from Cell Signaling Technology (Danvers, MA): cleaved (active) caspase 3 antibody (Asp175, #9661, 1:1000) recognizes the large fragment of activated caspase 3 as a 17/19 kDa doublet on Western blots and does not cross-react with full-length (inactive) caspase n3 or other caspases (Ahern et al., Citation2013; Sammeta & McClintock, Citation2010). Phospho-ERK antibody (pThr202/pThr204, #4376, 1:1000) recognizes single bands at 42/44 kDa only when dually phosphorylated at Thr202 and Tyr204 of ERK1 (Thr185 and Tyr187 of Erk2), and singly phosphorylated at Thr202 of ERK2 (Fado et al., 2013; Gonzalez-Perez et al., Citation2013). Phospho-Akt antibody (pThr308, #4056, 1:1000) detects Akt phosphorylated at Thr308 as a single band at 60 kDa and does not cross-react with the corresponding phosphorylated residues of either JNK/SAPK or p38 MAP kinase (Gonzalez-Perez et al., Citation2013). Bcl-2 (#2870, 1:1000) antibody recognizes a single band at 25 kDa and does not cross-react with other Bcl-2 family members (Montes-Rodríguez et al., 2009). phospho-Bad (pSer112, #5284, 1:1000) detects Bad only when phosphorylated at Ser113 as a single band at 23 kDa and does not detect related family members (Chen et al., Citation2009). ERK1/2 (#4695P, 1:1000) and Bad (#9292S, 1:1000) antibodies recognize total ERK1/2 and Bad proteins, respectively. Mouse monoclonal antibody for Bax (B9, #sc-7480, 1:1000, Santa Cruz Biotechnology, Santa Cruz, CA) detects Bax as a single band at 21 kDa (Montes-Rodríguez et al., 2009).
Western blot procedure
At postnatal days (PND) 1, 3, 6, 9, 12, 15, 21 and 43, male rats (n = 6 at each time-point; no siblings were used for any single time-point) were killed by rapid decapitation. Fresh brain tissue was removed quickly and dissected on ice-cooled saline (0.9%) solution. Brains were coronally blocked from optic chiasm to posterior 1–3 mm, depending on the PND (Bregma 0 to −3 mm for PND 43, according to The Rat Brain Atlas; Paxinos & Watson, Citation2009) and cubes of approximately 1–27 mm3 (depending on the PND) of ventral diencephalon were obtained under a stereoscopic microscope using microdissection tools. Each sample derived from a single hypothalamus (tissue individually assayed) was homogenized in ice-cooled lysis buffer containing 130 mM NaCl, 20 mM Tris–HCl (pH 7.4), 1% Triton X-100, protease inhibitor cocktail (Sigma-Aldrich) and phosphatase inhibitors (0.01 M NaH2PO4, 0.05 M NaF, 0.002 M Na3VO4). The lysates were centrifuged at 18,210 g (4 °C) for 15 min and the supernatants were collected for protein concentration assessment using a Bradford assay kit (Biorad, Hercules, CA). The same amount of total protein (30 μg) was assayed for each immunoblot. Proteins were separated on 10% or 15% SDS–PAGE and transferred onto nitrocellulose membranes (Amersham Pharmacia Biotech, Arlington Heights, IL). Membranes were blocked for 1 h at room temperature in Starting block T20 blocking buffer (Pierce, Rockford, IL). They were then incubated with the primary antibodies listed in the section above at 4 °C overnight. Antibodies were previously tested with a total brain lysate in order to obtain the working concentration. After rinsing six times in Trizma buffer + Tween 0.1%, membranes were incubated with anti-mouse or anti-rabbit horseradish peroxidase-coupled IgG (#115-035-003 and #111-035-003, respectively, 1:40,000, Jackson Immunoresearch) for 1 h at room temperature. Membranes were rinsed again six times with TBST, and then subjected to detection by Supersignal ECL (Pierce) or SuperSignal West Dura Western blotting kits (Pierce) on hyperfilm ECL (Amersham Pharmacia Biotech). Beta-actin horseradish peroxidase conjugated (#47778, C4, 1:5000, Santa Cruz) was used as an internal control for equal protein loading. Protein levels (intensity of immunoreactivity) were interpreted by densitometric analysis using a computer-assisted densitometry program NIH ImageJ 1.31 (National Institutes of Health, Bethesda, MD) on bands of the hyperfilm.
Cell density quantification and statistical analysis
One out of every six methylene blue stained sections containing hypothalamus were examined under light microscope. Cellular density was assessed under the 100× objective in the hypothalamic nuclei selected for this study according to The Rat Brain Atlas (Paxinos & Watson, Citation2009) with help of a drawing tube set at 10×. A square corresponding to 0.009 mm2 at the above magnification was printed on white papers. At the beginning of each assessment, the experimenter overlapped the square image projected from the drawing tube to the visual field with the anatomical region to be assessed. Stained cells inside one square were draw. Three to five square-fields were assessed per each nucleus. The drawings were coded for subsequent blind counting. Data from the hypothalamic nucleus were averaged for statistic analysis. NeuN positive cells in the following hypothalamic regions were counted: Arc, PVNmpd, AHA, MPO, SCh and PePO, which are regions relevant for stress coping (Simerly, Citation1995). Due to the heterogeneous pattern of expression of GFAP, the density of the cells expressing this astrocyte marker was not quantified.
All data are presented as mean ± standard error of the mean (±SEM). For cell density assessment, statistical significance (p < 0.05) was determined using Student’s t-test. For Western blots, prior to running any statistical analyses, all dependent variables were assessed for univariate outliers and normality (Verma et al., Citation2013). All variables were within an acceptable range. Therefore two-way analysis of variance (ANOVA) of main effects (treatment and age) with post hoc Bonferroni multiple comparisons was used. Statistical analyses were performed using GraphPad Prism 5 (Prism Software Corporation, Irvine, CA).
Results
MS increased cell density and NeuN-expressing cell number in hypothalamic regions of rat pups
Total cellular density of several hypothalamic regions on PND 21 was evaluated using methylene blue-stained sections. MS rats exhibited significantly higher densities of methylene blue-stained cellular nuclei than AFR rats for all the hypothalamic nuclei studied (, panel A). The mean counts for each region were as follows: MS 72.7 ± 2.7 versus AFR 53.7 ± 2 in the MPOc (t(4) = 5.59, p < 0.01); MS 69.7 ± 2 versus AFR 59.3 ± 1.4 in the MPOm (t(4) = 4.14, p < 0.05); MS 43.3 ± 0.9 versus AFR 36 ± 1.2 in the PePO (t(4) = 5.05, p < 0.01); MS 58.3 ± 0.7 versus AFR 46.3 ± 1.2 in the PVNmpd (t(4) = 8.73, p < 0.005); MS 70.3 ± 3.4 versus AFR 54.3 ± 1.8 in the SChDL (t(4) = 4.19, p < 0.05); MS 55.3 ± 0.9 versus AFR 45.3 ± 0.9 in the AHA (t(4) = 8.02, p < 0.01) and MS 87 ± 2.9 versus AFR 72.7 ± 3 in the Arc (t(4) = 3.47, p < 0.05; , panel A). Immunohistochemistry for NeuN (, panels C–E′) and GFAP (, panels F–H) was used to distinguish effects on neuronal and glial populations. The mean number of NeuN-immunopositive cells was increased in MS rats compared to AFR rats in the following regions studied: MS 43.3 ± 2.4 versus AFR 30.7 ± 2 (t(4) = 4.028, p < 0.05) in the MPOm; MS 33.7 ± 0.3 versus AFR 25.9 ± 1.5 cells (t(4) = 5.211, p < 0.01) in the PVNmpd; MS 40 ± 1.2 versus AFR 28.3 ± 1.8 (t(4) = 5.534, p < 0.01) in the AHA and MS 65.3 ± 1.9 versus AFR 51 ± 1.2 (t(4) = 6.557, p < 0.01) in the ventromedial hypothalamic nucleus (, panel B). Notably, some hypothalamic nuclei, with high cellular density at the same developing stage, did not express NeuN. These nuclei included the magnocellular PVN, supraoptic and suprachiasmatic nuclei.
Figure 1. Maternal separation influence on hypothalamic cell density of male offspring on postnatal day (PND) 21 and PND 36. Histograms showing (A) nuclear counts (methylene blue staining on PND 21) and (B) neuronal specific nuclear protein(NeuN) immunostaining on PND 36 in the respective hypothalamic nuclei. Data represent mean ± SEM. n = 3. *p < 0.05, **p < 0.01. (Student t-test). MS: maternal separation; AFR: animal facility reared control. MPOc: medial preoptic nucleus compact division; MPOm: medial preoptic nucleus medial division; PePO: periventricular preoptic nucleus; PVNmpd: paraventricular nucleus medial parvocellular division; SChdl: suprachiasmatic nucleus dorsolateral division; AHA: anterior hypothalamic area; Arc: arcuate hypothalamic nucleus; VMH: ventromedial hypothalamic nucleus. Panels C–G′: representative photomicrographs (AFR: left column; MS: right column) showing C and C′ NeuN immunostaining of coronal preoptic/anterior hypothalamus around Bregma −0.96 mm with higher magnification of dashed rectangles showed in D and D′. (E and E′) Coronal sections around tuberal hypothalamus, Bregma −2.28 mm. Note the difference of cell density and the span of the nuclear regions on PND 36. Glial fibrillary acidic protein (GFAP) staining for astrocytes shows uneven immunostaining patterns (F and F′). However, some regions showed increased astrocytic densities in the MS sections, e.g. regions marked by dashed ovals corresponding to supraoptic and suprachiasmatic nuclei and periventricular regions (dashed rectangles showed in higher magnification in panels G and G′). In contrast to hypothalamus, the hippocampus on PND 36 exhibits an ordered GFAP+ astrocyte distribution (panel H). Scale bars: 500 μm for panels C, C′, E, E′, F, F′ and H; 50 μm for other panels.
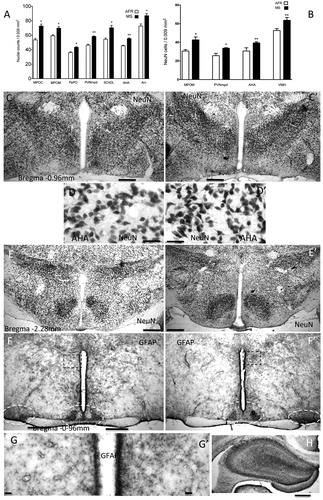
Regarding GFAP expression, unlike the hippocampus where the GFAP immunopositive astrocytes were already distributed in an ordered-matrix pattern at PND 36 (), the hypothalamic GFAP immunopositive astrocytes showed a highly heterogeneous pattern (, panels F and F′), which did not allow us to obtain quantitative data for each nucleus. Nonetheless, a clear increase in GFAP labeling was observed in some regions, such as the periventricular (, G vs. G′) and suprachiasmatic nuclei (Figure F vs. F′).
MS effects on death or cell-survival related proteins in the developing and adolescent hypothalamus
We analyzed by Western blot the expression pattern of several key proteins implicated in death or cell survival during early development and young adulthood, in whole hypothalamic extracts obtained from AFR and MS rats. The extrinsic and intrinsic death pathways culminate in the activation of caspase 3 (by cleavage of the pro-enzyme). Thus we used the detection of activated caspase 3 to identify PCD events. A similar pattern of active caspase 3 (cleaved caspase 3) expression between MS and AFR rats was observed at the 3, 6, 9 and 12 PND time-points (). However, at PND 15 the MS rats presented a significant 9.4-fold reduction in expression – compared to AFR rats (p < 0.05; ; ). By PND 20 and in young adults both treatment groups showed decreased levels of active caspase 3 (cleaved) compared to PND 1 (). Two-way ANOVA analysis treatment versus age revealed that age (PND) significantly affected the temporal pattern of activated caspase 3 expression in the treatment groups (p < 0.03, ). These results reveal a displaced temporal pattern of caspase 3 activation in MS compared to AFR rats.
Figure 2. Effect of MS on the expression of pro-apoptotic active (cleaved) caspase 3 protein in early postnatal and young adult rat hypothalamus. Time course of expression of active caspase 3 (cleaved caspase 3) levels in animal facility reared (AFR) and maternally separated (MS) rats. PND: postnatal day. (a) Representative Western blots illustrating immunoreactivity for active caspase 3 and β-actin from dissected hypothalamus. (b) Densitometric analysis of active caspase 3 immunoblots. Each age point (PND) indicates the ratio of the active protein to the total protein expressed as the relative level of expression, estimated as a percentage of PND 1 values. Data are mean ± SEM. Open circles correspond to AFR and black boxes to MS rats. Statistical analyses by factorial ANOVA was used to determine the effects of MS treatment, age and treatment × age on protein levels (). *p < 0.05 versus AFR group (n = 6 rats per group per day).
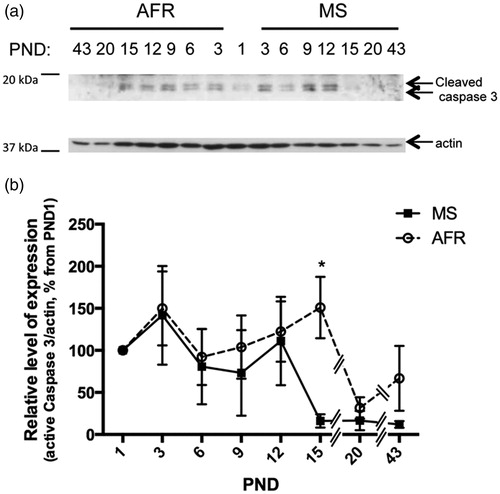
Table 1. Summary of statistical analysis of relative protein expression from MS and AFR.
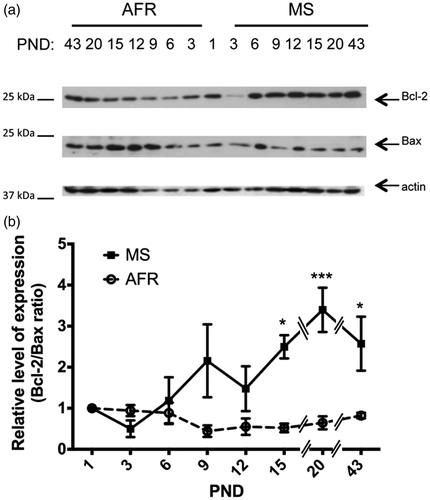
Anti-apoptotic Bcl-2 and pro-apoptotic Bax immunoreactivity was analyzed at different postnatal time points as single bands at 26 and 23 kDa, respectively (). The ratio of Bcl-2/Bax decreased from PND 9 to PND 20 in AFR rats, in contrast to increasing levels in MS rats (). ANOVA indicated that MS procedure, age as well as an interaction between treatment and age, all significantly affected the Bcl-2/Bax ratio (p < 0.001, p < 0.05 and p < 0.01, respectively; ). The effects of MS on the Bcl-2/Bax ratio depended on the age of the neonate and showed a distinctive quantitative pattern of expression. Specifically, MS rats showed a significant 4.5-, 5.3- and 3.3-fold increased expression of the Bcl-2/Bax ratio at PND 15, 20 and 43, respectively (p < 0.05, p < 0.001 and p < 0.05, respectively; ; ).
Figure 3. Effect of MS on the ratio of expression of anti-apoptotic Bcl-2 and pro-apoptotic Bax proteins in early postnatal and young adult rat hypothalamus. Time course of expression of the ratio between Bcl2 and Bax in animal facility reared (AFR) and maternally separated (MS) rats. PND: postnatal day. (a) Representative Western blots illustrating immunoreactivity for Bcl-2, Bax and β-actin proteins from dissected hypothalamus. (b) Densitometric analysis of Bcl-2 and Bax immunoblots. Each age point indicates the ratio of the relative level of expression of Bcl-2 and Bax. Data are mean ± SEM. Open circles correspond to AFR and black boxes to MS rats. Statistical analyses by factorial ANOVA was used to determine the effects of MS treatment, age and treatment × age on protein levels (): *p < 0.05 and ***p < 0.001 versus AFR group (n = 6 rats per group per day).
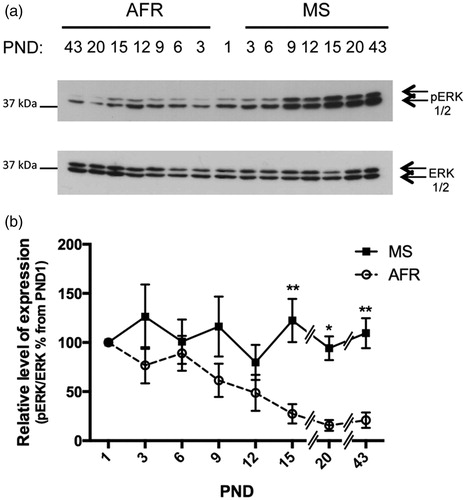
Activated ERK1/2 (phosphorylated ERK1/2) immunoreactivity for AFR and MS rats was detected as single bands at 42/44 kDa of phosphorylated ERK1/2 proteins (). The level of activated ERK1/2 decreased with neonatal age in AFR rats, in contrast to higher levels found in MS rats throughout all PNDs studied, and by PND 20 both treatment-groups (control vs. MS) presented a diminished expression (). Quantitative analysis showed that MS and treatment versus age interaction significantly affected activation of ERK1/2 (p < 0.0001 and p < 0.05, respectively, ), with a significant 4.5-, 6 - and 5.2-fold increased expression at PND 15, PND 20 and 43, respectively, in MS rats compared to AFR rats (p < 0.01, p < 0.05 and p < 0.01; ; ). These results demonstrate that the differences between the treatment-groups (control vs MS) were not due to a displaced temporal pattern of activation but rather to a prolonged and higher level of ERK1/2 activation.
Figure 4. Effect of MS on the expression of survival active (phosphorylated) ERK1/2 kinase in early postnatal and young adult rat hypothalamus. Time course of expression of activated ERK1/2 (phosphorylated ERK1/2, pERK) levels in animal facility reared (AFR) and maternally separated (MS) rats. PND: postnatal day. (a) Representative Western blots illustrating immunoreactivity for pERK1/2 and total ERK1/2 from dissected hypothalamus. (b) Densitometric analysis of pERK1/2 immunoblots. Each age point indicates the ratio of the active protein to the total protein expressed as the relative level of expression, estimated as a percentage from PND 1. Data are mean ± SEM. Open circles correspond to AFR and black boxes to MS rats. Statistical analyses by factorial ANOVA was used to determine the effects of MS treatment, age and treatment × age on protein levels (): *p < 0.05 and **p < 0.01 versus AFR group (n = 6 rats per group per day).
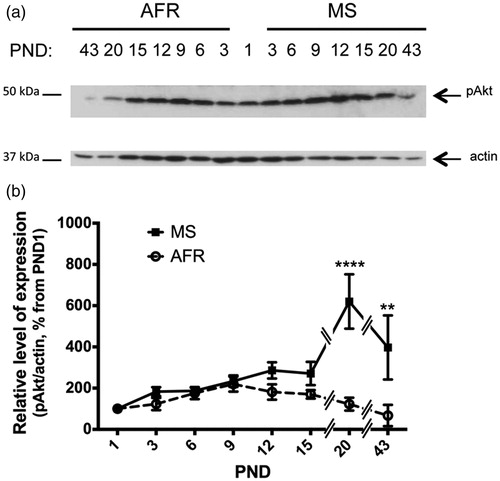
We next examined the level of activated Akt (phosphorylated Akt) from AFR and MS rats (single band at 60 kDa, ). Both treatment-groups (control vs. MS) showed similar levels of Akt; however, MS rats presented a significant 5- and 5.9-fold increase at PND 20 and PND 43 in contrast to AFR rats (p < 0.0001 and p < 0.001; ; ). Quantitative analysis revealed that MS, age and treatment-age interaction significantly affected activated Akt levels (p < 0.001; ).
Figure 5. Effect of MS on the expression of survival active (phosphorylated) Akt kinase in early postnatal and young adult rat hypothalamus. Time course of expression of activated Akt (phosphorylated Akt, pAkt) levels in animal facility reared (AFR) and maternally separated (MS) rats. PND: postnatal day. (a) Representative Western blots illustrating immunoreactivity for pAkt and β-actin (same membrane as for caspase 3) from dissected hypothalamus. (b) Densitometric analysis of pAkt immunoblots. Each age point indicates the ratio of the active protein to the total protein expressed as the relative level of expression, estimated as a percentage from PND 1. Data are mean ± SEM. Open circles correspond to AFR and black boxes to MS rats. Statistical analyses by factorial ANOVA was used to determine the effects of MS treatment, age and treatment × age on protein levels (): **p < 0.01 and ****p < 0.0001 versus AFR group (n = 6 per group per day).
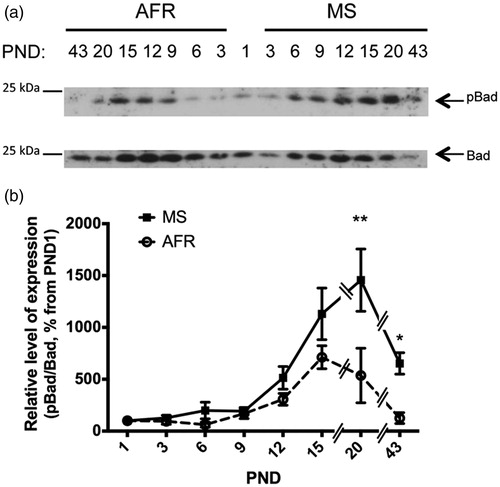
Finally, the levels of anti-apoptotic Bad (phosphorylated Bad, pBad, at Ser112, single band at 25 kDa; ) were analyzed. ANOVA revealed that treatment and age significantly affected pBad levels, with an (age vs. treatment) interaction (p < 0.001, p < 0.0001 and p < 0.05, respectively; ). shows higher levels of pBad during neonatal ages with a peak around PND 15 in AFR rats while this peak was reached at a later postnatal day (PND 20) with a significant 2.4-fold increase in MS rats (p < 0.001; ). Furthermore, a significant difference in pBad levels was also observed at PND 43 (p < 0.05; ).
Figure 6. Effect of MS on the expression of anti-apoptotic inactive (phosphorylated) Bad kinase in early postnatal and young adult rat hypothalamus. Time course of expression of inactivated Bad (phosphorylated Bad at Ser112, pBad) levels in animal facility reared (AFR) and maternally separated (MS) rats. PND: postnatal day. (a) Representative Western blots illustrating immunoreactivity for pBad and Bad from dissected hypothalamus. (b) Densitometric analysis of pBad immunoblots. Each age point indicates the ratio of the inactive protein to the total protein expressed as the relative level of expression, estimated as a percentage from PND 1. Data are mean ± SEM. Open circles correspond to AFR and black boxes to MS rats. Statistical analyses by factorial ANOVA was used to determine the effects of MS treatment, age and treatment × age on protein levels (): *p < 0.05 and **p < 0.01 versus AFR group (n = 6 rats per group per day).
Discussion
In the present study, we found that neonatal MS promotes cell survival in the rat hypothalamus and interferes with PCD, resulting in an increased density of neurons in several hypothalamic nuclei of male rat pups.
The medial preoptic nucleus (MPO), the paraventricular nucleus (PVN) and AHA from the periventricular and medial zones of the anterior region of the hypothalamus, here studied, contain neurons with projections to neuroendocrine, somatomotor and autonomic response pathways. The nuclei studied are involved in the regulation of maternal and reproductive behaviour (e.g. MPO) and hormone secretion (e.g. PVN, PePO and SChDL) (Simerly, Citation1995). The increased neuron number in these hypothalamic regions may explain the hyperreactivity of the stress axis in the MS adult rats as reported in several studies (Veenema et al., Citation2006; Zhang et al., Citation2012).
Implications of PCD/survival modulation by MS
PCD is mediated by caspases and pro- and anti-apoptotic members of the Bcl-2 family. Activated (i.e. cleaved) caspase 3 is considered an apoptotic marker in the nervous system (Hengartner, Citation2000; Kuida et al., Citation1996; Porter & Janicke, Citation1999), as it promotes the irreversible proteolysis of critical cellular components (Bredesen, Citation2000). Moreover, vulnerability to PCD has been proposed to be determined also by the Bcl-2/Bax ratio (Oltvai et al., Citation1993). The highest levels of PCD have been reported at early postnatal ages (Ahern et al., Citation2013; White & Barone, Citation2001): in rodents, 60–70% of newly produced neuronal cells during the first postnatal week undergo PCD during the second postnatal week (Bandeira et al., Citation2009). In our study, the levels of expression of activated caspase 3 seen from PND 1 to PND 15 and the reduced Bcl-2/Bax ratio from PND 6 to PND 20 in AFR rats corresponds with the reported timing of neuronal death (Bandeira et al., Citation2009; Clarke, Citation1985). A similar pattern of expression of these proteins was observed in several rat brain regions (Mooney & Miller, Citation2000; Shimohama et al., Citation1998). Expression of the Bcl-2/Bax ratio does not completely coincide with the decrease in active caspase 3 expression; thus, even if Bcl-2 and Bax proteins are directly involved in caspase 3 activation, other factors may also be modulating its activity.
The time course of active caspase-3-expression in the MS groups was reduced earlier (between PND 12 and PND 15) in MS rats compared to AFR rats (between PND 15 and PND 20), and by PND 20 the process was largely abated in both treatment-groups. The Bcl-2/Bax ratio was found to be significantly increased after PND 15 in MS rats indicating that the pattern of change in this ratio might be another factor for the reduction of PCD in the hypothalamus of MS offspring. Diminished caspase 3 expression is key to terminate the period of PCD (Mooney & Miller, Citation2000); thus, the finding here that MS decreases caspase 3 expression at an earlier PND, could precipitate the end of PCD in the hypothalamus.
Together, these results imply that MS is altering normal postnatal development of the hypothalamus by a combination of a different temporal pattern of activated caspase 3 expression with increased Bcl-2 family anti-apoptotic protein expression. Consistent with our results, a 24 h maternal deprivation (Chocyk et al., Citation2011) or artificially rearing of rats (Chatterjee et al., Citation2007; Chatterjee-Chakraborty & Chatterjee, Citation2010) has shown decreased levels of PCD at a particular PND and brain area, such as the substantia nigra (Chocyk et al., Citation2011) and some sexually dimorphic areas of the hypothalamus (Chatterjee et al., Citation2007; Chatterjee-Chakraborty & Chatterjee, Citation2010). However, in a study using maternal deprivation for 24 h at PND 12, increased levels of PCD in hippocampus or cerebral cortex, but not hypothalamus, were observed (Zhang et al., Citation2002). However, the experimental model used in the present study is fundamentally different from the last mentioned one (Zhang et al., Citation2002). For instance, maternal deprivation for 24 h severely alters hydroelectrolyte balance in the newborn, whereas MS for 3 h has no significant effects (unpublished data). Variations in maternal behavior after the pups were handled have been reported in the literature and the long-term consequences, from beneficial to detrimental, of these manipulations have been proposed (Champagne, Citation2013; Chatterjee et al., Citation2007). In this light, it would be expected that different MS schemes yield different modifications and a trans-model comparison should be carefully considered.
We also measured expression of activated ERK1/2 and Akt, as well as inactivated Bad (by phosphorylation at Ser112), given the role of these proteins in signaling pathways implicated in neuronal survival and proliferation (Brunet et al., Citation2001; Davies, Citation2003; Hetman & Gozdz, Citation2004; Oppenheim et al., Citation2010); they are also important in neurogenesis, both in early development and in repair processes of the CNS (Faedo et al., Citation2008; Shioda et al., Citation2009). Around PND 15–20, MS rats showed increased phosphorylation of ERK1/2 and Akt, together with increased phosphorylation of Bad. ERK1/2 and Akt pro-survival kinases are responsible for Bad inactivation by phosphorylation (del Peso et al., Citation1997) leading to inhibition of caspase 3 activation and promoting cell survival (Zha et al., Citation1996). Thus, our results indicate that survival pathways are enhanced in MS rats.
Molecular targets of MS action
The mechanism of MS-induced ERK1/2 and Akt activation is complex and might involve neurotrophic factors, neuropeptides and/or neurotransmitters. Neurotrophic factors, like brain derived neurotrophic factor (BDNF) and epidermal growth factor activate the Ras–Raf–MEK (mitogen-activated protein kinase/ERK) pathway resulting in cellular neurotrophic actions, including neurite growth, regeneration and neurogenesis (Fishwick et al., Citation2010; Kaplan & Miller, Citation2000). Moreover, the survival-promoting effects of BDNF are also associated with inactivated/phosphorylated Bad by MAPK/ERK1/2 (Bonni et al., Citation1999; Downward, Citation1999) or Akt (del Peso et al., Citation1997). Therefore, neurotrophic factors could be involved in the increase of pro-survival factors during MS. In support of this, MS has been found to increase the expression of nerve growth factor and BDNF in rat hypothalamus and hippocampus (Cirulli et al., Citation2003).
Another possible mechanism by which MS may induce an enhanced hypothalamic cell survival is through the up-regulated vasopressin (AVP) system promoted by MS (Zhang et al., Citation2012). This may lead to an amplified ligand-presence of AVP in hypothalamic regions expressing vasopressin receptors, V1a and V1b. AVP has been found to stimulate cellular proliferation/growth in several cell types such as fibroblasts, endothelial, muscle, kidney and other cells, through V1a, V1b and V2 receptors (Hoffert et al., Citation2012; Koshimizu et al., Citation2012) and is evidently an anti-apoptotic molecule for hypothalamic neurons (Chen et al., Citation2008, Citation2009; Koshimizu et al., Citation2012) and kidney cells (Hoffert et al., Citation2012) through vasopressin receptors. More importantly, AVP promotes cell survival through the activation of the MAPK/ERK1/2, PI3K/Akt pathways and Bad inactivation, blocking caspase 3 activation thus leading to apoptotic cell death inhibition in hypothalamic neurons (Chen et al., Citation2008, Citation2009; Koshimizu et al., Citation2012). It is thus possible to speculate that increased release of AVP in the hypothalamus of MS rats could act as another important pro-survival/anti-apoptotic molecule through the activation of survival pathways such as ERK1/2 and Akt inhibiting PCD during the postnatal developmental period.
The ability to inhibit PCD and promote sustained activation of survival pathways around PND 15–20, at the end or 5 d after the last separation manipulation, is not yet clear. However, other studies have shown different levels of protein expression occurring after MS has finished. Indeed, BDNF expression has been found to be increased on PND 17 or PND 16–20 (in a PND 2–14 or 10–15 MS paradigm, respectively) (Lee et al., Citation2012; Roceri et al., Citation2004). Thus, it is possible to hypothesize that prolonged and abnormal expression of some proteins, such as ERK1/2, Akt, Bcl-2 and pBad, may result from repetitive MS, which in turn is an adaptive consequence of each preceding MS event.
The results from this study provide a novel temporal description of expression changes for some key pro-/anti-apoptotic factors following MS, which may serve as a basis for further understanding the molecular mechanisms of MS consequences on development of the hypothalamus.
In summary, our present data show that the fine balance between the expression and activities of cell survival and death proteins, and their temporal pattern, are disturbed by MS. The perturbation of these profiles of PCD during this critical period of development by MS, may represent an additional correlate of vulnerability involved in aberrant cell number and plasticity of the hypothalamus. Dysregulation of the signaling pathways involving ERK1/2, Akt, Bad, Bcl-2, Bax and caspase 3 may be a key mechanism by which MS induces changes in survival of susceptible neural cells.
Declaration of interest
This study was supported by grants: Consejo Nacional para la Ciencia y Tecnología (CONACYT): 127777, 179616 and PAPIIT DGAPA- UNAM IN218111, IN216214, IA202314. ATNK was supported by CONACYT PhD study scholarship. The authors declare no conflict of interest.
Acknowledgements
We thank Surendra P. Verma for help in statistical analysis and for providing UDASYS program, to Nanjing Gao and Hernán Barrio for help in Western blots, Luz Navarro and Laura Escobar for equipment, Guadalupe Domínguez and Enrique Pinzón for technical assistance and Nicolás Villegas-Sepúlveda and Carmen Sánchez-Torres for generous antibody donation.
References
- Ahern TH, Krug S, Carr AV, Murray EK, Fitzpatrick E, Bengston L, McCutcheon J, et al. (2013). Cell death atlas of the postnatal mouse ventral forebrain and hypothalamus: effects of age and sex. J Comp Neurol 521:2551–69
- Bandeira F, Lent R, Herculano-Houzel S. (2009). Changing numbers of neuronal and non-neuronal cells underlie postnatal brain growth in the rat. Proc Natl Acad Sci USA 106:14108–13
- Bonni A, Brunet A, West AE, Datta SR, Takasu MA, Greenberg ME. (1999). Cell survival promoted by the Ras-MAPK signaling pathway by transcription-dependent and -independent mechanisms. Science 286:1358–62
- Bredesen DE. (2000). Apoptosis: overview and signal transduction pathways. J Neurotrauma 17:801–10
- Brunet A, Datta SR, Greenberg ME. (2001). Transcription-dependent and -independent control of neuronal survival by the PI3K-Akt signaling pathway. Curr Opin Neurobiol 11:297–305
- Buss RR, Sun W, Oppenheim RW. (2006). Adaptive roles of programmed cell death during nervous system development. Annu Rev Neurosci 29:1–35
- Champagne FA. (2013). Early environments, glucocorticoid receptors, and behavioral epigenetics. Behav Neurosci 127:628–36
- Chatterjee D, Chatterjee-Chakraborty M, Rees S, Cauchi J, de Medeiros CB, Fleming AS. (2007). Maternal isolation alters the expression of neural proteins during development: ‘stroking’ stimulation reverses these effects. Brain Res 1158:11–27
- Chatterjee-Chakraborty M, Chatterjee D. (2010). Artificial rearing inhibits apoptotic cell death through action on pro-apoptotic signaling molecules during brain development: replacement licking partially reverses these effects. Brain Res 1348:10–20
- Chen J, Liu Y, Soh JW, Aguilera G. (2009). Antiapoptotic effects of vasopressin in the neuronal cell line H32 involve protein kinase Calpha and beta. J Neurochem 110:1310–20
- Chen J, Volpi S, Aguilera G. (2008). Anti-apoptotic actions of vasopressin in H32 neurons involve MAP kinase transactivation and Bad phosphorylation. Exp Neurol 211:529–38
- Chocyk A, Dudys D, Przyborowska A, Majcher I, Mackowiak M, Wedzony K. (2011). Maternal separation affects the number, proliferation and apoptosis of glia cells in the substantia nigra and ventral tegmental area of juvenile rats. Neuroscience 173:1–18
- Cirulli F, Berry A, Alleva E. (2003). Early disruption of the mother–infant relationship: effects on brain plasticity and implications for psychopathology. Neurosci Biobehav Rev 27:73–82
- Clarke PG. (1985). Neuronal death during development in the isthmo-optic nucleus of the chick: sustaining role of afferents from the tectum. J Comp Neurol 234:365–79
- Davies AM. (2003). Regulation of neuronal survival and death by extracellular signals during development. EMBO J 22:2537–45
- del Peso L, Gonzalez-Garcia M, Page C, Herrera R, Nunez G. (1997). Interleukin-3-induced phosphorylation of BAD through the protein kinase Akt. Science 278:687–9
- Downward J. (1999). How BAD phosphorylation is good for survival. Nat Cell Biol 1:E33–5
- Estrada FS, Hernandez VS, Lopez-Hernandez E, Corona-Morales AA, Solis H, Escobar A, Zhang L. (2012). Glial activation in a pilocarpine rat model for epileptogenesis: a morphometric and quantitative analysis. Neurosci Lett 514:51–6
- Estrada FS, Hernandez VS, Medina MP, Corona-Morales AA, Gonzalez-Perez O, Vega-Gonzalez A, Zhang L. (2009). Astrogliosis is temporally correlated with enhanced neurogenesis in adult rat hippocampus following a glucoprivic insult. Neurosci Lett 459:109–14
- Fado R, Moubarak RS, Minano-Molina AJ, Barneda-Zahonero B, Valero J, Saura CA, Moran J, et al. (2013). X-linked inhibitor of apoptosis protein negatively regulates neuronal differentiation through interaction with cRAF and Trk. Sci Rep 3(2397):1–11
- Faedo A, Tomassy GS, Ruan Y, Teichmann H, Krauss S, Pleasure SJ, Tsai SY, et al. (2008). COUP-TFI coordinates cortical patterning, neurogenesis, and laminar fate and modulates MAPK/ERK, AKT, and beta-catenin signaling. Cereb Cortex 18:2117–31
- Fang X, Yu S, Eder A, Mao M, Bast RC Jr., Boyd D, Mills GB. (1999). Regulation of BAD phosphorylation at serine 112 by the Ras-mitogen-activated protein kinase pathway. Oncogene 18:6635–40
- Fishwick KJ, Li RA, Halley P, Deng P, Storey KG. (2010). Initiation of neuronal differentiation requires PI3-kinase/TOR signalling in the vertebrate neural tube. Dev Biol 338:215–25
- Gonzalez-Perez G, Segovia NC, Rivas-Carvalho A, Reyes DP, Torres-Aguilar H, Aguilar-Ruiz SR, Irles C, et al. (2013). Human CD4(+) effector T lymphocytes generated upon TCR engagement with self-peptides respond defectively to IL-7 in their transition to memory cells. Cell Mol Immunol 10(3):261–74
- Hengartner MO. (2000). The biochemistry of apoptosis. Nature 407:770–6
- Hernandez VS, Ruiz-Velazco S, Zhang L. (2012). Differential effects of osmotic and SSR149415 challenges in maternally separated and control rats: the role of vasopressin on spatial learning. Neurosci Lett 528:143–7
- Hetman M, Gozdz A. (2004). Role of extracellular signal regulated kinases 1 and 2 in neuronal survival. Eur J Biochem 271:2050–5
- Hoffert JD, Pisitkun T, Saeed F, Song JH, Chou CL, Knepper MA. (2012). Dynamics of the G protein-coupled vasopressin V2 receptor signaling network revealed by quantitative phosphoproteomics. Mol Cell Proteomics 11(2):M111 014613
- Kaplan DR and Miller FD. (2000). Neurotrophin signal transduction in the nervous system. Curr Opin Neurobiol 10:381–91
- Koshimizu TA, Nakamura K, Egashira N, Hiroyama M, Nonoguchi H, Tanoue A. (2012). Vasopressin V1a and V1b receptors: from molecules to physiological systems. Physiol Rev 92:1813–64
- Kuida K, Zheng TS, Na S, Kuan C, Yang D, Karasuyama H, Rakic P, Flavell RA. (1996). Decreased apoptosis in the brain and premature lethality in CPP32-deficient mice. Nature 384:368–72
- Ladd CO, Huot RL, Thrivikraman KV, Nemeroff CB, Meaney MJ, Plotsky PM. (2000). Long-term behavioral and neuroendocrine adaptations to adverse early experience. Prog Brain Res 122:81–103
- Lee KY, Miki T, Yokoyama T, Ueki M, Warita K, Suzuki S, Ohta K, et al. (2012). Neonatal repetitive maternal separation causes long-lasting alterations in various neurotrophic factor expression in the cerebral cortex of rats. Life Sci 90:578–84
- Levine S. (1994). The ontogeny of the hypothalamic-pituitary-adrenal axis. The influence of maternal factors. Ann NY Acad Sci 746:275–88; discussion 289–93
- McLendon RE, Bigner DD. (1994). Immunohistochemistry of the glial fibrillary acidic protein: basic and applied considerations. Brain Pathol 4:221–8
- Meaney MJ, Aitken DH, Bodnoff SR, Iny LJ, Sapolsky RM. (1985). The effects of postnatal handling on the development of the glucocorticoid receptor systems and stress recovery in the rat. Prog Neuropsychopharmacol Biol Psychiatry 9:731–4
- Montes-Rodríguez CJ, Alavez S, Soria-Gómez E, Rueda-Orozco PE, Guzman K, Morán J, Prospéro-García O. (2009). BCL-2 and BAX proteins expression throughout the light-dark cycle and modifications induced by sleep deprivation and rebound in adult rat brain. J Neurosci Res 87(7):1602–9
- Mooney SM, Miller MW. (2000). Expression of bcl-2, bax, and caspase-3 in the brain of the developing rat. Brain Res Dev Brain Res 123:103–17
- Murgatroyd C, Patchev AV, Wu Y, Micale V, Bockmuhl Y, Fischer D, Holsboer F, et al. (2009). Dynamic DNA methylation programs persistent adverse effects of early-life stress. Nat Neurosci 12:1559–66
- Oltvai ZN, Milliman CL, Korsmeyer SJ. (1993). Bcl-2 heterodimerizes in vivo with a conserved homolog, Bax, that accelerates programmed cell death. Cell 74:609–19
- Oppenheim RW. (1991). Cell death during development of the nervous system. Annu Rev Neurosci 14:453–501
- Oppenheim RW, Milligan C, Sun W. (2010). Chapter 5: Programmed cell death during nervous system development: mechanisms, regulation, functions and implications for neurobehavioral ontogeny. In: Blumberg MS, Freeman JH, Robinson SR, editors. Oxford handbook of developmental behavioral neuroscience. New York: Oxford University Press. p 76–107
- Paxinos G, Watson C. (2009). The rat brain. 6th ed. San Diego: Elsevier
- Plotsky PM, Meaney MJ. (1993). Early, postnatal experience alters hypothalamic corticotropin-releasing factor (CRF) mRNA, median eminence CRF content and stress-induced release in adult rats. Brain Res Mol Brain Res 18:195–200
- Porter AG, Janicke RU. (1999). Emerging roles of caspase-3 in apoptosis. Cell Death Differ 6:99–104
- Roceri M, Cirulli F, Pessina C, Peretto P, Racagni G, Riva MA. (2004). Postnatal repeated maternal deprivation produces age-dependent changes of brain-derived neurotrophic factor expression in selected rat brain regions. Biol Psychiatry 55:708–14
- Sammeta N, McClintock TS. (2010). Chemical stress induces the unfolded protein response in olfactory sensory neurons. J Comp Neurol 518:1825–36
- Shimohama S, Fujimoto S, Sumida Y, Tanino H. (1998). Differential expression of rat brain bcl-2 family proteins in development and aging. Biochem Biophys Res Commun 252:92–6
- Shioda N, Han F, Fukunaga K. (2009). Role of Akt and ERK signaling in the neurogenesis following brain ischemia. Int Rev Neurobiol 85:375–87
- Simerly RB. (1995). Chapter 17: Anatomical substrates of hypothalamic integration. In: Paxinos G, editor. The rat nervous system. 2nd ed. Sydney: Academic Press. p 353–76
- Veenema AH. (2009). Early life stress, the development of aggression and neuroendocrine and neurobiological correlates: what can we learn from animal models? Front Neuroendocrinol 30:497–518
- Veenema AH, Blume A, Niederle D, Buwalda B, Neumann ID. (2006). Effects of early life stress on adult male aggression and hypothalamic vasopressin and serotonin. Eur J Neurosci 24:1711–20
- Verma SP, Cruz-Huicochea R, Díaz-González L. (2013). Univariate data analysis system: deciphering mean compositions of island and continental arc magmas, and influence of the underlying crust. Int Geol Rev 55:1922–40
- White LD, Barone S Jr. (2001). Qualitative and quantitative estimates of apoptosis from birth to senescence in the rat brain. Cell Death Differ 8:345–56
- Zha J, Harada H, Yang E, Jockel J, Korsmeyer SJ. (1996). Serine phosphorylation of death agonist BAD in response to survival factor results in binding to 14-3-3 not BCL-X(L). Cell 87:619–28
- Zhang L, Hernandez VS, Liu B, Medina MP, Nava-Kopp AT, Irles C, Morales M. (2012). Hypothalamic vasopressin system regulation by maternal separation: its impact on anxiety in rats. Neuroscience 215:135–48
- Zhang L, Hernandez VS, Medina-Pizarro M, Valle-Leija P, Vega-Gonzalez A, Morales T. (2008). Maternal hyperthyroidism in rats impairs stress coping of adult offspring. J Neurosci Res 86:1306–15
- Zhang L, Medina MP, Hernandez VS, Estrada FS, Vega-Gonzalez A. (2010). Vasopressinergic network abnormalities potentiate conditioned anxious state of rats subjected to maternal hyperthyroidism. Neuroscience 168:416–28
- Zhang LX, Levine S, Dent G, Zhan Y, Xing G, Okimoto D, Kathleen Gordon M, et al. (2002). Maternal deprivation increases cell death in the infant rat brain. Brain Res Dev Brain Res 133:1–11