
Abstract
We have previously shown that urban upbringing and city living were associated with stress-induced activity in the amygdala and the perigenual anterior cingulate cortex (pACC). This finding might link the epidemiological risk factor “urbanicity” to neurobiological mechanisms of psychiatric disorders. However, given the heritability of stress-related phenotypes, it appears likely that genetic factors can modulate the effect of urbanicity on social stress processing. In the present exploratory study, we investigated if a functional sequence variation in the neuropeptide S receptor gene (NPSR1 rs324981) is associated with brain activation patterns under acute psychosocial stress and if it modulates the link between urbanicity and central stress processing. In animals, neuropeptide S has strong anxiolytic effects and it induces hypothalamus-pituitary-adrenal (HPA) axis activation. In humans, rs324981 was found to be associated with anxiety and stress-related phenotypes. Forty-two subjects were exposed to a psychosocial stress task for scanner environments (ScanSTRESS). While no main effect of rs324981 on amygdala and pACC activity was detected, we found a distinct interaction between rs324981 and urban upbringing modulating right amygdala responses. Moreover, right amygdala responses were significantly higher in subjects who also showed a salivary cortisol response to the stress exposure. The present finding of a gene × environment interaction further supports the view that the brain NPS system is involved in central stress regulation. This study provides first evidence for the assumption that a NPSR1 variant modulates brain activation under stress, interacting with the environmental risk factor urban upbringing.
Introduction
Individuals born and raised in an urban environment suffer more often from schizophrenia (Pedersen & Mortensen, Citation2001; van Os et al., Citation2004), anxiety disorders and depression (Peen et al., Citation2010) than people living in the countryside. Previously, we found an association of urbanicity with neural stress processing (Lederbogen et al., Citation2011). Current urban environment exposure was associated with increased amygdala activity under acute stress while urban upbringing was associated with increased activity in the perigenual anterior cingulate cortex. These structures are involved in stress regulation and social cue processing and show alterations in subjects with psychiatric disorders (Monk, Citation2008) as schizophrenia (Radua et al., Citation2012) and anxiety disorders (Holzschneider & Mulert, Citation2011).
Stress is a well-known risk factor for psychopathology (Chrousos, Citation2009). Genetic factors do also influence the risk for psychopathology and they influence stress reactivity as revealed in family studies on major depression (Sullivan et al., Citation2000), anxiety (Kendler et al., Citation2008), schizophrenia (Cardno & Gottesman, Citation2000) and HPA axis regulation (Federenko et al., Citation2004; Wüst et al., Citation2000). A molecule recently implied in anxiety and stress regulation is neuropeptide S (NPS). NPS acts via the G-protein-coupled NPS receptor 1 (NPSR1) (Xu et al., Citation2004), which is expressed throughout the brain including limbic structures (Clark et al., Citation2011; Leonard & Ring, Citation2011). A promising NPS receptor gene (NPSR1) variant is rs324981, a single nucleotide polymorphism encoding an amino acid change (A > T Asn107Ile). The minor Ile107 variant shows increased surface receptor expression and a five- to tenfold higher NPS-induced signaling response than the Asn107 variant (Reinscheid et al., Citation2005). First evidence suggests associations between rs324981 and anxiety-related phenotypes. While in one study genotype AA was underrepresented only in male panic disorder patients (Okamura et al., Citation2007), in another sample the T allele was associated with panic disorder only in females (Domschke et al., Citation2011). In panic disorder and agoraphobia patients the T allele was associated with higher anxiety sensitivity, heart rate and symptom reports during a behavioral avoidance test (Domschke et al., Citation2011). Healthy subjects with genotype TT showed increased anxiety sensitivity. The same study also identified an influence of rs324981 on the effect of childhood maltreatment and recent life events on anxiety sensitivity (Klauke et al., Citation2014). Studies that used anxiety-related fMRI paradigms showed an association between rs324981 and brain activation changes in the rostral dorsomedial prefrontal cortex (Raczka et al., Citation2010), the dorsolateral prefrontal, lateral orbitofrontal and anterior cingulate cortex (Domschke et al., Citation2011) and the right amygdala (Dannlowski et al., Citation2011). Recently, Kumsta et al. (Citation2013) found an association between rs329481 T and increased salivary cortisol as well as with subjective stress responses to the Trier Social Stress Test for Groups.
In the present study we investigated the association between rs324981 and neural responses to acute stress. Moreover, we analyzed the gene × environment interaction of rs324981 with current and early urbanicity on neural responses. Heart rate, plasma adrenocorticotropic hormone (ACTH) and salivary cortisol were measured to assess peripheral stress responses.
Methods
Sample
Participants were recruited via flyers and the email system of the universities of Mannheim and Heidelberg as part of a study investigating gene-environment interactions in schizophrenia (EU-GEI). On the first contact, a screening interview was carried out on the phone. Exclusion criteria comprised current presence or lifetime history of significant general medical, psychiatric, or neurological illness, psychotropic pharmacological treatment, head trauma, incompatibility with fMRI scanning (metal parts or other health risks) and left-handedness. To ensure a genetically homogeneous sample, only participants with German grandparents were included. We only recruited participants who previously underwent MR scanning to reduce the risk of a stress reaction caused by the novelty of the MR environment. The study was approved by the ethics committee of the University of Heidelberg and written informed consent was obtained from all participants. The volunteers received a small monetary compensation for study participation. The present sample is a subgroup of a previous cohort (Lederbogen et al., Citation2011) and we included all subjects who from the outset were collected for genetic analyses. DNA samples were only available from these subjects. In total, 22 men and 20 women of German descent between 20 and 43 years (mean = 28.0) were included.
Neuroimaging stress paradigm
The ScanSTRESS paradigm was developed by our group to induce social stress in the fMRI environment. The social stress induction includes several crucial components such as pressure to perform, time pressure, forced failure, social-evaluative threat, uncontrollability and unpredictability. Subjects receive the instruction that the aim of the study is the investigation of brain activation correlating maximal individual mental performance and therefore it is of crucial importance that they show maximal effort.
The ScanSTRESS paradigm was implemented in Presentation® software (Version 12.9, www.neurobs.com). It consists of two different tasks presented to the participant via a monitor. In the first task participants have to match a three-dimensional figure to its rotated form from three options presented below the target figure (source of stimulus material: Peters & Battista, Citation2008). In the second task, participants have to continuously subtract the number 13 from a 4 digit number, analogous to the subtraction task implemented in the Trier Social Stress Test (TSST) (Kirschbaum et al., Citation1993). They have to choose the correct answer out of four presented numbers (). In case of an error, participants have to start again from the beginning. In both tasks answers are given with a 4 button response box (Current Design, Philadelphia, PA), with the layout of the answer options corresponding to the diamond-shaped layout of the keys.
Figure 1. Screenshot of the two different tasks, mental rotation (a) and subtraction task (b), presented in the performance phase of the stress paradigm and (c) the design of the ScanSTRESS paradigm with two runs, preceded by an instruction phase and interrupted by critical verbal feedback given by one panel member to the participant.
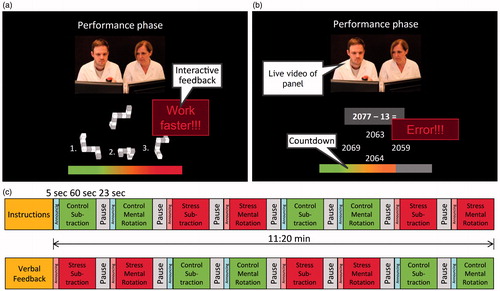
The paradigm uses a block design (two runs of 680 seconds duration each) with repeated 60 seconds task (or control) blocks preceded by 5 seconds task announcement and followed by 20 seconds rest period. The paradigm consists of 16 epochs of 60 seconds each with alternating stress performance and control blocks presented in two runs (). In the task blocks, the subject has to respond under time pressure, which is visualized by a countdown timer, signaling the remaining time. Both task speed and difficulty are adapted to the individual’s performance by the software, thus ensuring frequent failure. In the control conditions, participants performed a less demanding task without time pressure (number matching without subtraction, figure matching without rotation). The number of trials in control and stress blocks is matched.
Before entering the scanner room, subjects are introduced by the experimenter to an observer panel consisting of one female and one male researcher in professional attire, sitting in the control room. The participants are informed that their behavior, mimics and answers will be monitored by the panel, which will be able to see a live video transmission of their faces. A mock-camera is installed on the head-coil for that purpose. A live video transmission of the panel is presented to the participant during the scanning procedure to induce social-evaluative threat ().
After immersion into the scanner tube and subsequent pre-measurements (e.g. localizer) and right before starting the paradigm, the tasks and the role of the panel are introduced to the participant (via the scanner’s audio system and video transmission) by one member of the panel. During the task blocks they explicitly watch the monitors and give disapproving visual feedback after wrong or slow answers of the subject. This is done by pressing the button on a “buzzer” visible to the subject on the video transmission. Depending on the button pressed, either a message indicating an error (“Error!”) or a message asking the subject to work faster (“Work faster!”) is displayed on top of the answer options. In the control blocks, the panel members remain passive and do not look into the camera. The video picture is overlaid by a grey diagonal cross to signal that the subject is not monitored. No feedback is given to the subject in control blocks. Between the two runs, one of the panel members provides the subjects with the information that her/his performance is below average and that the fMRI data will be useless, if she/he does not try harder in the next half of the experiment.
After completion of the stress induction, the study was explained in detail to the subjects in a comprehensive debriefing. Amongst others, they were informed that the disapproving feedback was part of the standard procedure and independent of individual performance. The ScanSTRESS paradigm is available on request from the corresponding author.
Experimental protocol
Participants reported to the laboratory twice, first for an appointment of 45 minutes (detailed information on study, exclusion criteria check) and then for a second session of 2.5 hours, which included the ScanSTRESS paradigm.
Heart rate
During fMRI scanning, heart rate recordings were obtained with a MRI compatible finger oxiometer with a sampling rate of 50 Hz. For each subject, the average heart rate was computed for the control blocks and the stress blocks for each run. The difference between both values was used to quantify stress-induced heart rate increase.
Saliva and blood sampling
In all 42 participants, eight saliva samples were obtained using Salivette® sampling devices (Sarstedt, Nuembrecht, Germany): 45, 22 and 10 minutes before and 35, 45, 60, 75 and 90 minutes after onset of the stress induction (see Supplementary Figure 1). Time point 0 was defined as the beginning of the introduction given by the expert panel directly prior to the first run. The sample at time point −10 was collected immediately before immersion of the participant into the scanner tube (around time point −7), while the sample at time point +35 was collected immediately after leaving the scanner tube. Those samples were placed in the participants’ mouth and taken after two minutes by the experimenter with a glove, to minimize head movement. Saliva was not sampled between the two runs to avoid excessive head movement that could severely reduce the quality of fMRI data. In addition, nine blood samples were collected before (time points −45 and −22), during (time points −1.5, +13.5 and +27.5) and after the scanning procedure (time points +45, +60, +75 and +90; see Supplementary Figure 1). For that purpose a catheter was placed in a forearm vein of the left non-dominant arm (at minute −48). To allow blood drawing in the scanner without moving the bench, all blood samples were drawn through a 3-way stopcock connected to a 100 cm long intravenous line (volume 4 ml). For every blood drawing, the first 10 ml were discarded before a 2.7 ml EDTA blood vial was filled. To keep the line and the catheter patent, the 3-way stopcock was connected to a slow drip of physiological saline solution. At the end of each blood draw, a bolus of 10 ml was slowly flushed through the tube to clear the line. We waived all blood samples that could not be drawn within 90 seconds in order to adhere to our strict time schedule. For that reason, we stopped sampling in 7 subjects. In another 13 of the 42 subjects we failed to collect blood samples for logistical reasons. Therefore, complete blood sample data were available in a subsample of 22 participants (10 females). The total test duration was not different in subjects with and without complete blood sample data.
Blood samples were immediately stored on ice and centrifuged within 10 minutes at 200 g and 4 °C for 10 minutes. EDTA plasma was divided into aliquots and stored at −80 °C until analysis. Saliva samples were kept at room temperature throughout the test session and then stored at −20 °C. After thawing for biochemical analysis, samples were centrifuged at 2000 g at 10 °C for 10 minutes. Plasma ACTH concentrations were determined by an ELISA assay according to the manufacturer’s protocol (Biomerica Inc., Irvine, CA). The assay sensitivity was 0.22 pg/ml. Intra- and inter-assay variabilities were below 6.0% and 7.0%, respectively. Salivary cortisol concentrations were determined by a time resolved immunoassay with fluorescence detection (DELFIA) described elsewhere (Dressendörfer et al., Citation1992). The assay sensitivity was 0.173 nmol/l. Intra- and inter-assay variabilities were less than 6.7% and 9.0%, respectively.
DNA-extraction and genotyping
Genomic DNA was extracted from EDTA blood according to standard procedures. The single nucleotide polymorphism rs324981 was genotyped on an Applied Biosystems 7900HT Fast Real-Time PCR System, using a TaqMan 5′ nuclease assay (TaqMan® SNP Genotyping Assay ID C___2959781_10; Applied Biosystems, Life Technologies, Darmstadt, Germany). Alleles designated A (detected by the VIC labelled probe; AAU = Asparagine/Asn according to the standard RNA genetic code) and T (detected by the FAM labelled probe; AUU = Isoleucine/Ile according to the standard RNA genetic code) were detected in the sequence context of CTGGTCAACATCTTGACAGATATTA[A/T]TTGGCGATTCACTGGAGACTTCACG. Genotyping accuracy was assessed by running 15% of the sample in duplicates. Reproducibility was 100%.
Urbanicity score and socioeconomic variables
Participants provided detailed information on their current place of living, place of birth and living environment of the first 15 years of their lives. Urbanicity for the respective time points was scored by classifying the municipality the subject was living in at the respective time point into 3 different categories: city (3 = more than 100,000 inhabitants), town (2 = between 10,000 and 100,000 inhabitants) and rural area (1 = less than 10,000 inhabitants). Early urbanicity scores were calculated as described previously (Lederbogen et al., Citation2011; Pedersen & Mortensen, Citation2001) by multiplying the years spent in each area until age 15 by the category’s score. When participants had moved from one category to another, we added up the scores from the different categories. This resulted in scores between 15 (15 years upbringing in rural areas) and 45 (15 years upbringing in a city with a population bigger than 100,000). For repeated measures models investigating the effects of urban upbringing, we categorized the participants into three groups representing the environment they mainly grew up in (urbanicity score 15–22 = low urbanicity, 23–37 = middle urbanicity, 38–45 = high urbanicity). In addition, the participants’ years of school education and the formal school education of their parents (no degree, secondary general school certificate (“Hauptschulabschluss”), secondary modern school certificate (“Realschulabschluss”), university-entrance diploma (“Abitur”)) have been assessed.
Image acquisition and analysis
The experiment was carried out on a 3.0 Tesla MRI scanner (Siemens Trio, Erlangen, Germany) scanner. Blood-oxygen-level-dependent (BOLD) fMRI was performed using a gradient-echo echo planar imaging (EPI) sequence (repetition time (TR) = 2000 ms, echo time (TE) = 30 ms, flip angle = 80°, 64 × 64 matrix, 192 mm field of view, 32 3 mm axial slices with 1 mm gap). To minimize T1 equilibration effects the first 4 scans were discarded. Images were preprocessed and analyzed using SPM8 (www.fil.ion.ucl.ac.uk/spm). Images were realigned to the first functional scan by a 6-parameter rigid body transformation, then spatially normalized to the standard Montreal Neurological Institute (MNI) template including resampling into 3 × 3 × 3 mm3 voxels and smoothed with a 9 mm full-width at half-maximum (FWHM) Gaussian filter. For each subject, one general linear model was defined containing regressors for control and social stress conditions and the respective announcement phases for each measurement sequence leading to a sum of 12 condition repressors. Six motion regressors were included to account for motion artifacts which were not fully corrected by realignment. Contrast images of social stress versus control condition were computed for each subject and analyzed in one-sample t-tests to check for effects of conditions. To study the effects in neuroimaging, we used the general linear model. We carried out multiple regression analyses with the contrast images of the social stress > control contrast and urbanicity scores or number of alleles score as covariate of interest. The interaction between genotype and early or current urbanicity was calculated by adding the product of the centralized variables as a covariate of interest while retaining urbanicity and genotype as covariates of no interest in the model. The participants’ years of education were included as a nuisance covariate in the neuroimaging regression models.
Imaging results were corrected via family-wise error (FWE) for multiple comparisons at a significance level of p < 0.05. For the main task effects (stress > control, control > stress) correction was performed over the whole brain and peak voxels are reported separately for anatomical volumes of interest (AVOI) as defined by Tzourio-Mazoyer et al. (Citation2002) (see Supplement material Tables 1 and 2). Effects of rs324981 and the interaction of early and current urbanicity effects with rs324981 were FWE-corrected for multiple comparisons within two a priori defined anatomical regions of interest (ROI) using masks from the Harvard Oxford Atlas http://www.cma.mgh.harvard.edu) as reported previously (Lederbogen et al., Citation2011): the rostral ACC (including BA 24 a-c, BA25, BA 32 and BA 33) as defined by Bush et al. (Citation2000) and the right amygdala. Effects outside of these ROIs are reported if they reached significance after FWE whole-brain correction.
Analysis of demographic, heart rate and endocrine data
Descriptive and endocrine data analysis was performed using the SPSS software (Statistics for Windows, Version 20.0. IBM Corp., Armonk, NY). Chi-square tests and analyses of variance were performed to test differences in scores and frequencies between genotype groups. Independent t-tests were used for post-hoc comparisons. Group differences in ACTH and salivary cortisol outcome measures were analyzed with ANOVA models for repeated measurements. Greenhouse-Geisser corrections were applied where appropriate, and only adjusted results are reported.
Results
Manipulation check: heart rate, ACTH and cortisol stress responses
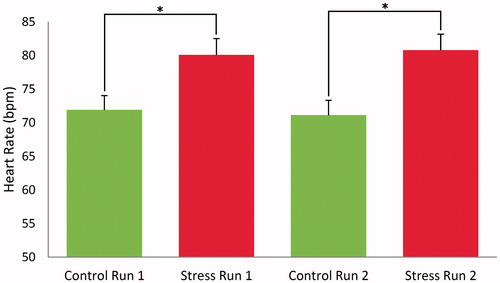
In the first part of the statistical analysis, we tested whether the ScanSTRESS paradigm induced significant cardiovascular and endocrine stress responses. As shown in , mean heart rates were significantly higher in stress blocks than in control blocks (F1, 31 = 78.17, p < 0.001). The average heart rate difference between conditions was 8.98 bpm. Post-hoc comparisons confirmed that the stress versus control block difference was significant for both runs (run 1: t31 = 7.559, p < 0.001; run 2: t31 = 8.650, p < 0.001). All 32 participants with complete heart rate data showed increased heart rates during the stress conditions compared to control blocks. This effect did not differ between the two runs (main effect run: F1, 31 = 0.22, p = 0.64; interaction stress × run: F1, 31 = 0.822, p = 0.37).
Figure 2. Mean (±SEM) heart rate (in beats per minute) responses to the ScanSTRESS paradigm. Asterisks indicate significant differences between two conditions (p < 0.001, independent t-tests for post-hoc comparison).
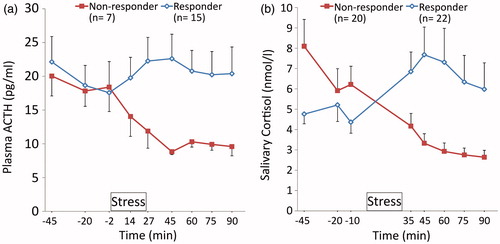
The majority of subjects showed, in part rather pronounced, decrease of ACTH and salivary cortisol levels over the three pre-stress measurements (main effect time: F1.57, 39.30 = 6.79, p = 0.005 for ACTH and F1.61, 65.85 = 5.07, p = 0.014 for cortisol), suggesting a considerable HPA axis anticipation response in several subjects. When the entire sample was included, neither for ACTH nor for salivary cortisol a significant mean increase was observed (main effect time: F3.03, 63.61 = 1.14, p = 0.34 (ACTH); F1.58, 64.84 = 1.98, p = 0.16 (cortisol)). Nevertheless, 15 of 22 subjects with complete blood sample data showed an ACTH rise after stress () and for 22 of 42 subjects a salivary cortisol increase was detected (). Participants were categorized as responders when they showed an absolute hormone level increase (>0) between the last pre-stress measurement and any of the following three measurements (ACTH: +13.5, +27.5, +45; Cortisol +35, +45, +60). As expected, this classification resulted in significant group differences: ACTH responders showed a significantly higher rise than non-responders (responder × time effect: F3.16, 63.20 = 4.34, p < 0.01, ) and cortisol responders showed a significantly higher response than cortisol non-responders (responder × time effect: F1.83, 73.51 = 16.46, p < 0.001, ). Moreover, 12 out of 15 ACTH responders were also cortisol responders and cortisol responders showed significantly higher mean heart rate differences between control and stress blocks (mean delta = 11.51 bpm) than non-responders (mean delta = 6.47 bpm) (responder × time effect: F1,30 = 7.45, p = 0.011).
Figure 3. Mean (±SEM) plasma ACTH (a) and salivary cortisol (b) responses to the ScanSTRESS paradigm in responders and non-responders.
Genotypes
Of the 42 participants, 9 were homozygous for the A allele, 21 were heterozygous and 12 homozygous for the T allele. The obtained allele frequencies did not deviate from Hardy–Weinberg equilibrium (HWE; p = 0.97). There was no difference between the three genotype groups with respect to age (p = 0.79), sex (p = 0.11), current urbanicity (p = 0.31), urban upbringing (p = 0.62) and years of education (p = 0.22).
Urbanicity and socioeconomic background
Early urbanicity scores ranged from 15 (first 15 years spent in rural environment) to 45 (first 15 years spent in urban environment; Mean of 29.25). Early urbanicity scores did not correlate significantly with age (p = 0.95) or years of education of the participant (p = 0.30) and were not significantly associated with the education of the mother (p = 0.31) or the father (p = 0.20).
The analysis of the current urbanicity status showed that 6 subjects currently lived in a rural environment, 12 subjects lived in a small city, and 24 subjects lived in a bigger city. Current urbanicity groups did not differ significantly in age (p = 0.90), early urbanicity score (p = 0.81), numbers of relocations in the first 15 life years, and education of the mother (p = 0.77) or the father (p = 0.97). There was a trend for a difference in years of education (p = 0.078) with participants currently living in a town (10,000–100,000 inhabitants) showing marginally less years of education (M = 12.42) than both the urban (M = 12.96) and the rural group (M = 12.67).
Neural substrates of the stress response and associations with NPSR1 rs324981
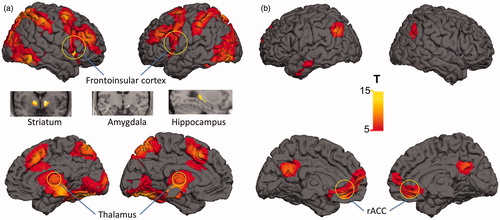
Under psychosocial stress a distributed network of activations and deactivations was observed including activations in ventral striatum, thalamus, frontoinsular cortex, hippocampus and amygdala and deactivations in rACC (all p < 0.05, whole-brain FWE corrected, see ; a detailed list can be found in Supplementary Tables 1 and 2). Early urbanicity was significantly correlated with ACC activity (r = 0.34, p = 0.034) and current urbanicity with right amygdala activity (r = 0.35, p = 0.022), as reported previously (Lederbogen et al., Citation2011).
Figure 4. Main effect of social stress induction: activation (a) and deactivation (b). The functional maps are thresholded at a significance threshold of p < 0.05 FWE corrected for multiple comparisons across the whole brain. Neural response included activations in ventral striatum, thalamus, frontoinsular cortex, hippocampus and amygdala and deactivations in rACC (all p < 0.05, whole-brain FWE corrected); FWE = family-wise error corrected for multiple comparisons.
There was no significant main effect of NPSR1 rs324981 on activation patterns in the ROIs defined for the amygdala or the ACC. However, rs324981 modulated the stress response in a cluster in the right cerebellum (x = 42, y = −49, z = −39, p = 0.004; T = 6.1, whole-brain FWE corrected). Subjects homozygous for the T allele showed the strongest activation while subjects homozygous for the A allele showed the lowest activation.
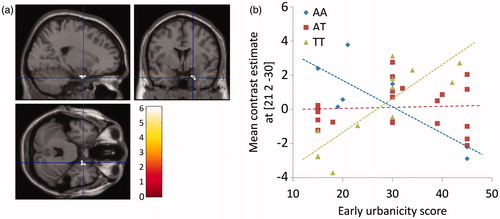
While we did not detect a genetic main effect in our predefined ROIs, we did find evidence for a gene × environment interaction in our sample. rs324981 significantly modulated the effect of urban upbringing on activation within the ROI amygdala mask (x = 21, y = 2, z = −30, p < 0.001, T = 6.03, FWE corrected within ROI; ), which even yielded a significant result on the whole-brain level (p = 0.005, whole-brain FWE corrected). While in subjects with the genotype rs324981 TT, amygdala activity under stress was positively associated with the early urbanicity score, and a negative association between neural activity and early urbanicity was observed in subjects with the genotype AA (). In subjects with the heterozygous genotype AT, no substantial association between early urbanicity and amygdala activity could be detected. To control for a possible influence of sex, we added sex as a covariate of no interest to our model. This did not substantially alter the interaction results (p < 0.001, T = 6.19, FWE corrected within ROI). In a supplementary analysis, we investigated if the observed gene × environment interaction is substantially driven by outliers. Therefore, two subjects whose activation in the peak voxel slightly exceeded two standard deviations from the group average were excluded. The effect remained significant after this step (p < 0.001, T = 5.48, whole-brain FWE corrected).
Figure 5. Interaction of early life (birth until age 15) urbanicity scores and genotype of NPSR1 polymorphism rs324981 on amygdala activation under acute psychosocial stress (a and b). (a) T-map of significant correlations between activations in the stress > control contrast with the interaction term for the urban upbringing score and the genotype for rs324981 displayed at a threshold of p < 0.05 FWE whole-brain corrected. (b) Scatterplot of the correlation between the urban upbringing score and the most significant correlated voxel in the right amygdala (located at x = 21, y = 2, z = −30) for the interaction term in the stress > control contrast depicted separately for the three genotype groups of rs324981; FWE = family-wise error corrected for multiple comparisons.
In the peak voxel for this gene × environment interaction, mean activations were significantly higher in cortisol responders compared to non-responders (t40 = 2.20, p = 0.033). We did not observe any significant gene × environment interaction effects in the defined ROIs when we analyzed the interaction of current urbanicity with rs324981 on stress activation.
In an exploratory analysis, neither cortisol nor ACTH responses were significantly associated with rs324981 (main effects genotype, interactions genotype × time: all F < 0.82, all p > 0.47). We did not find evidence for a gene × environment interaction effect on endocrine responses in our sample (interactions genotype × early/current urbanicity, interactions genotype × early/current urbanicity × time: all F < 0.80, all p > 0.59). Consistently, genotype frequencies did not differ significantly between responders and non-responders both for ACTH and salivary cortisol (all < 0.45, p > 0.80).
Discussion
This study provides first evidence for an influence of NPSR1 variant rs324981 on brain activation during acute stress. Previously, we have linked early and current urbanicity to ACC and amygdala stress processing (Lederbogen et al., Citation2011). Now, we found that the environmental risk factor “early urbanicity” interacts with rs324981 constituting a gene × environment interaction effect on the amygdala stress response. It has repeatedly been shown that variation in genes influencing physiological systems involved in stress-related disorders, as the HPA axis (Polanczyk et al., Citation2009) or the serotonergic system (Caspi et al., Citation2003), can modulate the impact of environmental risk factors. In animals, NPS shows strong anxiolytic effects and increases arousal at the same time (Xu et al., Citation2004). NPS induces HPA axis activation in rats (Reinscheid, Citation2008; Smith et al., Citation2006) and in turn, brainstem NPS neurons are activated by CRH, resulting in NPS release in areas including the amygdala (Jüngling et al., Citation2012). NPS injected into the amygdala prevented both anxiety-like behaviour and enhanced conditioned fear responses after stress (Chauveau et al., Citation2012).
The psychological components of a stressful situation, including novelty, uncontrollability, unpredictability and ego-involvement (Dickerson & Kemeny, Citation2004) are closely related to anxiety. The main finding of our study is an interaction of rs324981 with early urbanicity on right amygdala activation under stress. In subjects homozygous for the T allele, higher early urbanicity scores were associated with increased amygdala activity, while AA subjects showed an association in the opposite direction. While we previously found an effect of current urbanicity on amygdala activity under stress (Lederbogen et al., Citation2011), the present finding suggests that amygdala stress responses, via a gene × environment interaction, are also influenced by urban upbringing. The absence of a main effect of urban upbringing on amygdala activity is not inconsistent with this observation. As genetic variation is already operative at the early life phase that urban upbringing indexes, it appears plausible that an effect of an environmental factor on amygdala stress processing can depend on the genetic background. Furthermore, NPS expression profiles predict effects in subcortical structures, notably in the amygdala. Assuming that growing up in a city constitutes on average a more stressful environment, our results are consistent with the results of Klauke et al. (Citation2014) who reported highest anxiety sensitivity in subjects homozygous for the T allele, who were exposed to childhood maltreatment or recent stressful life events. Anxiety sensitivity is considered an intermediate phenotype of anxiety disorders, which are also associated with amygdala reactivity (Holzschneider & Mulert, Citation2011). A stress-induced NPS release within the amygdala was shown in animals, identifying the amygdala as a target of the NPS pathway (Ebner et al., Citation2011). Moreover, amygdala functioning was shown to be modulated by genetic variation (Munafo et al., Citation2008) as well as early and current environment (Taylor et al., Citation2006; Zink et al., Citation2008). In healthy subjects, rs324981 T was positively associated with harm avoidance and right amygdala responses to fear-relevant faces (Dannlowski et al., Citation2011). In anxiety disorder and major depression patients, amygdala hyperactivity was reported.
The more active T allele that mediates enhanced NPS signaling was previously associated with increased amygdala activity (Dannlowski et al., Citation2011) and a higher cortisol stress response (Kumsta et al., Citation2013), as well as with panic disorder and anxiety (Domschke et al., Citation2011). Consistently, in our study right amygdala responses were increased in subjects who also showed cortisol stress responses. It can be speculated that the arousal-increasing effects of NPS observed in animals might be more relevant for the reported phenotypes in humans than its anxiolytic effects. Furthermore, genetic variations exert their effects during different stages of neurodevelopment. Regarding the current study, the operationalization of early urbanicity comprised the first 15 years of life. The individual NPSR1 genotype might interact with environmental factors during sensible phases in childhood, shaping later neurophysiological stress reactivity.
We also observed genotype-dependent activation differences in the cerebellum. Independent of genotype and consistent with previous reports (Gianaros et al., Citation2007), the cerebellum was activated under stress (see Supplementary Table 1) possibly due to its role in cognitive and affective processing (Strick et al., Citation2009). Therefore, the modulation of cerebellum activity by NPSR1 genotype should be followed in future studies.
The observed associations between NPSR1 genotype and neural stress responses were not paralleled by associations between genotype and endocrine responses in our sample, possibly reflecting greater sensitivity of neural measures compared to peripheral markers. The association with HPA axis measures can better be studied in larger samples exposed to stress protocols applicable outside the scanner, e.g. the TSST. The moderate sample size and its limited statistical power are major limitations of the present study. Consequently, we decided to test only a single sequence variant and regions of interest defined a priori. Due to the small sample size, all findings on genotype-phenotype associations can only be regarded as preliminary. Still, it appears remarkable that the significant effects are rather pronounced and reach significance on the whole-brain level. In a recent review paper (Duncan & Keller, Citation2011) the robustness of the majority of gene × environment findings in psychiatry has been challenged. Although this fundamental scepticism is not shared by all authors (Caspi et al., Citation2010; Dick, Citation2011), a replication of our finding in a larger sample would be valuable. Nevertheless, some features of our study may at least partly counterbalance these limitations. First, we used an experimental design and a promising intermediate phenotype approach. Central stress regulation represents a phenotype sensitive to genetic and environmental factors that might increase disease vulnerability. Intermediate phenotypes were shown to be a valuable tool to target brain mechanisms of psychopathology even in limited samples (Mier et al., Citation2010). Moreover, our main effect was not driven by statistical outliers. The exclusion of two participants with the most deviating neural activation in the peak voxel did not significantly alter our results. As only one variant was studied we are not able to estimate the overall size of the genetic effect of NPSR1 on our phenotypes. Still, considering the functional characteristics of rs324981 we speculate that differences in NPS-induced signaling modulate the link between environmental factors and stress processing in the amygdala.
Urbanicity is a broad concept that is influenced by several factors, particularly by variables related to socioeconomic status. However, urbanicity was shown to predict the risk for stress-related psychopathology, especially schizophrenia (Pedersen & Mortensen, Citation2001; van Os et al., Citation2004). Epidemiological studies reported urbanicity effects independent of socioeconomic factors and selective migration (Krabbendam & van Os, Citation2005). In accordance with these findings, our results maintained stable when the educational level of our participants was controlled for.
The newly developed ScanSTRESS paradigm proved to be a useful tool. Previous findings on neural correlates of urbanicity with this paradigm were consistent with those obtained with the established Montreal Imaging Stress (MIST, Dedovic et al., Citation2005) in an independent sample (Lederbogen et al., Citation2011). ScanSTRESS elicited solid effects on brain activity and heart rate, with all subjects showing heart rate responses. Although the majority of the participants showed ACTH and cortisol rises, mean responses across all subjects were not statistically significant in the present sample. On the one hand, this reflects the well-known interindividual variability in HPA axis stress responses (Kudielka et al., Citation2009). Moreover, a weak or absent cortisol response does not preclude a preceding robust central stress response. On the other hand, HPA axis responses to a stress paradigm are an important and conservative validation criterion and we thus consider the modest endocrine responses another limitation of our study. We cannot rule out that the more distant subject-panel-interaction in the scanner reduced stress intensity to a certain degree. However, one could also assume that some components of the situation are more stressful than in protocols performed outside the scanner, e.g. the scanning procedure itself, the (mock) camera, etc. We speculate that the modest endocrine responses – that also occurred in fMRI studies which used the MIST (Pruessner et al., Citation2008) – can at least partly be explained by HPA axis anticipation effects (and consequently lower responses to the paradigm) related to the upcoming MRI procedure and the necessary technical preparations prior to scanning. To minimize this expected effect, we only studied scanner-experienced subjects but still relatively high endocrine pre-stress levels were observed in several subjects, consistent with previous reports (Muehlhan et al., Citation2011). Moreover, we most likely missed cortisol response peaks in some subjects due to a 45-minutes interval in which no saliva samples were collected to prevent head movements during scanning.
In summary, our findings suggest a modulation of the neural stress response in the right amygdala by genetic variation in NPSR1 in interaction with early urbanicity. This result is consistent with earlier findings indicating a gene × environment interaction of the same variant with early adversity on anxiety sensitivity. Our results support the view that the NPS system modulates stress responses and contributes to individual risk susceptibility for psychiatric disorders.
Declaration of interest
The authors report no conflicts of interest. The research leading to these results has received funding from German Research Foundation (Deutsche Forschungsgemeinschaft; GRK 1389/1; SFB 636-Z4) to M.R. and S.W., and from the European Community’s Seventh Framework Programme under grant agreement No. HEALTH-F2-2010-241909 (Project EU-GEI), German Research Foundation (Deutsche Forschungsgemeinschaft SFB 636-B7) and Federal Ministry of Education and Research (MooDS) to A.M.L. EU-GEI is the acronym of the project’ European network of National Schizophrenia Networks Studying Gene-Environment Interactions”.
Supplementary Material
Download PDF (102.8 KB)References
- Bush G, Luu P, Posner MI. (2000). Cognitive and emotional influences in anterior cingulate cortex. Trends Cogn Sci 4(6):215–22
- Cardno AG, Gottesman II. (2000). Twin studies of schizophrenia: from bow-and-arrow concordances to star wars Mx and functional genomics. Am J Med Genet 97(1):12–17
- Caspi A, Hariri AR, Holmes A, Uher R, Moffitt TE. (2010). Genetic sensitivity to the environment: the case of the serotonin transporter gene and its implications for studying complex diseases and traits. Am J Psychiatry 167(5):509–27
- Caspi A, Sugden K, Moffitt TE, Taylor A, Craig IW, Harrington H, Mcclay J, Mill J, et al. (2003). Influence of life stress on depression: moderation by a polymorphism in the 5-HTT gene. Science 301(5631):386–9
- Chauveau F, Lange MD, Jungling K, Lesting J, Seidenbecher T, Pape HC. (2012). Prevention of stress-impaired fear extinction through neuropeptide S action in the lateral amygdala. Neuropsychopharmacology 37(7):1588–99
- Chrousos GP. (2009). Stress and disorders of the stress system. Nat Rev Endocrinol 5(7):374–81
- Clark SD, Duangdao DM, Schulz S, Zhang L, Liu X, Xu YL, Reinscheid RK. (2011). Anatomical characterization of the neuropeptide S system in the mouse brain by in situ hybridization and immunohistochemistry. J Comp Neurol 519(10):1867–93
- Dannlowski U, Kugel H, Franke F, Stuhrmann A, Hohoff C, Zwanzger P, Lenzen T, et al. (2011). Neuropeptide-S (NPS) receptor genotype modulates basolateral amygdala responsiveness to aversive stimuli. Neuropsychopharmacology 36(9):1879–85
- Dedovic K, Renwick R, Mahani NK, Engert V, Lupien SJ, Pruessner JC. (2005). The Montreal Imaging Stress Task: using functional imaging to investigate the effects of perceiving and processing psychosocial stress in the human brain. J Psychiatry Neurosci 30(5):319–25
- Dick DM. (2011). Gene-environment interaction in psychological traits and disorders. Annu Rev Clin Psychol 7:383–409
- Dickerson SS, Kemeny ME. (2004). Acute stressors and cortisol responses: a theoretical integration and synthesis of laboratory research. Psychol Bull 130(3):355–91
- Domschke K, Reif A, Weber H, Richter J, Hohoff C, Ohrmann P, Pedersen A, et al. (2011). Neuropeptide S receptor gene – converging evidence for a role in panic disorder. Mol Psychiatry 16(9):938–48
- Dressendörfer RA, Kirschbaum C, Rohde W, Stahl F, Strasburger CJ. (1992). Synthesis of a cortisol-biotin conjugate and evaluation as a tracer in an immunoassay for salivary cortisol measurement. J Steroid Biochem Mol Biol 43(7):683–92
- Duncan LE, Keller MC. (2011). A critical review of the first 10 years of candidate gene-by-environment interaction research in psychiatry. Am J Psychiatry 168(10):1041–9
- Ebner K, Rjabokon A, Pape HC, Singewald N. (2011). Increased in vivo release of neuropeptide S in the amygdala of freely moving rats after local depolarisation and emotional stress. Amino Acids 41(4):991–6
- Federenko IS, Nagamine M, Hellhammer DH, Wadhwa PD, Wüst S. (2004). The heritability of hypothalamus pituitary adrenal axis responses to psychosocial stress is context dependent. J Clin Endocrinol Metab 89(12):6244–50
- Gianaros PJ, Jennings JR, Sheu LK, Derbyshire SW, Matthews KA. (2007). Heightened functional neural activation to psychological stress covaries with exaggerated blood pressure reactivity. Hypertension 49(1):134–40
- Holzschneider K, Mulert C. (2011). Neuroimaging in anxiety disorders. Dialogues Clin Neurosci 13(4):453–61
- Jüngling K, Liu X, Lesting J, Coulon P, Sosulina L, Reinscheid RK, Pape HC. (2012). Activation of neuropeptide S-expressing neurons in the locus coeruleus by corticotropin-releasing factor. J Physiol 590(Pt 16):3701–17
- Kendler KS, Gardner CO, Lichtenstein P. (2008). A developmental twin study of symptoms of anxiety and depression: evidence for genetic innovation and attenuation. Psychol Med 38(11):1567–75
- Kirschbaum C, Pirke KM, Hellhammer DH. (1993). The ‘Trier Social Stress Test' – a tool for investigating psychobiological stress responses in a laboratory setting. Neuropsychobiology 28(1-2):76–81
- Klauke B, Deckert J, Zwanzger P, Baumann C, Arolt V, Pauli P, Reif A, Domschke K. (2014). Neuropeptide S receptor gene (NPSR) and life events: G × E effects on anxiety sensitivity and its subdimensions. World J Biol Psychiatry 15(1):17–25
- Krabbendam L, Van Os J. (2005). Schizophrenia and urbanicity: a major environmental influence – conditional on genetic risk. Schizophr Bull 31(4):795–9
- Kudielka BM, Hellhammer DH, Wüst S. (2009). Why do we respond so differently? Reviewing determinants of human salivary cortisol responses to challenge. Psychoneuroendocrinology 34(1):2–18
- Kumsta R, Chen FS, Pape HC, Heinrichs M. (2013). Neuropeptide S receptor gene is associated with cortisol responses to social stress in humans. Biol Psychol 93(2):304–7
- Lederbogen F, Kirsch P, Haddad L, Streit F, Tost H, Schuch P, Wüst S, et al. (2011). City living and urban upbringing affect neural social stress processing in humans. Nature 474(7352):498–501
- Leonard SK, Ring RH. (2011). Immunohistochemical localization of the neuropeptide S receptor in the rat central nervous system. Neuroscience 172:153–63
- Mier D, Kirsch P, Meyer-Lindenberg A. (2010). Neural substrates of pleiotropic action of genetic variation in COMT: a meta-analysis. Mol Psychiatry 15(9):918–27
- Monk CS. (2008). The development of emotion-related neural circuitry in health and psychopathology. Dev Psychopathol 20(4):1231–50
- Muehlhan M, Lueken U, Wittchen HU, Kirschbaum C. (2011). The scanner as a stressor: evidence from subjective and neuroendocrine stress parameters in the time course of a functional magnetic resonance imaging session. Int J Psychophysiol 79(2):118–26
- Munafo MR, Brown SM, Hariri AR. (2008). Serotonin transporter (5-HTTLPR) genotype and amygdala activation: a meta-analysis. Biol Psychiat 63(9):852–7
- Okamura N, Hashimoto K, Iyo M, Shimizu E, Dempfle A, Friedel S. (2007). Gender-specific association of a functional coding polymorphism in the neuropeptide S receptor gene with panic disorder but not with schizophrenia or attention-deficit/hyperactivity disorder. Prog Neuropsychopharmacol Biol Psychiatry 31:1444–8
- Pedersen CB, Mortensen PB. (2001). Evidence of a dose-response relationship between urbanicity during upbringing and schizophrenia risk. Arch Gen Psychiatry 58(11):1039–46
- Peen J, Schoevers RA, Beekman AT, Dekker J. (2010). The current status of urban-rural differences in psychiatric disorders. Acta Psychiatr Scand 121(2):84–93
- Peters M, Battista C. (2008). Applications of mental rotation figures of the Shepard and Metzler type and description of a mental rotation stimulus library. Brain Cogn 66(3):260–4
- Polanczyk G, Caspi A, Williams B, Price TS, Danese A, Sugden K, et al. (2009). Protective effect of CRHR1 gene variants on the development of adult depression following childhood maltreatment: replication and extension. Arch Gen Psychiatry 66(9):978–85
- Pruessner JC, Dedovic K, Khalili-Mahani N, Engert V, Pruessner M, Buss C, Renwick R, et al. (2008). Deactivation of the limbic system during acute psychosocial stress: evidence from positron emission tomography and functional magnetic resonance imaging studies. Biol Psychiatry 63(2):234–40
- Raczka KA, Gartmann N, Mechias ML, Reif A, Buchel C, Deckert J, Kalisch R. (2010). A neuropeptide S receptor variant associated with overinterpretation of fear reactions: a potential neurogenetic basis for catastrophizing. Mol Psychiatry 15(11):67–74
- Radua J, Borgwardt S, Crescini A, Mataix-Cols D, Meyer-Lindenberg A, Mcguire PK, Fusar-Poli P. (2012). Multimodal meta-analysis of structural and functional brain changes in first episode psychosis and the effects of antipsychotic medication. Neurosci Biobehav Rev 36(10):2325–33
- Reinscheid RK. (2008). Neuropeptide S: anatomy, pharmacology, genetics and physiological functions. Results Probl Cell Differ 46:145–58
- Reinscheid RK, Xu YL, Okamura N, Zeng J, Chung S, Pai R. (2005). Pharmacological characterization of human and murine neuropeptide S receptor variants. J Pharmacol Exp Ther 315:1338–45
- Smith KL, Patterson M, Dhillo WS, Patel SR, Semjonous NM, Gardiner JV, Ghatei MA, Bloom SR. (2006). Neuropeptide S stimulates the hypothalamo-pituitary-adrenal axis and inhibits food intake. Endocrinology 147(7):3510–18
- Strick PL, Dum RP, Fiez JA. (2009). Cerebellum and nonmotor function. Annu Rev Neurosci 32:413–34
- Sullivan PF, Neale MC, Kendler KS. (2000). Genetic epidemiology of major depression: review and meta-analysis. Am J Psychiatry 157(10):1552–62
- Taylor SE, Eisenberger NI, Saxbe D, Lehman BJ, Lieberman MD. (2006). Neural responses to emotional stimuli are associated with childhood family stress. Biol Psychiatry. 60(3):296–301
- Tzourio-Mazoyer N, Landeau B, Papathanassiou D, Crivello F, Etard O, Delcroix N, Mazoyer B, Joliot M. (2002). Automated anatomical labeling of activations in SPM using a macroscopic anatomical parcellation of the MNI MRI single-subject brain. NeuroImage 15(1):273–89
- Van Os J, Pedersen CB, Mortensen PB. (2004). Confirmation of synergy between urbanicity and familial liability in the causation of psychosis. Am J Psychiatry 161(12):2312–14
- Wüst S, Federenko I, Hellhammer DH, Kirschbaum C. (2000). Genetic factors, perceived chronic stress, and the free cortisol response to awakening. Psychoneuroendocrinology 25(7):707–20
- Xu YL, Reinscheid RK, Huitron-Resendiz S, Clark SD, Wang Z, Lin SH, Brucher FA, et al. (2004). Neuropeptide S: a neuropeptide promoting arousal and anxiolytic-like effects. Neuron 43(4):487–97
- Zink CF, Tong Y, Chen Q, Bassett DS, Stein JL, Meyer-Lindenberg A. (2008). Know your place: neural processing of social hierarchy in humans. Neuron 58(2):273–83