
Abstract
Animal and human in vitro models suggest that stress-related B lymphocyte decrements are due to high levels of glucocorticoids which cause apoptosis of pre-B-cells as they emerge from the bone marrow. The present study sought to explore the relationships among distress, salivary cortisol, and human B lymphocytes in vivo. Distress (perceived stress, negative affect, depressive symptoms), lymphocyte phenotype, and salivary cortisol were assessed among first-year graduate students (n = 22) and a community control sample (n = 30) at the start of classes in the fall and the week immediately before spring preliminary exams. Compared to controls, students reported greater distress on all measures at each time point except baseline perceived stress. Hierarchical linear regression with necessary control variables was used to assess the effect of student status on the three measures of distress, the four measures of lymphocyte phenotype, and cortisol AUC and CAR over time (T1-T2). Student status was associated with a significant decrease in CD19 + B lymphocytes and flattened cortisol awakening response (CAR). Change in CAR was associated with the decrease in CD19 + B lymphocytes. Results indicated that there are significant associations among student status, flattening of CAR, and decrements in CD19 + lymphocytes.
Introduction
There is a large body of literature documenting that chronic stress can impair immune function as measured by antibody response to vaccine (Burns et al., Citation2002a,Citationb,Citationc; Cohen et al., Citation2001; Dhabhar, Citation2008; Glaser et al., Citation2000; Levi et al., Citation2011; Marsland et al., Citation2001; Webster Marketon & Glaser, Citation2008). One mechanism explaining how chronic stress down regulates immune response to vaccine may involve glucocorticoids and B lymphocytes. The immune system responds to invading pathogens with a well-orchestrated cascade of events that ultimately results in the production of antibodies by mature plasma cells of the B lymphocyte lineage (Roitt & Rabson, Citation2000). Chronic stress-related increases in glucocorticoids may impair antibody response by decreasing the number of mature B lymphocytes available to become antibody-producing cells. This may explain why one commonly investigated chronic psychological stress in humans, academic stress, has been associated with both elevated cortisol and poor antibody response in humans (Lacey et al., Citation2000; Weekes et al., Citation2006).
Chronic psychological stress results in elevated levels of glucocorticoids via activation of the hypothalamic-pituitary-adrenal (HPA) axis, (Lacey et al., Citation2000; Miller et al., Citation2007; Ng et al., Citation2003). In mouse models where implants were used to elevate blood levels of glucocorticoids to levels analogous to stress, trauma, and malnutrition, high levels of glucocorticoids were associated with 50% reduction in peripheral blood B lymphocytes (Garvy & Fraker, Citation1991) because elevated levels of glucocorticoids caused apoptosis of pre-B cells emerging from the bone marrow (Garvy et al., Citation1993). In fact, 30–70% of early pro-B, pre-B, and immature B lymphocytes were eliminated within 36 h (Laakko & Fraker, Citation2002). Human in vitro studies evaluating the effect of glucocorticoids on marrow B lymphocytes have reported early B lymphocytes (CD10 + CD19+) were highly sensitive to glucocorticoids with losses of 60–80% due to apoptosis. In contrast, mature (IgD+) B lymphocytes were fairly resistant to the induction of apoptosis by glucocorticoids (Igarashi et al., Citation2005; Lill-Elghanian et al., Citation2002).
We have previously reported dramatically low in vivo levels of CD19 + B lymphocytes associated with perceived stress among stressed graduate students (McGregor et al., Citation2008). However, that study was limited by its cross-sectional nature and the lack of cortisol data. To our knowledge, while others have shown that academic stress is associated with elevations in cortisol (Guidi et al., Citation1999), no longitudinal human in vivo studies have shown that chronically elevated psychological stress, such as that experienced during academic exams, and elevated in vivo cortisol levels are associated with significant decrements in peripheral blood B lymphocytes.
The purpose of the present study was to conduct a longitudinal study of the associations among psychological distress, salivary cortisol, and B lymphocyte number. We hypothesized that the students’ psychological stress and cortisol levels would increase, and their B lymphocyte number would decrease from before the school year to the end of the year exam. In contrast, we hypothesized that the community comparison participants’ psychological stress, cortisol, and B lymphocytes would remain relatively constant over the course of the school year.
Methods
Participants
Individuals were eligible to participate in the present study if they were over the age of 18 and fluent in English. Exclusion criteria included use of immune modulating drugs, current infectious disease, prior cancer diagnosis, and history of autoimmune disease or major psychopathology. Students were first-year graduate students in a program that required a stressful preliminary exam at the end of the first year. Twenty-four students were recruited from the entering class of the University of Washington, School of Public Health. Thirty-four non-student comparison participants were recruited from the community using fliers and word of mouth. All study procedures were approved by the Hutchinson Center Institutional Review Board.
Procedures
First-year graduate students and comparison participants completed psychosocial questionnaires, collected saliva samples for cortisol analysis, and had blood drawn for lymphocyte phenotype analysis before classes started in the fall (T1) and at the end of the students’ first academic year, 5 d before qualifying exams (T2). Psychosocial questionnaires and saliva collection tubes were mailed to participants the week before each time point. Participants completed the questionnaires at home and collected saliva for 2 d before their blood draw. Participants returned completed questionnaires and saliva tubes when they came to their blood draw appointment. All blood and saliva from women was collected during the follicular phase of the menstrual cycle. When women were scheduled for the study, they were asked the date of their last period. Their blood draws were scheduled accordingly. Saliva was collected for the 2 d immediately prior to their blood draw.
Measures
Perceived stress
Perceived stress was measured using the Perceived Stress Scale (PSS) (Cohen et al., Citation1983). This instrument uses a Likert-type rating scale to measure the degree to which situations in life are perceived as stressful, specifically unpredictable, uncontrollable, and overloading. Extensive normative data have been collected on over 2000 respondents. The scale has excellent psychometric properties and relates to relevant outcomes in expected ways. Internal consistency is high with Cronbach’s alphas ranging from 0.75 to 0.86 (Cohen et al., Citation1983). In the present sample, Cronbach’s alpha was 0.89 at T1 and 0.91 at T2.
Negative affect
Negative affect was assessed with brief scales consisting of descriptive adjectives used in earlier breast cancer research (Carver et al., Citation1993). Respondents are asked to indicate the degree to which they have experienced each feeling “during the past week including today.” Response options range from 1 (not at all) to 5 (extremely). We focused on anxiety (tense, nervous, and anxious), depression (helpless, unhappy, worthless, and hopeless), and anger (angry, resentful, and grouchy) and computed a variable called negative affect from the mean of the anxiety, depression, and anger subscale scores. In a sample of 235 students, these brief scales had correlation values of 0.87, 0.93, and 0.87, respectively, with comparable full-length scales from the Profile of Mood States (POMS) (McNair et al., Citation1981). These scales have previously demonstrated good reliability with Cronbach’s alphas ranging from 0.77 to 0.87 (Carver et al., Citation1993). In the present sample, Cronbach’s alphas for these scales ranged from 0.70 to 0.87.
Depressive symptoms
Depressive symptoms were assessed using the Center for Epidemiological Studies Depression scale (CES-D), a widely used 20-item scale (Radloff, Citation1977). The CES-D measures a range of cognitive, affective, motivational, and somatic symptoms experienced over the past week framed as first-person sentences such as “I felt lonely.” Response options range from 1 (rarely) to 4 (most of the time). The CES-D was developed for the general (i.e. non-psychiatric) population and has good psychometric properties with Cronbach’s alphas in the upper 0.80s to low 0.90s (Myers & Weissman, Citation1980). In the present sample, the CES-D had a Cronbach’s alpha of 0.89 at T1 and 0.92 at T2.
Lymphocyte phenotype
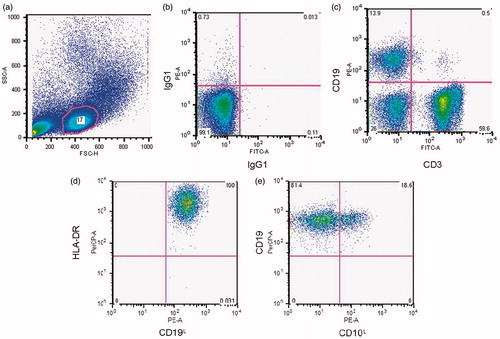
All blood was drawn between 2:30 and 5:00 in the afternoon. Peripheral blood mononuclear cells (PBMC) were isolated from whole blood using Ficoll density gradient centrifugation. Trypan blue excluding PBMC were counted manually using a light microscopy and hemacytometer. Fresh PBMC were then stained for enumeration of lymphocyte phenotype using flow cytometry. Briefly, PBMC were labeled with FITC- or PE-conjugated antibodies (Becton-Dickinson, Franklin Lakes, NJ). Antibodies used for each participant included FITC and PE isotype controls, anti-CD19 PE (B lymphocytes, anti-CD19-PE clone J4.119), CD19 + CD10 + (immature B cells, anti-CD10 FITC clone ALBI), CD19 + DR + (mature B cells, anti-DR FITC clone Immu 357) and anti-CD 3 FITC (T lymphocytes, anti-CD3 FITC clone UCHT1). Flow cytometry was used to analyze the percentage of CD19 + and CD3 + lymphocytes in the lymphocyte gated population. We then gated on CD19 + lymphocytes to analyze the percentage of CD19 + CD10+, CD19 + DR + lymphocytes. (For more information on the gating scheme, see ).
Figure 1. A representative image of the gating procedure. We first used a forward (FSC-H) and side scatter (SSC-A) histogram (a) to gate on the lymphocyte population. Then we used IgG1 FITC-A by IgG1 PE histogram (b) as the negative control. Histogram (c) shows the percentage of CD19 + and CD3 + cells in the lymphocyte gate. The CD19 + subset is shown in histograms (d) and (e).
Salivary cortisol
Salivary cortisol was measured at T1 and T2 for 2 d before the blood draw. To capture the diurnal rhythm of cortisol levels, salivary cortisol was assessed at five time points over the course of each day: waking, 30 min after waking (wake +30), 1100 h, 1500 h, and bedtime (Turner-Cobb et al., Citation2000). Participants were given clear and consistent instructions about how and when to collect their saliva and were asked to refrain from exercising, eating, or brushing their teeth for 1 h prior to saliva collection. Participants recorded the time of waking and saliva collection on a log sheet. In addition, participants were instructed to record if a saliva sample was collected late or missed completely. While electronic confirmation of collection time is ideal, others have found self-reported waking time to be reliable compared to polysomnography (PSG) assessment of waking times (Okun et al., Citation2010). Saliva samples were kept at room temperature overnight and returned when the participant came in for the blood draw the next day. The salivettes were centrifuged and saliva aliquots were frozen at −80 °C until the time of assay. Once samples from all time points were collected for a participant, they were sent to the Kirschbaum Lab in Dresden, Germany for analysis. After thawing, salivettes were centrifuged at 3000 rpm for 5 min, which resulted in a clear supernatant of low viscosity. Salivary free cortisol concentrations were measured using a commercially available chemiluminescence-immuno-assay (CLIA) with high sensitivity of 0.16 ng/ml (IBL, Hamburg, Germany). The mean intra-assay coefficient of variation was 5.74%. The inter-assay coefficient was 6.8%.
Two cortisol variables were computed: area under the curve (AUC) and cortisol awakening response (CAR). The mean salivary free cortisol level across 2 d was computed for each of the 5 daily time points (wake, wake +30, 1100 h, 1500 h, and bed time). AUC was computed with the trapezoidal formula using all 5 time points over the course of the day. CAR was simply the difference between the mean wake +30 cortisol level and the mean waking cortisol level.
Data analyses
All variables were checked for normalcy and the presence of outliers. All distributions were normal, with the exception of cortisol, in which one outlier (who had multiple cortisol values that were more than three standard deviations from the mean) was observed resulting in a skewed and kurtotic distribution. In order to normalize the cortisol data, this individual was excluded from all analyses involving cortisol.
A one-way ANOVA and chi-square tests were used to compare student and comparison group demographic variables and measures of distress at each time point. Control variables were determined based on significant relationships between demographic variables and outcome variables. Hierarchical linear regression with necessary control variables was used to assess the effect of student status on the three measures of distress, the four measures of lymphocyte phenotype, and cortisol AUC and CAR over time (T1–T2).
Results
Demographics of the present sample are shown in . The student and comparison groups did not differ significantly on any demographic variable except gender, which was included as significance. Additionally, the difference in age between the student and comparison groups was approaching significant difference in age (p = 0.057), so this was also included as a control variable in all analyses. Compared to controls, students reported greater levels of distress on all measures at each time point, except perceived stress at T1, as expected. There were no significant differences in total PBMC counts between the two groups at T1 or T2 ().
Table 1. Demographic characteristics of sample.
Table 2. Descriptive statistics for all measures among students and community controls at each time point.
Hierarchical linear regression analyses () revealed that student status (individuals enrolled in their first year of graduate studies) significantly predicted perceived stress at T2 when controlling for T1 perceived stress, β = −0.332, ΔR2 = 0.085, p = 0.011, but not T2 negative affect or depressive symptoms. Student status also predicted T2 CD19 + lymphocyte percentage when controlling for T1 CD19 + lymphocyte percentage and T2 PBMC counts, β = 0.275, ΔR2 = 0.061, p = 0.025 (). Additionally, student status significantly predicted changes in CAR (β = 0.313, ΔR2 = 0.076, p = 0.049), but not AUC (β = 0.205, ΔR2 = 0.034, p = 0.108). Specifically, students exhibited greater flattening of the CAR (from a 23% increase at T1 to a 2% increase at T2) compared to comparison participants (who had a 38% increase at T1 and 27% increase at T2; ). However, student status was not predictive of significant change in immature (CD19 + CD10+) B lymphocytes, mature (CD19 + DR+) B lymphocytes, or T (CD3+) lymphocytes ().
Figure 2. Change in CD19 + B Lymphocytes over time among students and community comparison participants. Student status predicted a significant decrease in CD19 + lymphocyte percentage when controlling for T1 CD19 + percentage and T2 PBMC (β = 0.275, *R2 = 0.061, p = 0.025). *p < 0.05.
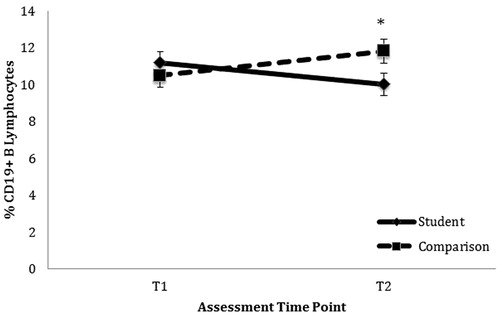
Figure 3. Flattening of CAR from T1 to T2 among students compared to community comparison group (mean of T1 and T2). Note: *indicates that Student T2 salivary cortisol is significantly lower than student salivary cortisol levels at T1 or the community mean.
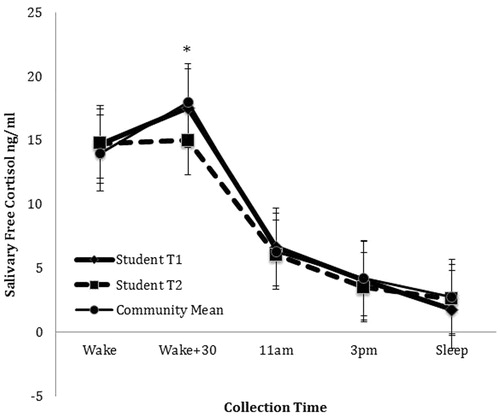
Table 3. Summary of hierarchical linear regression analyses.
None of the distress measures were associated with the change in CD19 + lymphocyte percentage from T1 to T2. Students’ CAR significantly flattened from T1 to T2 () and their levels of CD19 + lymphocytes decreased (). In contrast, comparison participants’ CAR and percentage of CD19 + lymphocytes remained stable (). Overall, change in CAR significantly predicted T2 CD19 + B lymphocyte percentage above and beyond condition when controlling for age, gender, and baseline CD19 + B lymphocytes (β = −0.240, p = 0.024). Results of all regression analyses are presented in .
Discussion and conclusions
The present longitudinal study expands on earlier cross-sectional work which reported dramatically low levels of CD19 + B lymphocytes among stressed graduate students. In the present study, student CD19 + B lymphocytes decreased significantly over the course of the year, but did not reach the dramatically low levels observed in our previous study (5.8% of total lymphocytes) (McGregor et al., Citation2008). Although the correlation between CD19 + B lymphocytes and PSS score in the present study was negative (r = −0.130, p = 0.363), this relationship was not significant as it was in our earlier study (r = −0.60, p = 0.003) (McGregor et al., Citation2008). It is likely that we did not see this relationship because the students in the present study were not experiencing great enough chronic stress, and thus cortisol elevation to the necessary extent. The intensity and duration of the third-year graduate students’ stress in the previous study was much greater than that for the first-year students in the present study. In fact the mean T2 PSS score in the present study of 16.09 (SD = 6.34) was 15 points lower than the mean PSS score (M = 31.14, SD= 3.93) reported by the third-year students in our previous work (McGregor et al., Citation2008).
It is interesting to note that though the students did not experience the higher daily levels of cortisol as expected, we did observe a flattening of the CAR over time among the students from a 23% morning increase at T1 to a 2% morning increase at T2. Some consider a normal increase in CAR to be between 50% and 160% (Clow et al., Citation2004). While neither the students nor comparison participants had a 50% morning increase in CAR, the student’s 2% CAR increase at T2 would seem to be clinically meaningful. Furthermore, this change in CAR was correlated with the decrease in B lymphocytes over time. This finding fits with a Chinese longitudinal study of graduate students preparing for a major exam which also reported a flattening of the CAR compared to a community control group (Duan et al., Citation2013). Decreased CAR has been associated with prolonged stressors (Fries et al., Citation2009) and may be an indicator the students were experiencing a chronic stressor that was not sufficiently captured by our self-report measure of stress. This finding supports and extends our earlier work that reported a negative correlation between stress and B lymphocytes among third-year graduate students. A major difference between the current study and our earlier study is that the previous study used only a single time point during the third year of graduate school. The stress during that third year is likely greater than during the first year. In similar fashion to our earlier work, we did not see a correlation between stress and CD3 + T lymphocytes although others have reported glucocorticoid-associated apoptosis of early T lymphocytes (Ashwell et al., Citation2000; Lu et al., Citation2000).
Limitations of the present study include its small N and the possibility that participants may not have adhered to the protocol for collection of salivary cortisol. Large delays (greater than 15 min) between waking and collection of the waking cortisol sample can have an effect on CAR interpretation (Okun et al., Citation2010). While participants entered the time of waking and saliva collection in a log sheet, and were instructed to note when the collection was late or forgotten, there is no way to know for sure if they accurately adhered to the timing requirements and other instructions (e.g. refraining from eating in the hour prior to saliva collection). Also, it is possible the changes at T2 reflect an acute response to the upcoming exam, rather than chronic stress over the course of the year. Finally, while the change in CD19 + B lymphocytes is statistically significant, we do not know yet if it is has clinical significance.
Strengths of the study include its longitudinal design and the inclusion of diurnal cortisol data. The longitudinal design allowed us to explore the impact of an in vivo stressor over the course of the academic year. Flattening of the CAR was associated with the change in CD19 + B lymphocytes, which suggests an experience of prolonged stress.
Future research should explore the feasibility of collecting data at multiple time points in order to have more proximal data. It would also be interesting to explore the use of ecological momentary assessment for self-report measures of stress in conjunction with longitudinal psychophysiological outcomes. This would help determine if the acute stressor (and a related potential increase in CD19 + B lymphocytes) (Maes et al., Citation1999) of the exam was partially clouding the expected decrease in CD19 + B lymphocytes associated with chronic stress among the students. Additionally, the implications of the association between chronic stress, cortisol, and CD19 + B lymphocytes observed in this study should be further explored, perhaps in participants who are experiencing higher levels of stress (e.g. third-year graduate students) or individuals with depressive symptoms. For example, depressive symptoms are associated with elevated cortisol levels (Lutgendorf et al., Citation2008) and cortisol reactivity (Pruessner et al., Citation2003) and may also be impacting B lymphocyte number. Finally, given that the purported mechanism underlying the decrease in B lymphocytes was cortisol induced apoptosis, it would have been interesting to measure apoptotic pre-B cells using flow cytometry.
There is a large body of literature documenting that chronic stress can impair antibody response to vaccine (Burns et al., Citation2002a,Citationb,Citationc; Cohen et al., Citation2001; Gallagher et al., Citation2009; Glaser et al., Citation2000; Marsland et al., Citation2001). Stress-related reductions in B lymphocytes may be one mechanism to explain the relationship between chronic stress and impaired antibody response to vaccine. However, to our knowledge, there are no studies describing changes in B lymphocyte function as a result of chronic stress or the health effects of low B lymphocyte levels in humans. The mechanism for the relationship between stress and immune response in healthy individuals explored in this study may have important implications regarding immune response to preventative vaccines. Specifically, stress-related decreases in CAR, which has been associated with prolonged stressors, may be an early indicator of how glucocorticoids associated with chronic stress may impair antibody response to vaccine by decreasing the number of mature B lymphocytes available to become antibody-producing cells.
Declaration of interest
The authors of this manuscript declare that there are no financial, consulting, or personal relationships with other people or organizations that influenced the writing of this manuscript. This study was funded by NCI R03 CA119757.
References
- Ashwell JD, Lu FW, Vacchio MS. (2000). Glucocorticoids in T cell development and function. Annu Rev Immunol 18:309–45
- Burns VE, Carroll D, Ring C, Harrison LK, Drayson M. (2002a). Stress, coping, and hepatitis B antibody status. Psychosom Med 64(2):287–93
- Burns VE, Drayson M, Ring C, Carroll D. (2002b). Perceived stress and psychological well-being are associated with antibody status after meningitis C conjugate vaccination. Psychosom Med 64(6):963–70
- Burns VE, Ring C, Drayson M, Carroll D. (2002c). Cortisol and cardiovascular reactions to mental stress and antibody status following hepatitis B vaccination: a preliminary study. Psychophysiology 39(3):361–8
- Carver CS, Pozo C, Harris SD, Noriega V, Scheier MF, Robinson DS, Ketcham, AS, et al (1993). How coping mediates the effect of optimism on distress: a study of women with early stage breast cancer. J Person Soc Psychol 65(2):375–90
- Clow A, Thorn L, Evans P, Hucklebridge F. (2004). The awakening cortisol response: methodological issues and significance. Stress 7(1):29–37
- Cohen S, Kamarck T, Mermelstein R. (1983). A global measure of perceived stress. J Health Social Behav 24(4):385–96
- Cohen S, Miller GE, Rabin BS. (2001). Psychological stress and antibody response to immunization: a critical review of the human literature. Psychosom Med 63(1):7–18
- Dhabhar FS. (2008). Enhancing versus suppressive effects of stress on immune function: implications for immunoprotection versus immunopathology. Aller Asthma Clin Immunol 4(1):2–11
- Duan H, Yuan Y, Zhang L, Qin S, Zhang K, Buchanan TW, et al (2013). Chronic stress exposure decreases the cortisol awakening response in healthy young men. Stress 16(6):630–7
- Fries E, Dettenborn L, Kirschbaum C. (2009). The cortisol awakening response (CAR): facts and future directions. Int J Psychophysiol 72(1):67–73
- Gallagher S, Phillips AC, Drayson MT, Carroll D. (2009). Parental caregivers of children with developmental disabilities mount a poor antibody response to pneumococcal vaccination. Brain Behav Immun 23(3):338–46
- Garvy BA, Fraker PJ. (1991). Suppression of the antigenic response of murine bone marrow B cells by physiological concentrations of glucocorticoids. Immunology 74(3):519–23
- Garvy BA, King LE, Telford WG, Morford LA, Fraker PJ. (1993). Chronic elevation of plasma corticosterone causes reductions in the number of cycling cells of the B lineage in murine bone marrow and induces apoptosis. Immunology 80(4):587–92
- Glaser R, Sheridan J, Malarkey WB, MacCallum RC, Kiecolt-Glaser JK. (2000). Chronic stress modulates the immune response to a pneumococcal pneumonia vaccine. Psychosom Med 62(6):804–7
- Guidi L, Tricerri A, Vangeli M, Frasca D, Riccardo Errani A, Di Giovanni A, et al (1999). Neuropeptide Y plasma levels and immunological changes during academic stress. Neuropsychobiology 40(4):188–95
- Igarashi H, Medina KL, Yokota T, Rossi MI, Sakaguchi N, Comp PC, et al (2005). Early lymphoid progenitors in mouse and man are highly sensitive to glucocorticoids. Int Immunol 17(5):501–11
- Laakko T, Fraker P. (2002). Rapid changes in the lymphopoietic and granulopoietic compartments of the marrow caused by stress levels of corticosterone. Immunology 105(1):111–19
- Lacey K, Zaharia MD, Griffiths J, Ravindran AV, Merali Z, Anisman H. (2000). A prospective study of neuroendocrine and immune alterations associated with the stress of an oral academic examination among graduate students. Psychoneuroendocrinology 25(4):339–56
- Levi B, Benish M, Goldfarb Y, Sorski L, Melamed R, Rosenne E, et al (2011). Continuous stress disrupts immunostimulatory effects of IL-12. Brain Behav Immun 25(4):727–35
- Lill-Elghanian D, Schwartz K, King L, Fraker P. (2002). Glucocorticoid-induced apoptosis in early B cells from human bone marrow. Exp Biol Med (Maywood) 227(9):763–70
- Lu FW, Yasutomo K, Goodman GB, McHeyzer-Williams LJ, McHeyzer-Williams MG, Germain RN, et al (2000). Thymocyte resistance to glucocorticoids leads to antigen-specific unresponsiveness due to “holes” in the T cell repertoire. Immunity 12(2):183–92
- Lutgendorf SK, Weinrib AZ, Penedo F, Russell D, DeGeest K, Costanzo ES, et al (2008). Interleukin-6, cortisol, and depressive symptoms in ovarian cancer patients. J Clin Oncol 26(29):4820–7
- Maes M, Van Bockstaele DR, Gastel A, Song C, Schotte C, Neels H, et al (1999). The effects of psychological stress on leukocyte subset distribution in humans: evidence of immune activation. Neuropsychobiology 39(1):1–9
- Marsland AL, Cohen S, Rabin BS, Manuck SB. (2001). Associations between stress, trait negative affect, acute immune reactivity, and antibody response to hepatitis B injection in healthy young adults. Health Psychol 20(1):4–11
- McGregor BA, Antoni MH, Ceballos R, Blomberg BB. (2008). Very low CD19 positive B-lymphocyte percentage is associated with psychological stress among healthy graduate students. Stress Health 24:413–8
- McNair D, Lorr M, Droppelman L. (1981). Manual for the profile of mood states. San Diego, CA: Educational and Industrial Testing Service
- Miller GE, Chen E, Zhou ES. (2007). If it goes up, must it come down? Chronic stress and the hypothalamic-pituitary-adrenocortical axis in humans. Psychol Bull 133(1):1981:25–45
- Myers JK, Weissman MM. (1980). Use of a self-report symptom scale to detect depression in a community sample. Am J Psychiatry 137(9):1081–4
- Ng V, Koh D, Mok BY, Chia SE, Lim LP. (2003). Salivary biomarkers associated with academic assessment stress among dental undergraduates. J Dent Educ 67(10):1091–4
- Okun ML, Krafty RT, Buysse DJ, Monk TH, Reynolds Iii CF, Begley A, et al (2010). What constitutes too long of a delay? Determining the cortisol awakening response (CAR) using self-report and PSG-assessed wake time. Psychoneuroendocrinology 35(3):460–8
- Pruessner M, Hellhammer DH, Pruessner JC, Lupien SJ. (2003). Self-reported depressive symptoms and stress levels in healthy young men: associations with the cortisol response to awakening. Psychosom Med 65(1):92–9
- Radloff LS. (1977). The CES-D scale: a self-report depression scale for research in the general population. Applied Psychol Measure 1:385–401
- Roitt I, Rabson A. (2000). Really essential immunology. Oxford: Blackwell Scientific Ltd
- Turner-Cobb JM, Sephton SE, Koopman C, Blake-Mortimer J, Spiegel D. (2000). Social support and salivary cortisol in women with metastatic breast cancer. Psychosom Med 62(3):337–45
- Webster Marketon JI, Glaser R. (2008). Stress hormones and immune function. Cell Immunol 252(1–2):16–26
- Weekes N, Lewis R, Patel F, Garrison-Jakel J, Berger DE, Lupien SJ. (2006). Examination stress as an ecological inducer of cortisol and psychological responses to stress in undergraduate students. Stress 9(4):199–206