Abstract
A framework of “Common Criteria” (i.e. a series of questions) has been developed to inform the use and evaluation of biomonitoring data in the context of human exposure and risk assessment. The data-rich chemical benzene was selected for use in a case study to assess whether refinement of the Common Criteria framework was necessary, and to gain additional perspective on approaches for integrating biomonitoring data into a risk-based context. The available data for benzene satisfied most of the Common Criteria and allowed for a risk-based evaluation of the benzene biomonitoring data. In general, biomarker (blood benzene, urinary benzene and urinary S-phenylmercapturic acid) central tendency (i.e. mean, median and geometric mean) concentrations for non-smokers are at or below the predicted blood or urine concentrations that would correspond to exposure at the US Environmental Protection Agency reference concentration (30 µg/m3), but greater than blood or urine concentrations relating to the air concentration at the 1 × 10⁻⁵ excess cancer risk (2.9 µg/m3). Smokers clearly have higher levels of benzene exposure, and biomarker levels of benzene for non-smokers are generally consistent with ambient air monitoring results. While some biomarkers of benzene are specific indicators of exposure, the interpretation of benzene biomonitoring levels in a health-risk context are complicated by issues associated with short half-lives and gaps in knowledge regarding the relationship between the biomarkers and subsequent toxic effects.
Introduction
Human biomonitoring can be an effective tool for assessing exposure to a variety of chemicals. As biomonitoring data integrates all routes (inhalation, dermal and oral) and sources of exposure (i.e. including occupational, environmental and lifestyle factors such as diet, smoking and hobbies), it can provide valuable perspective to help evaluate aggregate exposure to chemicals (Angerer et al., Citation2006, Citation2007; Pirkle et al., Citation1995). Traditionally, biomonitoring data are used to assess the efficacy of control measures in occupational settings. Biomonitoring data are now one commonly used tool to determine chemical exposure in the general population. Biomonitoring data can also be used to assess the effectiveness of environmental remediation efforts. Thus, when collecting biomonitoring data, one must also consider the overall objectives of the evaluation. For example, if there is a need to understand exposure, then determining the levels of the chemical and/or its metabolites in an appropriate matrix (e.g. blood and urine) may be sufficient. Alternatively, if the biomonitoring data are to be used to understand health effects, considerably more information would be needed. For assessing risk to a population, in addition to the exposure assessment data that biomonitoring may provide, additional information including sources and pathways of exposure and toxicology are needed.
The Biomonitoring Technical Committee of the International Life Sciences Institute (ILSI) Health and Environmental Sciences Institute (HESI) held an International Biomonitoring Workshop in 2004. At this workshop, a framework of “Common Criteria” (i.e. a series of key questions, ) was developed to inform the use and evaluation of the use of biomonitoring data in exposure and human health risk assessment. The criteria were outlined for the following categories (Albertini et al., Citation2006):
exposure,
toxicology/toxicokinetics,
epidemiology,
analytical methods/biomarkers of exposure and
risk assessment/risk management.
Table 1. Biomonitoring common criteria.
The framework emerged through the evaluation of six case studies of chemicals with varying physical–chemical properties and data availability (Barr & Angerer, Citation2006; Birnbaum & Cohen Hubal, Citation2006; Butenhoff et al., Citation2006; Calafat & McKee, Citation2006; Hughes, Citation2006; Robison & Barr, Citation2006). As a follow-up to the 2004 workshop, the ILSI HESI Biomonitoring Technical Committee selected benzene, a data-rich compound, to assess whether refinement of the Common Criteria framework was necessary, and to gain additional perspective on approaches for integrating biomonitoring data into a risk-based context.
Several biomonitoring datasets are available for benzene, including the Centers for Disease Control and Prevention’s (CDC) National Health and Nutrition Examination Survey (NHANES). There is a wealth of published human epidemiology, exposure and toxicology data on benzene (ATSDR, Citation2007; International Agency on Research in Cancer (IARC), Citation1982, Citation1987; Johnson et al., Citation2007). Benzene has been a subject of recent reviews on exposure, health effects and biomarkers (Bird et al., Citation2010; Galbraith et al., Citation2010; HEI, Citation2007; Johnson et al., Citation2007; Snyder, Citation2012; VCEEP, Citation2006; Weisel, Citation2010). This paper applies the Common Criteria to the benzene data to examine the relationship between benzene exposure and human health risk.
Exposure
Human biomonitoring data integrates all sources of possible exposure to a chemical, but it does not provide information on individual routes of exposure. This is because biomonitoring generally makes an assessment of the exposure by quantitating a biomarker of exposure in blood, urine or other biological media. Thus, it is difficult to make an informed decision on an individual route of exposure. If available, additional information concerning the primary sources, routes of exposure and temporal variability will help inform sampling strategies, interpret the health implications of the data and provide the basic information for advice to limit exposure, if necessary.
Primary sources and routes of exposure
Several recent reviews summarize the sources of benzene exposure (ATSDR, Citation2007; Johnson et al., Citation2007; VCEEP, Citation2006; Weisel, Citation2010). The two primary sources of industrial exposure to benzene are activities associated with the production and synthesis of benzene and the use of benzene to synthesize other chemicals. A number of other occupations such as aviation workers, service station workers (Carrieri et al., Citation2006), bus drivers, police (Capleton & Levy, Citation2005), cargo tanker workers (Kirkeleit et al., Citation2006a,Citationb), urban workers (Fustinoni et al., Citation2005a,Citationb; Manini et al., Citation2006) and fishermen (Kirrane et al., Citation2007) may be exposed to benzene through the use of petroleum products. Exposure to benzene in solvents has also been demonstrated for shoe production workers (Kim et al., Citation2006a,Citationb; Wang et al., Citation2006). The air concentrations for these various occupational settings ranged from 1 µg/m3 to over 1000 µg/m3.
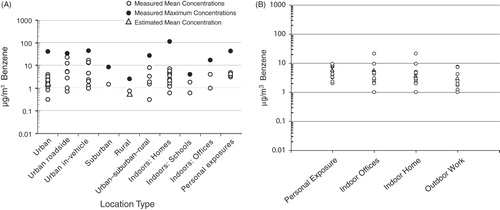
For occupational settings, where the primary exposure routes are inhalation and dermal, exposure assessment can be relatively straightforward if the quantity of material used and the work area is relatively well defined. In contrast, assessment of benzene exposure for the general population is harder to quantify because individual lifestyles are extremely variable, ambient weather conditions can impact exposure, and living environments are more diverse. In non-occupational settings, inhalation of benzene is the primary exposure route with minor contribution from dermal and oral sources. Outdoor ambient air concentrations of benzene are dependent on geographical location (i.e. rural versus urban) (Wallace, Citation1996). Recent surveys in the San Francisco area (Harley et al., Citation2006), Mexico City and Puebla, Mexico (Tovalin-Ahumada & Whitehead, Citation2007) and in Florence, Italy (Fondelli et al., Citation2008) indicate ambient air concentrations of about 0.2–2 µg/m3 (San Francisco), 7 µg/m3 (Puebla), 44 µg/m3 (Mexico City) and 2.3–7 µg/m3 (Florence). US national trends (1994–2009) indicate a 66% decline in the average ambient air benzene concentration (2.7–0.9 µg/m3) for 22 urban monitoring sites (US Environmental Protection Agency (USEPA), Citation2010). Natural sources of benzene in air include volcanoes and forest fires. Anthropogenic sources of benzene in air include combustible fuel emissions, exhaust from motor vehicles and evaporation of gasoline and solvents, especially in attached garages, industry or hazardous waste sites, and home products (e.g. paint). The range of urban, rural, indoor and personal air benzene concentrations vary from 20- to about 1000-fold in the US and Europe (; HEI, Citation2007 and Bruinen de Bruin, 2008). This wide variability in air benzene concentrations shown in (data from , HEI, Citation2007) is due to many factors such as sample location (e.g. rural versus urban; outdoor versus indoor), season and time of measurement (e.g. winter; afternoon), number of observations, average sampling time and other factors (e.g. mean versus maximum concentrations). This variability emphasizes the point that public health scientists need to be cognizant of the sources of their data when assessing the potential adverse health effects from exposure to environmental toxicants.
Figure 1. (A) Benzene ambient air concentrations in the USA, HEI (Citation2007). Reprinted with permission from the Health Effects Institute, Boston, MA. (B) Benzene ambient air concentrations in European metropolitan areas. Adapted from Bruinen de Bruin et al. (Citation2008) with kind permission from Springer Science + Business Media.
An overarching consideration for both occupational and general population sources of exposure to benzene exposure is tobacco smoking. Benzene concentrations can be 10–20 times higher in exhaled breath of cigarette smokers than in non-smokers (Gordon et al., Citation2002). For cigarette smokers, smoking accounts for about 90% of this group’s exposure to benzene (Wallace, Citation1996). For non-smokers, environmental tobacco smoke, depending upon lifestyle and local restrictions on smoking, can be a significant source of benzene exposure (Wallace, Citation1996). Thus, any biomonitoring study of benzene must take into account smoking history and whether individuals are exposed to second-hand smoke.
Considerably lower exposures to benzene (usually <1% of the total body burden) can occur from consumption of food, water and beverages (Wallace, Citation1996). Benzene is detected in raw, processed and cooked foods with concentrations ranging from 1 to 190 parts per billion (ppb, µg/kg) (Fleming-Jones & Smith, Citation2003). It has been suggested that the presence of benzene in food is by its uptake from air (Grob et al., Citation1990). Currently available data indicate that the mean concentration of benzene in drinking water is 0.27 μg/L (95th percentile = 0.5 μg/L and maximum = 355 μg/L) (ATSDR, Citation2007). Page et al. (Citation1993) detected benzene in one of 182 bottled drinking water samples at a concentration of 2 μg/L. Dermal uptake can also contribute to systemic exposure following contact of the skin with solvents or fuels containing benzene. The site and surface area of the skin contacted is of particular importance when evaluating occupational skin exposure to benzene and fuels or solvents containing benzene.
Temporality and duration of exposure
There is some understanding of temporality and duration of occupational exposures since workers typically have defined schedules with known durations of contact with benzene, benzene in the air, or solvents containing benzene. It is more difficult to establish patterns of exposure for the general population since a variety of factors impact exposure and lead to greater variability in exposure (Johnson et al., Citation2007). Background ambient air concentrations of benzene are known or can be determined for the general population and are highly dependent on the living environment of the population being evaluated. For example, mean ambient air levels of benzene are reported to range from 0.6–0.7 µg/m3 in rural settings and 0.3–3.9 µg/m3 in urban settings (HEI, 2007). Thus, individuals living in cities will likely have higher background levels of benzene when compared with individuals living in a rural environment. Knowledge of the ambient benzene air concentrations may provide information about a somewhat constant low-level background exposure with little variation in temporality and duration. In contrast, higher short-duration exposures are often more difficult to assess since they tend to occur at irregular intervals. Ambient air concentrations are most often reported as an average concentration measured over an 8 h, 24 h or longer duration. Therefore, these types of measures should be considered average levels with no information on temporal variation within the sampling time frame or over more extended time periods. Activities such as fueling automobiles or yard equipment (e.g. lawn mowers, snow blowers or other gasoline powered equipment) can result in transient exposures to air concentrations of benzene that approximate occupational air concentrations (Egeghy et al., Citation2000). In addition, exposure to solvents used in certain hobbies may result in higher cyclic exposure to benzene. Lifestyle choices such as cigarette smoking or frequent exposure to second-hand smoke must also be factored in to any consideration of background exposure to benzene.
The assessment of benzene exposure must take into consideration that benzene and its metabolites have relatively short half-lives (≤16 h) (Qu et al., Citation2000; Rickert et al., Citation1979). Additionally, biomonitoring data have documented daily and weekly human intra- and inter-individual variability for benzene and other volatile organic chemicals (Sexton et al., Citation2005). The sampling strategy and analysis of the data should also take this into consideration.
Common Criteria and exposure
Overall, large amounts of data are available to adequately address the Common Criteria questions related to exposure (). The primary sources of occupational (chemical and petroleum industries, use of organic solvents in the manufacturing industry, proximity to combustion of fuels and other flammable material) and non-occupational (tobacco smoke, refueling of combustion engines, emissions from combustion engines) exposures are well characterized. The predominant pathway of benzene occupational and non-occupational exposure is inhalation. Dermal exposure to benzene is more of an occupational than non-occupational concern. With regard to relating human exposure to animal toxicology studies (), there are a number of inhalation toxicity studies of varying duration in rats and mice (ATSDR, Citation2007; National Toxicology Program (NTP), Citation1986; VCEEP, Citation2006), and this topic is covered in “toxicology/toxicokinetics” section. In addition, there is a relatively good understanding of the exposure–dose relationship for benzene toxicity in animals and humans following inhalation exposure as there are a number of physiologically-based pharmacokinetic (PBPK) models for benzene following inhalation exposure, which are evaluated in the “Pharmacokinetic model” section.
Temporality and duration of exposure to benzene are not well studied, but are recognized to be important in the exposure assessment of benzene. It is recognized that exposures to benzene vary with regard to temporality and duration across occupations, geographic regions and populations. Patterns within occupational exposures can be assessed more closely than non-occupational exposures. Biomonitoring results for short-lived compounds such as benzene indicate large intra-individual daily variability in exposure and represent only recent exposure. Care must be taken to extrapolate the results to long-term exposure. Therefore, benzene exposures studies need to be carefully designed if the goal is to allow interpretation of benzene biomonitoring data in a health-risk context. This is discussed further in “risk assessment/risk characterization” section.
Toxicology/toxicokinetics
Toxicology
The presence of a chemical in the body does not itself mean that the chemical will cause harm (CDC, Citation2009). The concentration of a chemical detected in the body needs to be compared to concentrations known to cause health effects. There is a wealth of literature on the human health effects of benzene; indeed, it is one of the most studied compounds in commerce due to its ubiquity in the environment, the ability to identify it at low levels and concern about its health effects (ATSDR, Citation2007; Ahmad Khan, Citation2007; Krewski et al., Citation2000; Snyder, Citation2002, Citation2007; Snyder et al., Citation1993; World Health Organization (WHO), Citation1993). The health effects of benzene are primarily documented from inhalation exposure. For short-term acute toxicities, outcomes from benzene exposure can range from dizziness to death. For chronic toxicities, major outcomes include hematotoxicity and cancer. For the purposes of this paper, only the key endpoints used to derive chronic benzene toxicological benchmarks for risk assessment are summarized.
Hematotoxicity
The hematopoietic system is the most critical target tissue following inhalation exposure to benzene in either humans or animals. A reduction in the number of the three major blood components, erythrocytes (anemia), leukocytes (leukopenia) and platelets (thrombocytopenia), can develop following exposure to benzene. This effect has been noted in humans from a 2 d occupational exposure to benzene at a concentration greater than 60 ppm (parts per million; Midzenski et al., Citation1992). Pancytopenia occurs when there is a reduction in the number of more than one type of blood cell. These effects in blood cells are reversible if the exposure to benzene is removed and the individual provided medical assistance. Rothman et al. (Citation1996) observed decreases in counts of total leukocytes, platelets, lymphocytes and red blood cells and hematocrit in workers exposed to benzene (median level: 31 ppm, 8 h time-weighted average (TWA)). Lymphocyte count is thought to be one of the most sensitive parameters to benzene exposure. Rothman et al. (Citation1996) reported a decrease of the absolute lymphocyte count in a group of workers exposed to 8 ppm benzene (median 8 h TWA). The USEPA (Citation2003) used data from this study to derive the benzene inhalation reference concentration (RfC) of 9.4 ppb (30 µg/m3).
More recent studies have examined exposures to lower levels of benzene than those reported by Rothman et al. (Citation1996). Lan et al. (2004) examined shoe manufacturers exposed to benzene over a 16-month period. There was also a group of age- and gender-matched controls not exposed to benzene (<limit of detection (LOD) of 0.04 ppm). The workers were grouped according to their exposure (control, <1, 1–<10 and ≥10 ppm, mean levels over 1 month monitoring period). Blood was drawn from these individuals and hematological evaluations were conducted. In the lowest exposure group, leukocyte and platelet counts were significantly decreased relative to the control values (8–15% lower). In the highest exposure group, these cells were decreased 15–36% compared to controls. However, Lamm & Grunwald (Citation2006) reanalyzed the Lan et al. data and concluded that while hematotoxicity was demonstrated at benzene concentrations greater than 10 ppm, it was inconsistent at lower concentrations. In two studies by Collins et al. (Citation1991, Citation1997), no significant correlation was observed in workers between benzene exposure (range, 0.01–1.4 ppm; mean, 0.55 ppm, 8 h TWA) and prevalence of abnormal hematological values. More recently, Swaen et al. (Citation2010) assessed low-level occupational exposure to benzene and its effect on hematological parameters. Approximately 20 000 blood samples of non-exposed and benzene-exposed workers were analyzed and there were a similar number of benzene air measurements. Depending on the job and operational status, the mean 8 h TWA benzene air concentration ranged from 0.14 to 0.92 ppm. There was no difference between the lymphocyte counts of exposed and non-exposed groups. There were no differences in hematological parameters (e.g. hemoglobin, hematocrit, white blood cells) among exposed subgroups (<0.5 ppm, 0.5–1 ppm and >1 ppm) and with the non-exposed group. Schnatter et al. (Citation2010) examined a large population of shoe and rubber workers from Shanghai, China. Exposure to benzene ranged from 0.02 to 273 ppm. These authors found decrements in most blood cell types, while fitting change point regression models to each cell type. These analyses suggested decreased blood cell counts down to approximately 8 ppm, benzene; but, clear signals below this concentration were not evident. This concentration is similar to the concentration reported as a no-effect level in Rothman et al. (Citation1996), although the Schnatter et al. (Citation2010) study is much larger. Thus, the concentration of benzene in air where hematological effects begin to occur are still being debated, although more than one study suggests hematological effects begin to appear between 5 and 10 ppm, and no such effect at lower levels.
In cases of high exposure to benzene, aplastic anemia can develop. Aplastic anemia occurs when the bone marrow no longer functions adequately and the stem cells from which the blood cells are derived are unable to mature. Aksoy et al. (Citation1971, Citation1972) reported on the effects of occupational exposure to benzene contained in adhesives. The workers were exposed to benzene for 5 months to 17 years. Recordings of working environment benzene exposures reached 210 ppm, and in some cases, 640 ppm. In one study (Askoy et al., Citation1971), with maximum exposures up to 210 ppm, 25% of the study participants displayed hematological effects including leukopenia, thrombocytopenia, eosinophilia and pancytopenia. Yin et al. (Citation1987a) documented 24 cases of aplastic anemia out of over 500 000 individuals exposed occupationally to benzene mixed with other solvents or benzene alone. In the latter exposures, the workplace benzene air concentration ranged from 0.02 to 264 ppm.
Decreased blood cell counts are observed in laboratory animals following repeated acute, intermediate and chronic inhalation exposure to benzene. Anemia and lymphocytopenia were observed in mice chronically exposed (26 weeks) to 302 ppm benzene (Green et al., Citation1981). Additional studies in animals show there are effects on bone marrow cellularity (hypo- and hypercelluarity) and colony forming stem cells, which are indicative of the development of aplastic anemia (ATSDR, Citation2007). Snyder et al. (Citation1978a, Citation1980) reported a 20% and 81% incidence of bone marrow hypoplasia in mice exposed to benzene for life at 100 or 300 ppm, respectively.
Genotoxicity
Benzene is considered not mutagenic in bacterial systems or in vitro mammalian test systems. However, benzene is reported to be genotoxic when evaluated in mammalian systems in vivo. Furthermore, there is evidence that benzene induces DNA strand breaks in lymphocytes from humans exposed to benzene (Andreoli et al., Citation1997; Nilsson et al., Citation1996; Sul et al., Citation2002). There has been one evaluation of mutations in bone marrow cells from humans exposed to benzene (Rothman et al., Citation1995) using the glycophorin A mutation assay. The results suggest that mutations accumulate in long-lived bone marrow stem cells. However, it was observed that gene duplication occurred as opposed to gene inactivation (Rothman et al., Citation1995).
Carcinogenicity
Carcinogenicity – humans
Occupational exposure to benzene via inhalation has been associated through epidemiological studies with the development of cancer (ATSDR, Citation2007; IARC, Citation1982, Citation1987; USEPA, Citation1998). The cancer type is predominantly acute myeloid leukemia (AML), although there is suggestive evidence that other leukemia cell types, non-Hodgkin lymphoma and multiple myeloma, may also develop (Hayes et al., Citation1997; Rinsky et al., Citation1987; Schnatter et al., Citation2005). The pliofilm study (Rinsky et al., Citation1987) of occupational benzene exposure strongly suggests a relationship with leukemia, as the standard mortality ratio for death from leukemia of the exposed cohort was 3.4 and statistically significant. Crump (Citation1994) performed additional analyses on these data and reported that for the development of acute myelogenous and monocytic leukemia combined (termed “AMML”, of which the majority is AML), the relative risk (RR) for cancer death by cumulative benzene exposure was 5–6 and statistically significant. For higher exposures, the RRs were much higher. For example, workers exposed to benzene between 400 and 1000 ppm-years reported a RR of 9, while workers exposed to over 1000 ppm-years showed an unprecedented RR of 83 AMML (Crump, Citation1994). One of the several large occupational studies in China reported significant increased RR of benzene-exposed workers for all hematologic neoplasms (RR = 2.6), all leukemias (RR = 2.5) and acute non-lymphocytic leukemia (RR = 3.0) (Hayes et al., Citation1997). For lower benzene exposures, risks are less clear, as expected. For example, Schnatter et al. (Citation1996a,Citationb), Rushton & Romaniuk (Citation1997) and Glass et al. (Citation2003) have all studied petroleum workers where benzene exposure ranged up to approximately 220 ppm-years, with average exposures mostly below 5 ppm. Results of these studies have been inconsistent. Limitations of many of the published occupational studies are that exposures to other solvents occur with benzene exposure, exposure monitoring was inadequate in some cases and the overall low number of study subjects in several of the studies decreased the statistical power of the association (ATSDR, Citation2007).
Occupational exposure to benzene has also been related to the development of myelodysplastic syndrome (MDS; Irons et al., Citation2005, Citation2010; Schnatter et al., Citation2012). MDS is a diverse array of neoplastic disorders characterized by varying degrees of pancytopenia and dysplasia of myeloid cells. Its pathogenesis is not well understood, although MDS and AML are often observed as secondary cancers subsequent to treatment with chemotherapeutic agents (Smith et al., Citation2003). MDS has also been previously termed pre-leukemia since it can progress to AML. However, recent estimates report that only about 20–30% of cases progress to AML, thus the term “pre-leukemia” is outdated (Albitar et al. Citation2002). Since bone marrow smears are required for the definitive diagnosis of AML, many early studies may have misclassified MDS as AML, aplastic anemia or other blood disorders (Layton & Mufti, Citation1986). There are several different subtypes of MDS (e.g. refractory anemia; refractory anemia with ringed sideroblasts) and the number has been changing as diagnostic tools have improved (Swerdlow et al., 2008). Only recent studies have examined benzene exposure with respect to MDS subtypes (Irons et al., Citation2005, Citation2010). Using the WHO criteria for the diagnosis of MDS (Swerdlow et al., 2008), Irons et al. (Citation2010) found that MDS-unclassifiable (MDS-U) case subtypes had high benzene exposure when compared to cases of MDS without high benzene exposure (odds ratio = 11.1). More recently, Schnatter et al. (Citation2012) suggested that lower benzene exposures may be related to MDS, although specific MDS subtypes were not examined.
Carcinogenicity – animals
Benzene is carcinogenic in rats and mice following exposure via inhalation. Maltoni et al. (Citation1989) observed carcinomas of the Zymbal gland and oral cavity in male and female Sprague–Dawley rats exposed to benzene at concentrations of 200–300 ppm. The animals were exposed for 4–7 h/d, 5 d/week, up to 104 weeks. There were also small increases in hepatomas and carcinomas of the nasal cavities and mammary glands of these exposed animals. Mice develop thymic and lymphocytic lymphomas, Zymbal gland, lung and ovarian tumors, and myelogenous leukemias from chronic exposure to benzene (Cronkite et al., Citation1984, Citation1989; Farris et al., Citation1993).
The association between occupational exposure to benzene and development of cancer as well a number of animal bioassays where carcinogenic effects were observed provided sufficient evidence whereby the IARC (Citation1982, Citation1987), the USEPA (Citation1998) and the NTP (Citation2005) of the Department of Human and Health Services have classified benzene as a known human carcinogen.
Toxicokinetics
Toxicokinetics is important for helping understand the relationship between exposure and the measured concentration of benzene and its metabolites in the body, and helps relate the toxicological observations at a given dose level in animal studies to what might happen at similar exposure levels in humans.
There are a number of toxicokinetic studies available for benzene. Generally, there are more data from laboratory animal than human studies, with the latter either from cases of poisonings or a small number of human volunteers. Examination of the benzene data from the perspective of the absorption, distribution, metabolism and elimination, the metabolic aspect is the best characterized. Since benzene has a relatively short biological half-life (Yu & Weisel, Citation1996a), understanding when exposure occurs relative to when blood, urine or expired air samples are collected is an important component of the exposure and risk assessment.
Absorption
The majority of absorption data for benzene is focused on inhalation as the route of exposure. Benzene is detected in blood of smokers, firefighters, mechanics and individuals in occupations that produce or use benzene, demonstrating inhalation of benzene is an important route of exposure. A study with human volunteers (Srbova et al., Citation1950) showed that absorption of benzene is rapid at first, with approximately 70% or more of the dose absorbed during the first few minutes of exposure. By 1 h, absorption of benzene then declined, which is due to the increasing benzene concentration in blood, thus reducing the concentration gradient between benzene in air and blood. Overall, the general thought is that the extent of the absorption of benzene in humans via inhalation is about 50% (can vary between 20% and 60%; USEPA, Citation2002). Laboratory animals absorb benzene following inhalation exposure to a similar extent. At 10 ppm, during a 6 h exposure, rats and mice absorb and retain 33% and 50% of the dose, respectively. The percentage of the dose absorbed decreases with increasing concentration of benzene in both species (Sabourin et al., Citation1987). Mice appear to absorb a greater cumulative inhaled dose of benzene than rats (Eutermoser et al., Citation1986; Sabourin et al., Citation1987).
Cases of accidental or intentional poisoning by ingestion indicate that benzene is absorbed systemically because of the toxicity (central nervous system effects, death) that developed in the exposed individuals (Thienes, Citation1972). Benzene administered by gavage in corn or olive oil to animals is rapidly (peak concentration at 1 h) and readily absorbed (≥90% of the dose) (Low et al., Citation1989; Parke & Williams, Citation1953; Sabourin et al., Citation1987). It is generally held that the extent of the absorption of benzene via the oral route is 100%.
Benzene can be absorbed through the skin. Modjtahedi & Maibach (Citation2008) reported that in human volunteers, 0.07% and 0.13% of the applied dose of benzene (0.1 mL, dose area of 25.8 cm2) was absorbed after direct application to the forearm and palm, respectively. In vitro dermal absorption of benzene in monkey and mini-pig was 0.19% and 0.23% of the dose (5 μL/cm2), respectively (Franz, Citation1984). Benzene vapor has also been reported to penetrate animal skin (McDougal et al., Citation1990; Tsuruta, Citation1989), which should be considered in assessments of occupational exposure to benzene.
Distribution
Following absorption, benzene distributes throughout the body to a number of tissues. Benzene is detected in blood, brain, kidney, fat, liver, placenta, cord blood and other tissues of individuals exposed by inhalation (Dowty et al., Citation1976; Winek & Collom, Citation1971). Animal studies show that benzene is distributed widely after inhalation, oral, or dermal exposure, being detected in brain, fat, liver, kidney and in pregnant animals, the placenta and fetus (Ghantous & Danielsson, Citation1986; Low et al., Citation1989; Rickert et al., Citation1979).
Metabolism
The metabolism of benzene has been extensively studied in humans and laboratory animals (ATSDR, Citation2007; Lovern et al., Citation2001; Monks et al., Citation2010; Snyder, Citation2004). These include in vivo studies to identify metabolites of benzene as well as in vitro studies to better understand the mechanism of its metabolism. The mouse, rat and non-human primates share the same Phases I and II pathways of benzene metabolism with humans (Henderson, Citation1996). However, there are species differences in the capacity of these pathways to metabolize benzene which results in differences in the fractional distribution of metabolites formed. These metabolites have potentially different toxicological potency. A scheme of the metabolic pathways of benzene and its metabolites is shown in
Figure 2. A schematic of liver metabolism of benzene. From Boogaard (Citation2009); reproduced with permission of John Wiley & Sons Ltd. EH, epoxide hydrolase; GSH, glutathione; GST, glutathione-S-transferase; DHDH, dihydrodiol dehydrogenase; MPO, myeloperoxidase; NQO1, NADPH quinone oxidoreductase 1.
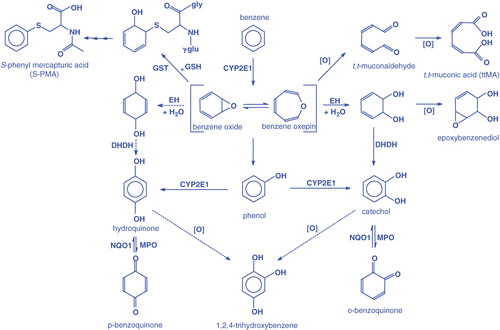
The first step in the metabolism of benzene is oxidation to the intermediate benzene oxide. This oxidation is catalyzed by cytochrome P450 (CYP) 2E1. CYP2B4 has some activity, but is less efficient than CYP2E1. Benzene oxide is in equilibrium with the intermediate benzene oxepin. Benzene oxide (or the oxepin) can undergo non-enzymatic rearrangement to phenol, hydrolysis to a dihydrodiol, ring opening to trans,trans-muconic acid (ttMA) (which is believed to occur through the intermediate trans,trans-muconaldehyde), or react with glutathione to form a pre-mercapturic acid conjugate. The metabolites can undergo further metabolism by oxidation, dehydrogenation or conjugation with sulfate or glucuronic acid. For example, a primary metabolite of benzene oxidation, phenol, can undergo an additional oxidation catalyzed by CYP2E1 to hydroquinone and catechol or can be conjugated with sulfate to form phenyl sulfate. Hydroquinone and catechol can undergo further oxidation catalyzed by peroxidases to their respective quinones. These quinones, which are reactive species, can be reduced back to hydroquinone and catechol by NAD(P)H:quinone oxidoreductase (NQO).
The importance of CYP2E1 in the metabolism of benzene was shown by Valentine et al. (Citation1996). This group exposed benzene to CYP2E1 knockout and wild-type mice via inhalation. The urinary excretion of benzene metabolites was significantly decreased in the knockout mice and there was a change in the metabolite distribution. Phenyl sulfate levels in urine of the knockout mice increased significantly compared to wild-type mice, indicating that there are other CYPs that oxidize benzene and that CYP2E1 is also important in the metabolism of phenol.
Metabolism of benzene occurs in organs in addition to the liver. The liver would be the primary site for metabolism of benzene following oral absorption. For inhalation exposure, the lung would be a major site of benzene metabolism. Chaney & Carlson (Citation1995) compared the metabolism of benzene by rat hepatic and pulmonary microsomes. The hepatic microsomes metabolized benzene five times faster than pulmonary microsomes. There was also a difference in the amount of metabolites formed. For example, hydroquinone comprised 2% and 39% of the metabolites formed in hepatic and pulmonary microsomes, respectively. This difference could be due to the CYP isozymes that metabolize benzene. In vitro studies with liver microsomes prepared from CYP2E1 knockout and wild-type mice show that CYP2E1 is the most important CYP isozyme in this preparation that metabolizes benzene. In lung microsomes prepared from the same mice, it appears that CYP2E1 and isozymes from the CYP2F subfamily metabolize benzene at equal rates (Powley & Carlson, Citation2000). The roles of CYP2E1 and CYP2F1 in benzene metabolism were evaluated in bronchiolar- and alveolar-derived human cell lines by Sheets et al. (Citation2004). Both enzymes were important in the metabolism of benzene, although it appears that CYP2F1 has a higher affinity but lower activity than CYP2E1 toward this hydrocarbon. This difference in affinity/activity may explain the observation by Valentine et al. (Citation1996) that CYP2E1 knockout mice exposed to benzene by inhalation do not display cytotoxicity or genotoxicity as opposed to similarly exposed wild-type (and B6C3F1) mice.
CYP2E1 is detected in bone marrow of laboratory animals and humans (Bernauer et al., Citation1999, Citation2000; Powley & Carlson, Citation2000). However, the extent of benzene metabolism in bone marrow, at least based on in vitro results, does not appear to be great (Irons et al., Citation1980; Lindstrom et al., Citation1999), which suggests that metabolites of benzene formed in other organs are the causative agents for myelotoxicity.
Elimination
Benzene absorbed by inhalation but not metabolized is primarily expired in the breath with much lower amounts (<1%) excreted in the urine (Nomiyama & Nomiyama, Citation1974a,Citationb; Srbova et al., Citation1950). Nomiyama & Nomiyama (Citation1974a,Citationb) reported that in human volunteers exposed to benzene vapors (ca 50–60 ppm for 4 h), approximately 17% of the absorbed dose was expired as parent compound. Similarly, animals exhale unmetabolized benzene following inhalation and oral exposure (Rickert et al., Citation1979; Sabourin et al., Citation1987). Several benzene metabolites are excreted in urine and include conjugated phenol, hydroquinone, catechol and trihydroxybenzene. However, as the concentration of benzene in air or the administered oral dose increases, the metabolic pathways become saturated, and greater levels of benzene are expired. In mice orally administered 10 or 200 mg/kg of radiolabeled benzene, urinary excretion was the predominant pathway of elimination at the low dose (McMahon & Birnbaum, Citation1991). The major urinary metabolites were hydroquinone glucuronide (40% of the dose), phenyl sulfate (28%) and ttMA (15%). At the higher dose, the relative amount of urinary excretion decreased considerably and exhalation of volatile radioactivity increased. Fecal elimination was low for both doses. Following dermal exposure of radiolabeled benzene in humans and laboratory animals, benzene-derived radioactivity was detected in urine (Franz, Citation1984; Modjtahedi & Maibach, Citation2008; Skowronski et al., Citation1988). In similarly exposed rats, benzene-derived radioactivity was detected in expired air (Skowronski et al., Citation1988).
Mode of action
Acute and chronic adverse health effects can arise from exposure to benzene. Most evidence is from inhalation exposure (ATSDR, Citation2007; HEI, Citation2007; Wallace, Citation1996). The critical acute effects are those often associated with exposure to many organic solvents and include narcosis, non-specific central nervous system toxicity, respiratory depression and death (Khan, Citation2007; Snyder et al., Citation1993). The mode of action of the acute effects of benzene is not completely understood. The critical non-cancer effect from chronic exposure to benzene is toxicity to the hematopoietic and immune system (Lan et al., 2004; Rothman et al., Citation1996; Snyder, 2002). Benzene can cause a decrease of the three major circulating cell types: platelets (thrombocytopenia), red blood cells (anemia) and white blood cells (leukopenia) and an increase in mean corpuscular volume (Qu et al., Citation2002; Rothman et al., Citation1996). These effects tend to arise at benzene exposures exceeding 8 ppm, but the effect is also influenced by the duration of exposure (Rothman et al., Citation1996; Schnatter et al., Citation2010). If hematopoietic effects are detected soon enough, the effects are likely to be reversible upon cessation of benzene exposure. However, sustained exposure may result in continued marrow depression involving multiple lineages. This multi-lineage depression of blood counts is also known as pancytopenia (Snyder, Citation2000). Continued exposure may eventually lead to damage to the bone marrow concomitant with pancytopenia, or aplastic anemia. Alternatively, MDS, which is characterized by abnormal maturation and development of hematopoietic precursor cells in the bone marrow, may result, and often is a precursor to leukemia, especially AML (Layton & Mufti, Citation1986; Rossi et al., Citation2000; Snyder, Citation2002). AML is characterized by uncontrolled proliferation of immature myeloid cells.
The mode of action was recently the subject of a 2009 conference in Munich, Germany, which was subsequently published as series of papers in Chemico–Biological Interactions (Vol. 184, Issues 1–2, 2010). The key mode of action events have been described as: (1) metabolism of benzene to benzene oxide, (2) interaction of this metabolite with critical bone marrow cells, (3) initiated bone marrow cells, (4) clonal proliferation of initiated cells and (5) development of leukemia (Meek & Klaunig, 2010).
The critical data gaps described by Meek & Klaunig (2010) include the need for additional perspective on oxidative damage in DNA and other critical cellular macromolecules or cells in humans, as well as how the benzene metabolites interact with cells to induce transformation, and the mechanism for mutation induction. An analysis of concordance between human and animal data suggests that there is good concordance for the hypothesized critical events including the metabolism of benzene to benzene oxide and the clonal proliferaton of mutated cells (Meek & Klaunig, Citation2010). There is a general consensus that the metabolism of benzene has a role in its toxicity (Atkinson, Citation2009; Smith, Citation1996; Snyder, Citation2004, Citation2007). But which of the metabolite/metabolites (benzene oxide, phenol, hydroquinone, ttMA, etc., ) is/are the causative agent(s) is not known. Effects that may occur from these metabolites include covalent binding to critical macromolecules (i.e. proteins and DNA), generation of oxidant species resulting in oxidative stress, impairment of tubulin, histone proteins, topoisomerase II and DNA itself by protein-DNA cross-linking or DNA strand breakage; interference with spindle formation and tubulin function that segregate chromosomes during mitosis; chromosomal abnormalities, particularly chromosome 5 and 7 (Regev et al. Citation2012; Zhang et al., Citation1998a,Citationb) which are affected in AML in general (Irons & Stillman, Citation1996) and others (Khan, Citation2007; Smith, Citation1996; Snyder, Citation2007). Some of the metabolites may also interact with one another so that the toxic effect of one is increased. Eastmond et al. (Citation1987) reported that the coadministration of phenol and hydroquinone to mice mimicked the myelotoxicity detected with exposure to benzene.
There is some degree of understanding of the genotoxic potential of key benzene metabolites (Gaskell et al., Citation2005a,b; Snyder, Citation2007), but a linkage between any specific metabolites and the carcinogenic effect of benzene in rodents or humans has not been elucidated. These include formation of DNA-reactive metabolites, induction of oxidative DNA damage, inhibition of DNA topoisomerase II and interference or damage to mitotic apparatus. Hydroquinone can be oxidized to benzoquinone, which in turn can react with cellular macromolecules, such as tubulin and histones or can lead to the formation of DNA addicts. In addition, catechol and benzenetriol could contribute to the formation of reactive oxygen species. There are also data indicating that the metabolites hydroquinone and benzoquinone are human DNA topoisomerase II inhibitors (Hutt & Kalf, Citation1996; Lindsey et al., Citation2005).
Pharmacokinetic models
PBPK models provide the necessary link to translate the key toxicological endpoints (e.g. an external dose-based no observed adverse effect level) to an internal-based biomarker concentration (e.g. blood or urine). This information, therefore, allows derivation of toxicologically-based biomarker concentrations that can be used to evaluate biomonitoring data in a human health risk context. PBPK models incorporate physiological (e.g. blood flow) and biochemical processes (e.g. metabolic rates) to quantitatively describe the absorption, metabolism, distribution and elimination of a chemical. A number of PBPK models have been developed for benzene in animals and humans (Bois et al., Citation1996; Brown et al., Citation1998; Sinclair et al., Citation1999; Travis et al., Citation1990; Yokley et al., Citation2006; and reviewed in ATSDR, Citation2007 and VCEEP, Citation2006). In general, these models provide good simulations of benzene disposition in several species following an acute inhaled or ingested acute dose and lactational transfer of benzene in humans. A major limitation is that most of these models do not simulate the fate of metabolites and they have not been evaluated for repeated exposure to benzene. Recently, Hays et al. (Citation2012) evaluated the existing human PBPK models for benzene (Bois et al., Citation1996; Brown et al., Citation1998; Sinclair et al., Citation1999; Travis et al., Citation1990; Yokley et al., Citation2006) in derivation of a blood and urinary-based benzene biomonitoring guidance value termed the biomonitoring equivalent. The authors selected the model of Brown et al. (Citation1998) to estimate blood benzene concentrations because of its simplicity, consistency with human kinetic data and being gender specific accounting for differences in body fat (Hays et al., Citation2012). The parameters used for the model are listed in . The approach used by Hays et al. (Citation2012) is used in the “risk assessment” section for the interpretation of blood benzene biomonitoring data. There are currently no PBPK models available to predict urinary benzene; therefore, linear regression equations that relate air benzene concentrations to urinary biomarker concentrations are used to derive biomonitoring guidance values for urinary benzene and a similar approach is used for S-phenylmercapturic acid (SPMA).
Table 2. Human PBPK model parameters for benzene (reproduced from Brown et al. (Citation1998) with permission from John Wiley & Sons).
Common Criteria and toxicology/toxicokinetics
The toxicology of benzene has been extensively studied in laboratory animals and in humans and most of the related Common Criteria questions were adequately addressed (). Because of benzene’s volatility, the majority of toxicology data are derived from inhalation exposure studies. The primary toxic effects of benzene in humans are: (1) the suppressive effects on formation of the three main types of blood cells (erythrocytes, leukocytes and thrombocytes) resulting in hematotoxicity and on the immune system; and (2) the development of AML, which are the key endpoints on which regulatory agencies such as the USEPA base their toxicological benchmarks. MDS is also a toxic effect of concern from chronic benzene exposure. However, currently it is not used as a key endpoint by regulatory agencies, since it has only recently been confirmed as a relevant endpoint, and there are few exposure/response studies available.
Although benzene is one of the most extensively studied chemicals in the world from a toxicological standpoint, the mode of action is not completely understood. It is well-known that the metabolism of benzene is required prior to the development of hematotoxicity and cancer, but the actual metabolite(s) that is/are responsible and how the blood cells are affected have not been completely elucidated. The animal data on the toxicity and disposition of benzene have some relevance for human exposure to benzene. The effects of benzene on blood cells and the immune system observed in animals are pertinent to similar observations in humans. Animals are good models to use to study these two toxicological effects that are observed in humans from exposure to benzene. However, only humans have been clearly shown to develop AML from benzene exposure whereas animals develop different types of leukemia and tumors in several organs. Because of these differences in the types of cancer developed between humans and animals exposed to benzene, the animal data may not lend itself to determine the mechanism of action for the carcinogenic effect of benzene in humans. While humans and animals have common metabolic pathways for benzene, there are differences between the preferred pathways, such that different amounts of metabolites, some potentially more toxic than others are formed. Essentially, there does not appear to be an animal model that mimics exactly human metabolism of benzene (Henderson, Citation1996). However, animals are useful to gain a better understanding on how benzene and its metabolites distribute to target organs. Also, animals specifically bred to imitate human polymorphisms in benzene metabolizing enzymes would provide valuable information on the susceptibility to the toxic effects of this compound. In addition, humanized mouse models implanted with tissue-engineered human liver (Chen et al., Citation2011) could potentially develop leukemia following chronic exposure to benzene. Although presently not known, the humanized mice could theoretically metabolize benzene differently than wild-type mice.
For human biomonitoring, ideally the metabolite(s) responsible for benzene’s toxic effects would be monitored in blood or urine and related to the adverse health effect. This is not possible for benzene, but there are a number of human PBPK models that provide the linkage between internal-based benzene biomarker concentrations such as benzene in blood and the toxicological endpoints. This information allows derivation of toxicologically-based biomarker concentrations that can be used to evaluate biomonitoring data in a risk assessment context. However, care must be taken when interpreting biomonitoring data for compounds with biological half-life such as benzene since the presence of benzene in blood represents exposure that occurred only recently. In addition, the current PBPK models for humans have limited ability to track metabolites of benzene, and better characterization of the kinetics of the proposed toxic metabolites of benzene, such as benzene oxide, benzoquinones, hydroquinone and muconaldehyde is needed.
Epidemiology
As noted in the previous section, there have been a number of epidemiological studies focused on benzene exposure. The results of these studies have been reviewed in many criteria documents (e.g. ATSDR, Citation2007; IARC, Citation1987, Citation1982; NTP, Citation2005), which have determined that benzene is a known human carcinogen. A recent IARC working group reviewed over 100 studies on benzene and confirmed that it is carcinogenic, with sufficient evidence for AML (Baan et al., Citation2009). The working group classified the evidence as limited for the following cancers: acute lymphoid leukemia, chronic lymphoid leukemia, multiple myeloma and non-Hodgkin lymphoma. The working group did not comment on the strength of evidence regarding benzene and MDS, although recent studies seem to suggest that it should also be regarded as having at least “limited evidence” (Irons et al., Citation2010; Schnatter et al, Citation2012). Benzene is also a known cause of hematotoxicity as manifested by association with aplastic anemia and effects on circulating blood cell counts.
Benzene and Bradford Hill criteria
The most widely applied guidelines for assessing causality are those attributed to Bradford-Hill (Citation1965). Benzene-induced carcinogenicity and hematotoxicity satisfy the Bradford-Hill guidelines as follows:
Strength of the effect: AML risks have been shown to be several-fold higher than background when there is sufficient benzene exposure (Crump, Citation1994; Hayes et al., Citation1997). Hematotoxicity can be found in marked excess given high levels of benzene (Aksoy et al., Citation1971; Greenburg et al., Citation1939; Yin, Citation1987a,b). Thus, when benzene exposures are sufficient, strong effects on cancer and hematotoxicity are present.
Consistency for effects: Excess AML risks have been shown in the above studies (Crump, Citation1994; Hayes et al., Citation1997) as well as several others for which exposure was high enough to induce an effect (Bond et al., 1986; Sorahan et al., Citation2005; Wong et al., 2010). The consistency of effects is also noted in a review that shows a number of elevated AML risks from studies in more highly exposed industries (Schnatter et al., Citation2005). For hematotoxicity, additional studies reporting an effect for sufficient benzene exposures are Fishbeck et al. (1978). Yardley-Jones et al. (1988), Rothman et al. (Citation1996), Qu et al. (Citation2002), Lan et al. (2004) and Schnatter et al. (Citation2010). The consistency criteria are satisfied for benzene’s effect on AML and hematotoxicity.
Biologic gradient: This refers to whether a larger effect occurs for higher exposures. It is also known as a monotonic dose–response pattern. Benzene has shown clear dose–response patterns for AML. For example, risks increase from background to 2.0, 9.1 and 82.8 for successive dose groups in Crump (Citation1994); and from background to 1.9, 4.3 and 3.6 for increasing cumulative exposure in Hayes et al. (Citation1997). For hematotoxicity, benzene also displays dose response effect. For example, Kipen et al. (1988, 1989) show white blood cell decrements at above 35 ppm, but not at 15–20 ppm. Lan et al. (2004) show stronger decrements for white blood cells, B-cells, CFU-GM, and other parameters for 10+ ppm exposures. Schnatter et al. (Citation2010) show a higher risk for abnormally low blood count readings for all three major cell parameters (white blood cells, platelets and red blood cells) for exposures of 10 ppm or more versus lower exposures.
Biologic plausibility: There is a wealth of research that demonstrates that benzene is metabolized to toxic intermediates and can be further metabolized in the bone marrow, the target organ for the effects noted above. While animal studies have not shown excess AML, benzene induces cancer in other sites (Cronkite et al., Citation1985, Farris et al., Citation1993), and is also a demonstrable hematotoxin (Farris et al., Citation1997).
Experimental evidence (removal of exposure): Hill also advanced the notion that causality assessment was strengthened when removal of an agent was followed by an absence of the effect under investigation. Interestingly, Silver et al. (Citation2002) report that excess risk steadily declines for development of cancer after exposure to benzene ceases. In fact, the excess of leukemia in pliofilm workers appears to have worn off approximately 10 years after exposure ceases (Silver et al., Citation2002, Richardson, Citation2008). Reversibility of hematotoxic effects (Cronkite et al., Citation1989) has also been reported.
Thus, the Bradford-Hill guidelines which have served as a useful framework for determining causal relationships in epidemiological studies support the causality between carcinogenicity and hematotoxicity and exposure to benzene.
Common Criteria and epidemiology
As described above, the criteria for making reasonable inferences of association of exposure to benzene and causation of toxic effect are supported by the Bradford Hill guidelines ().
Observance of health effects in populations exposed to the agent of concern is germane to design future epidemiologic studies that are able to link biomarkers to health effects (Albertini et al., Citation2006). Reduction of benzene exposures makes it less likely to find frank health effects in current-day populations. A recent series of studies in Shanghai suggest that there still may be health effects in recently exposed populations, although recent efforts to lower exposure (Liang et al., Citation2006) in China make this somewhat speculative.
Irons et al. (Citation2010) reported that MDS patients who were chronically exposed to higher levels of benzene were characterized by abnormal eosinophils, a preponderance of MDS-U (a subtype where peripheral blood cell changes do not parallel lineage abnormalities in the bone marrow), and phagocytosis suggesting an autoimmune response. In addition, Schnatter et al. (Citation2010) reported mild peripheral blood effects for exposure levels exceeding 7 ppm. If similar populations can be identified, more focused studies that link biomarkers with these health effects could be designed. Others (Natelson, 2007) advance the notion that benzene exposures in the west are no longer of a sufficient magnitude to cause AML.
Genetic polymorphisms in the enzymes that metabolize benzene (e.g. CYP2E1) and its metabolites (e.g. NQO, glutathione S-transferase, myeloperoxidase) as well as enzymes that repair the oxidative DNA damage inflicted by benzene may have a role in the toxicity of benzene (Chen et al., 2007; Kim et al., 2007; Wan et al., Citation2002; Wu et al., Citation2008). These can affect both biomarkers of exposure and effect (Dougherty et al., Citation2008). Individuals with these polymorphisms may have increased susceptibility to the effects of benzene. For example, in 100 Chinese workers with chronic benzene poisoning, there was a 2.8-fold increased risk for this effect in subjects with the NQO1 609C > T mutation geneotype as opposed to the heterozygous and wild-type genotypes (Chen et al., 2007). In a review of the literature, Dougherty et al. (Citation2008) report both positive and negative findings for the effect of polymorphisms. This may be due to the complexity of benzene metabolism which translates to a large number of candidate genes, gene products and feedback mechanisms involved in metabolism, elimination and subsequent disease.
Biomarkers/analytical methodology
A critical aspect of any biomonitoring study is establishing a validated analytical method to detect an analyte in a biological system that has resulted from exposure to a chemical. This analyte is termed a biomarker of exposure. Well characterized and validated analytical methods are essential for developing reproducible data across multiple laboratories and permit assessment of large populations and/or geographical regions. Similarly having a validated biomarker(s) of exposure ensures that exposure to the chemical of interest will be accurately assessed. In addition, it is of paramount importance to identify the most appropriate biomarker(s) of exposure (Albertini et al., Citation2006). An appropriate biomarker of exposure is one that is relevant and valid (WHO, Citation2001). Relevance indicates that the biomarker will impart biological data to risk assessors that will allow them to make a scientifically informed decision of a potential public health concern from exposure to the chemical. Valid indicates the analytical procedures used to detect and quantitate the biomarker are authoritative and the intrinsic characteristics of the biomarker are well characterized (e.g. significance, sensitivity, specificity) (WHO, Citation2001). Ideally, the biomarker will reflect relevant levels of exposure, will provide information on background levels of the chemical, its confounders are identified, and it is linked to an adverse health effect or correlated to concentration at the target organ (WHO, Citation2001).
The selection and analysis of the biomarkers of exposure can be considered in the context of the previously outlined Common Criteria for biomonitoring (). A number of biomonitoring studies have been conducted over many years that have used different biomarkers. Identifying and quantifying benzene in blood, urine or expired air, or its metabolites in urine are approaches for investigating benzene exposure in humans (; Johnson et al., Citation2007; Snyder, Citation2004). In addition to benzene and it metabolites, biological adducts of benzene may also be used as biomarkers of exposure (Weisel, Citation2010). For the determination of internal benzene exposure the following approaches are evaluated:
benzene in blood, urine and expired air,
SPMA in urine,
ttMA in urine,
phenol in urine,
catechol and hydroquinone in urine and
DNA and protein adducts in blood.
Benzene
Biomonitoring of benzene illustrates that three different matrices, blood, urine and expired air can be used. There are considerations for using each of these matrices and analytical techniques have been published in peer reviewed analytical journals, and successfully used in a number of studies investigating environmental and occupational exposure to benzene. These analytical methods are sufficiently sensitive to detect benzene in practically all blood, urine and expired air samples collected from people living in countries where benzene exposure occurs. Although dependent on dose, the biological half-life of benzene is approximately 10 h or less (Sabourin et al., Citation1987).
Analytical methodology
For the determination of benzene in blood, urine and expired air, the analytical techniques are able to detect concentrations in the low part-per-trillion (ng/L) range. For the analysis of blood and urine, dynamic headspace (purge and trap) is generally the technique of choice. For enrichment purposes, the analyte (i.e. benzene) is trapped on solid phases like Tenax or charcoal which, in most cases, are cooled. Thereafter, desorption takes place at higher temperature, and the analyte is transferred to a capillary column for gas chromatographic separation. Similarly, for the analysis of alveolar air, benzene is enriched on a solid phase material and transferred to a capillary column by elevating the temperature of the sorbent. Flame ionization or mass spectrometry (MS) can be used for the detection and quantification of benzene (Angerer et al., Citation1991; Ashley et al., Citation1992; Brugnone et al., Citation1989a, 1992; Ghittori et al., Citation1995; Hajimiragha et al., Citation1989). In recent years, extraction techniques other than purge and trap, such as solid phase micro-extraction, have been used for the determination of benzene and other volatile aromatic hydrocarbons in blood (Alegretti et al., Citation2004).
These data demonstrate that very sensitive analytical methods exist to measure trace levels of benzene in blood, expired air or urine and that the analytical results are comparable among suitably equipped and highly skilled laboratories in various countries. Nevertheless, no “standardized” analytical methods exist. Furthermore, there is only one external quality assessment scheme applicable to benzene in blood (Angerer et al., 2007); proficiency testing, which assesses the accuracy of laboratories in conducting a particular measurement is not available for the determination of benzene in expired air and in urine.
Biomarker concentrations
The above analytical methods are sufficiently sensitive to detect benzene in practically all blood, urine and expired air samples collected from people living in industrialized countries. More importantly, the sensitivity of these analytical techniques allows for a differentiation between benzene blood levels of rural and urban inhabitants (Brugnone et al., Citation1992) as well as between smokers and non-smokers (Angerer et al., Citation1991; Ashley et al., Citation1994; Brugnone et al., Citation1989a; Hajimiragha et al., Citation1989; Navasumrit et al., Citation2005). Central tendency (i.e. mean, median and geometric mean) blood benzene concentrations for non-smoking general populations generally range from 50 to 200 ng/L and for smokers 100 to 500 ng/L (Angerer et al., Citation1991; Ashley et al., Citation1994; Bergamaschi et al., Citation1999; Brugnone et al., Citation1989a,b; Carrer et al., 2000; Hajimiragha et al., Citation1989; Kirkeleit et al., Citation2006b; Kivisto et al., Citation1997; Kok & Ong, Citation1994; Navasumrit et al., Citation2005, 2008; Ong et al., Citation1996; Perbellini et al., Citation1988; Romieu et al., Citation1999). Urinary benzene is similarly useful in determining differences in benzene exposure between urban and rural residents and smokers from non-smokers. Central tendency urinary benzene concentrations for the non-smoking general population generally range from 0.10 to 0.25 µg/L and for smokers 0.20 to 0.80 µg/L (Ayi Fanou et al., Citation2006; Bergamaschi et al., Citation1999; Fustinoni et al., Citation2005b; Ghittori et al., Citation1995; Kim et al., Citation2006a; Kivisto et al., Citation1997; Kok & Ong, Citation1994; Lagorio et al., Citation1998; Ong et al., Citation1996; Pezzagno et al., Citation1999; Waidyanatha et al., Citation2001). Expired benzene in air is useful in revealing differences in benzene exposure between non-smokers and smokers. Central tendency expired benzene air concentrations for the non-smoking general population generally range from 3 to 32 ng/L and for smokers 14 to 73 ng/L (Brugnone et al., Citation1989a; Egeghy et al., Citation2002; Jo & Pack, Citation2000; Menezes et al., Citation2009; Plebani et al., Citation1999; Wallace & Pellizzari, Citation1987). Thus, benzene levels in tobacco smokers and non-smokers are different when measured in expired air, urine and blood. A study by Perbellini et al. (Citation2003) nicely shows this difference. In a non-smoking group of persons non-occupationally exposed to benzene, Perbellini et al. (Citation2003) found median levels of benzene (in ng/L) of 4.8 (alveolar air), 51.2 (blood) and 66.6 (urine). In smokers, the median levels were 8.9 (alveolar air), 153.6 (blood) and 237.7 (urine).
Conclusion for benzene as a biomarker of exposure
To estimate benzene internal exposure, the determination of benzene in blood is a reliable biomarker of exposure; however, many researchers have used urinary benzene to quantify exposure (). Benzene in expired breath has not proven to be a reliable biomarker for assessing benzene exposure. Breath sampling, transportation and storage considerations, contamination, adsorption, losses and lack of standardized methods, among other factors, have thus far precluded a reliable application of this biomarker on a broad scale (Hays et al., Citation2012; Ong & Lee, Citation1994).
Table 3. Suitability of benzene biomarkers of exposure.
S-phenylmercapturic acid
SPMA derives from the condensation of benzene oxide with glutathione (). SPMA is generally considered a very specific urinary biomarker of benzene. The mean half-life of SPMA ranges from 9 to 13 h; a second phase of slow elimination has an estimated half-life of about 45 h (Boogaard & van Sittert, Citation1996; van Sittert et al., Citation1993). Since accumulation of SPMA is not probable, SPMA should be considered a biomarker of recent exposure, but not for mid- and long-term exposure to benzene.
Analytical methodology
Several analytical methods for the determination of SPMA in urine exist. Extraction of SPMA from the urine matrix can be accomplished by liquid–liquid extraction (LLE) with ethyl acetate or by solid phase extraction (SPE). Then, after derivatization (methylation, butylation or silylation), SPMA can be detected by GC (gas chromatography)/MS with LOD generally in the range 1–5 µg/L (Angerer et al., Citation1998; Jongeneelen et al., Citation1987; Stommel et al., Citation1989; van Sittert et al., Citation1993; Waidyanatha et al., Citation2004). A highly sensitive method (LOD ∼60 ng/L) using electron-capture detection after derivatization with pentafluorobenzylbromide has also been reported (Einig et al., Citation1996). A standardized GC/MS approach for the determination of urinary SPMA was published in Analyses of Hazardous Substances in Biological Materials by the Deutsche Forschungs Gemeinschaft (DFG (Citation1995a), German Research Foundation). Here, SPMA is methylated after extraction with ethyl acetate and subsequently detected by GC coupled to high-resolution MS; the LOD was 1 µg/L.
In addition to the GC approach, several high-performance liquid chromatography (HPLC) methods in combination with ultraviolet (UV) absorption detection (Inoue et al., Citation2000; Jongeneelen et al., Citation1987), diode array detection (Tharnpoophasiam et al., Citation2004), fluorescence detection (Einig & Dehnen, Citation1995; Maestri et al., 1993) and MS (Maestri et al., Citation2005) or tandem MS (Barbieri et al., Citation2004; Lin et al., Citation2004a,b; Melikian et al., Citation1999a,b; Paci et al., 2007) have been developed and successfully applied. In many cases, SPE is used for preconcentrating SPMA from the urine; some methods are designed to determine SPMA and other benzene metabolites in one run. The LODs are often below 1 µg/L, although the most sensitive methods reached LODs of ≤0.2 µg/L (Maestri et al., Citation2005; Melikian et al., Citation1999b; Paci et al., 2007). Besides analytical methods, SPMA can also be measured using a sensitive (LOD = 0.2 µg/L) competitive enzyme-linked immunosorbent assay (Fustinoni et al., Citation2005b). Urinary SPMA is part of the German external quality assessment scheme for analyses in biological materials for occupational benzene monitoring (Angerer et al., 2007). This proficiency testing program is conducted twice a year by the German Society of Occupational and Environmental Medicine.
To account for the relatively short half-life of SPMA, 24 h urine samples are preferable to spot samples. This is essential for the assessment of individual exposure. For cross-sectional studies, spot urine samples, preferably first morning voids could be used. First, morning voids are preferable to other spot urine samples since they are collected at about the same time each day for all participants and the results may better correlate with those from 24 h samples (Kissel et al., Citation2005). However, depending on the pharmacokinetics of the chemical, recent data have indicated that first morning void concentrations may overestimate 24 h urine data (Scher et al., 2007). For specimen sampling, plastic containers do not pose any problems. Stability studies in urine have shown that concentrations did not change for at least 1 month if acidified to pH 2 and stored at 4 °C (van Sittert et al., Citation1993). In low-temperature freezers, storage could be done for several months without loss. A critical point in the determination of urinary SPMA is sample handling since there is the potential for conversion of pre-SPMA to SPMA under acidic conditions. Therefore, the amount of measured SPMA may change as a function both of pH and of storage conditions of the urine specimens. However, in the majority of studies, pH was not considered as a critical factor. A recent study (Paci et al., 2007) showed that a previous hydrolysis procedure can increase SPMA urinary concentrations by factors of up to 5 compared to pH 2 condition and up to 100 when no acid treatment is performed.
Biomarker concentrations
Although SPMA is only a minor (0.01–0.9% of the dose) urinary metabolite of benzene in humans (Boogaard & van Sittert, Citation1995, Citation1996; Ghittori et al., Citation1999; Melikian et al., Citation2002; Stommel et al., Citation1989; van Sittert et al., Citation1993), recent analytical approaches are sensitive enough (LOD ≤1 μg/L) to detect exposure to benzene in the non-smoking general population. In studies from several countries, the central tendency of SPMA urinary concentrations ranged from 0.5 to 9 µg/L and 0.3 to 8.9 µg/g creatinine in the non-smoking general population (Aston et al., Citation2002; Ayi Fanou et al., Citation2006; Boogaard & van Sittert, Citation1995, Citation1996; Einig et al., Citation1996; Fustinoni et al., Citation2005a,Citationb; Ghittori et al., Citation1995, Citation1999; Kim et al., Citation2006a; Kivisto et al., Citation1997; Maestri et al., Citation1993, Citation2005; Melikian et al., Citation1999b; Navasumrit et al., Citation2008; Pople et al., Citation2002; Qu et al., Citation2000). In general, non-occupationally exposed smokers show higher SPMA levels in urine (central tendency values ranged from 0.76 to 18 µg/L and 0.3 to 9.9 µg/g creatinine) compared to non-smokers (Boogaard & van Sittert, Citation1996; Einig et al., Citation1996; Fustinoni et al., Citation2005a; Ghittori et al., Citation1995; Kim et al., Citation2006a; Kivisto et al., Citation1997; Maestri et al., Citation2005; Melikian et al., Citation1999b). Moreover, SPMA correlated well with personal exposure to benzene starting from low concentrations (Dor et al., Citation1999) and with urinary concentrations of benzene or other benzene metabolites (Boogaard & van Sittert, Citation1995; Melikian et al., Citation2002).
Background sources
There are no known endogenous or exogenous sources of SPMA.
Conclusion for SPMA as a biomarker of exposure
Based on the existing data, the urinary concentration of SPMA is a reliable parameter to determine internal benzene exposures from recent sources even for purposes of environmental medicine (). This applies at least for cross-sectional studies comparing the exposure of groups of the population.
Trans,trans-muconic acid
ttMA is the oxidized product of trans,trans-mucondialdehyde, which results from the oxidative ring opening of benzene (). The excreted amount of ttMA (2–25% of the total benzene uptake) in urine shows an inverse dose relationship (i.e. the higher the dose of benzene, the lower the relative excreted amount of ttMA) (Boogaard & van Sittert, Citation1996; Inoue et al., Citation1989; Yu & Weisel, Citation1996b). The half-life of ttMA is estimated to be 5.1 ± 2.3 h (Boogaard & van Sittert, Citation1995; Johnson & Lucier, Citation1992). ttMA is used as a biomarker for occupational benzene exposure for benzene air concentrations of greater than 0.5 ppm (American Conference of Governmental Industrial Hygienists (ACGIH), Citation2007).
Analytical methodology
For determination of low levels of ttMA, most analytical methods are based on either GC/MS (Bechtold et al., Citation1991; Ruppert et al., Citation1995; Waidyanatha et al., Citation2004; Weaver et al., Citation1996) or HPLC/UV detection (Lee et al., Citation2005; Marrubini et al., Citation2001; Olmos et al., Citation2006; Scherer et al., Citation1998; Serena et al., Citation2000; Shahtaheri et al., Citation2005; Tharnpoophasiam et al., Citation2004; Wiwanitkit et al., Citation2001). Drawbacks of the HPLC/UV methods may be the non-specific detection and the resulting need for a precise chromatographic separation. On the other hand, a limitation of the GC/MS methods is the need for derivatization procedures, which can be an additional source of error. Recently, capillary electrophoresis (Coutrim et al., Citation1997) and LC/MS techniques have been used (Barbieri et al., Citation2004; Lin et al., Citation2004a; Marchese et al., Citation2004; Melikian et al., Citation1999a,b). The sample preparation techniques include mainly LLE or SPE. For LLE, the urine is acidified and ttMA is extracted with an organic solvent (e.g. diethyl ether). Most extractions using SPE techniques rely on (strong) anion exchange sorbent materials. The LLE extract or SPE eluate is evaporated to dryness and reconstituted before derivatization (for GC) or adjusted to a defined volume prior to injection (for HPLC). The LODs range from 0.1 mg/L (e.g. Inoue et al., Citation1989) to 0.005 mg/L (e.g. Lee et al., Citation2005). ttMA is stable in urine over a period of 9 months if stored at −20 °C in the dark (Melikian et al., Citation1994). For application in environmental medicine, the use of the more specific GC/MS and HPLC/MS/MS methods are advisable. A standardized method, mainly applicable to occupational settings, was published by the German Research Foundation (DFG, Citation1995b). ttMA is separated from acidified urine by anion exchange chromatography, followed by HPLC/UV detection (LOD = 0.1 mg/L).
For quality assurance, the determination of urinary ttMA in the occupational concentration range is included in a round robin program carried out twice a year by the DGAUM (German Society of Occupational and Environmental Medicine; Institute of Occupational, Social and Environmental Medicine at University Erlangen/Nuremberg, Germany). The Finnish Institute of Occupational Health also offers a round robin for ttMA in the occupational concentration range.
Biomarker concentrations
The mean or median urinary ttMA concentrations range from 30 µg/g creatinine to 300 µg/g creatinine among non-occupationally benzene exposed populations (Amodio-Cocchieri et al., Citation2001; Fustinoni et al., Citation2005b; Kim et al., Citation2006a; Melikian et al., Citation2002; Navasumrit et al., Citation2005; Pezzagno et al., Citation1999; Qu et al., Citation2000; Scherer et al., Citation1998; Waidyanatha et al., Citation2004; Weaver et al., Citation2000). Smoking habits significantly influence ttMA levels (Buratti et al., Citation1996; Fustinoni et al., Citation2005b; Ghittori et al., Citation1995, 1996; Lauwerys et al., Citation1994; Lee et al., 1993; Melikian et al., 1993, 1994; Ong et al., Citation1994; Ruppert et al., Citation1995, 1997). Specifically, smokers had 1.4–4.8 times higher urinary ttMA concentrations than non-smokers and a mean additional amount of excreted ttMA of 0.1 mg/g creatinine. On a group basis, urinary ttMA concentrations allow discrimination between smokers and non-smokers. Individuals living near or being in areas with high traffic density can have slightly higher urinary ttMA levels (Amodio-Cocchieri et al., Citation2001; Scherer et al., Citation1995; Weaver et al., Citation1996). In contrast, other researchers found that traffic density did not result in significant differences in urinary levels of ttMA among children from urban and rural areas (Barbieri et al., Citation2002).
Background sources
Higher than background concentrations of ttMA that are not explained by environmental benzene exposure may partly be due to dietary habits (). ttMA is a metabolite of sorbic acid and sorbates can be present in various foodstuffs at concentrations up to 800 mg/kg (Luck, Citation1990; Ruppert et al., Citation1997; Serrano et al., Citation1991; van Dokkum et al., 1982; Yu & Weisel, Citation1996b). For example, dietary supplementation with 500 mg sorbic acid significantly increased the mean urinary ttMA excretion from 0.08 mg/24 h to 0.88 mg/24 h in eight non-smokers although only 0.12% of the sorbic acid dose was excreted in urine as ttMA (Ruppert et al., Citation1997). The authors concluded that a typical dietary intake of 6–30 mg/d sorbic acid accounts for 10–50% of the background ttMA excretion in non-smokers, and for 5–25% in smokers (Ruppert et al., Citation1997). In another study, the mean urinary ttMA concentrations increased 20-fold after the administration of 447 mg sorbic acid in smokers and non-smokers (Pezzagno et al., Citation1999). The authors concluded that only 25% of ttMA can be attributed to benzene and that ttMA is not a sufficiently specific biomarker of low benzene exposure (Pezzagno et al., Citation1999). Furthermore, in the case of occupational coexposure to toluene, ttMA urinary levels were suppressed (Inoue et al., Citation1989). Human genetic factors, primarily polymorphisms in benzene metabolizing enzymes, can influence the levels of ttMA excreted in urine (Gobba et al., Citation1997; Johnson & Lucier, Citation1992; Rossi et al., Citation1999). For example, Gobba et al. (Citation1997) observed a bimodal distribution of urinary ttMA collected from bus drivers. One group was classified as “poor ttMA metabolizers” and the second as “efficient ttMA metabolizers”. Efficient “ttMA metabolizers” may be at a higher risk of benzene toxicity because trans,trans-mucanaldehyde, the parent of ttMA is myelotoxic.
Table 4. Non-benzene sources of benzene urinary metabolites.
Conclusion for ttMA as a biomarker of exposure
Based on the above findings, although specific and sensitive analytical methods for the determination of ttMA in urine exist, this biomarker specificity is inadequate for the assessment of environmental benzene exposure when dietary sources are present, which is usually the case for western populations ().
Phenol, catechol and hydroquinone
In humans, phenol is the primary metabolite of benzene excreted in the urine accounting for 70–88% of the total urinary metabolites () (Inoue et al., Citation1988; Kim et al., Citation2006b). Both catechol and hydroquinone are formed by enzymatic hydroxylation of the intermediate phenol (). Catechol is also generated from benzene dihydrodiol (Snyder & Hedli, Citation1996b). Phenol and its metabolites are conjugated with either sulfate or glucuronic acid. Elimination half-lives have been estimated to be around 13, 15 and 16 h for hydroquinone, catechol and phenol, respectively (Qu et al., Citation2000).
Analytical methodology
A number of GC and HPLC methods have been described for the determination of phenol in the past 30–40 years (Angerer & Horsch, Citation1992; Weisel, 2010). Non-benzene sources of phenol result in sufficiently high urinary excretion >0.3 mg/l such that sensitive methods are not required. Phenol excreted in urine, is generally bound to sulfate and glucuronic acid; therefore, mineral acids or enzymes are used for hydrolysis and determination of total urinary phenol. A typical GC procedure for phenol and phenol isomers utilizes a capillary column with flame ionization detector (FID). The urine samples are acidified with sulfuric acid and steam distilled, giving effective hydrolysis and separation of the phenols. The LOD is 0.3 mg/L, which could be lowered further (DFG, Citation1995a). Similar methods have been developed using packed columns and a less effective clean up procedure, achieving a LOD of 1 mg/L (IARC, Citation1988). HPLC procedures using reversed phase columns and UV or fluorescence detection have also been used for the determination of phenol in urine. Again steam distillation in combination with hydrolysis is used achieving LODs of 0.5 mg/L (Angerer, Citation1979; Murray & Adams, Citation1988).
After hydrolysis of the urinary conjugates and derivatization by silylation, hydroquinone and catechol can be measured simultaneously using GC coupled with flame ionization (Hotz et al., Citation1997) or mass spectrometric detection (Kim et al., Citation2006a; Rothman et al., Citation1998; Waidyanatha et al., Citation2004). Methods based on HPLC with UV detection (Inoue et al., Citation1988), variable-wavelength fluorimetric detection (Lee et al., 1993) and tandem MS detection (Qu et al., Citation2000) have been reported. Most of these analytical methods also include phenol and in some cases additional benzene metabolites (Kim et al., Citation2006a; Waidyanatha et al., Citation2004). The sensitivity of these methods is generally sufficient for the determination of urinary levels of catechol and hydroquinone in the non-smoking general population.
Biomarker concentrations
Reported urinary phenol concentrations (central tendency values) in the general population from countries in Asia and Europe range from 3 to 16 mg/L (Angerer, Citation1983; Ducos et al., Citation1992; Hotz et al., Citation1997; Inoue et al., Citation1988; Kim et al., Citation2006a,b; Ong et al., 1995, 1996; Qu et al., Citation2000; Stommel et al., Citation1989; Waidyanatha et al., Citation2004).
Mean urinary concentrations of catechol and hydroquinone in non-exposed control groups from Asia and Belgium (non-smokers and smokers) are in the range of 1.3 mg/g creatinine to 7.2 mg/g creatinine and 0.4 mg/g creatinine to 4.3 mg/g creatinine, respectively (Hotz et al., Citation1997; Ong et al., 1995; Qu et al., 2000).
Background sources
Phenol has a number of non-benzene sources that confound the interpretation of air benzene exposure up to a concentration of approximately 5 ppm (Inoue et al., 1986) (). McDonald et al. (Citation2001) estimate that humans ingest or produce endogenously (through the conversion of proteins such as tyrosine or other simple phenols in the gut) approximately 0.2 mg/kg-body weight (bw) of phenol per day. Phenol is detected in cigarette smoke (Hoffmann & Wynder, 1986), and over the counter medicines have been shown to increase phenol excretion in the urine up to 40-fold (Fishbeck et al., Citation1975; McDonald et al., Citation2001).
Catechol and hydroquinone are present in many foodstuffs and are also formed in the human metabolism of amino acids (Lee et al., 1993) (). Hydroquinone occurs naturally in plants as a glucose conjugate, arbutin (Deisinger et al., Citation1996). McDonald et al. (Citation2001) estimate that humans ingest or endogenously produce 0.3 mg/kg-bw of catechol and 0.1 mg/kg-bw of hydroquinone. Therefore, the base-line excretion of these substances in urine of unexposed persons is relatively high. Furthermore, considerable human exposure to these substances can also result from cigarette smoking (Brunnemann et al., Citation1976; Deisinger et al., Citation1996; Melikian et al., 1993). In particular, smokers were found to have 1.5–2 times higher urinary levels of catechol and hydroquinone compared to non-smokers (Kim et al., Citation2006a; Lee et al., 1993). In several studies, unexposed subjects could not be distinguished from workers exposed to low benzene levels by the urinary concentrations of catechol and hydroquinone. Unambiguous elevations in urinary levels of catechol and hydroquinone were observed at benzene air levels of 0.5 ppm or even much higher, respectively, whereas environmental air levels are generally lower than 0.01 ppm (Inoue et al., Citation1988; Kim et al., Citation2006a; Lee et al., 1993; Qu et al., Citation2000).
Conclusion for phenol, catechol and hydroquinone as biomarkers of exposure
Due to their lack of specificity for assessing exposure to benzene, phenol, hydroquinone and catechol are not suitable biomarkers for the assessment of environmental or even occupational benzene exposure (). However, with regard to benzene’s mechanism of action, metabolism to phenol and other phenolic compounds may be important (see “Mode of action” section).
DNA and protein adducts of benzene
Electrophilic substances may react with nucleophilic groups in macromolecules such as DNA or protein in the human body, forming an adduct. Adducts with DNA demonstrate the mutagenic potential of a chemical compound. However, most DNA adducts are rapidly repaired and eliminated from the human body (Singh & Farmer, Citation2006). Currently, it is only possible to determine DNA adducts for a limited number of chemicals and to use them as parameters in human biomonitoring (Needham et al., 2007). Furthermore, while the ability to form DNA adducts is one important consideration, where (the gene or genes impacted) the adduct occurs in DNA is even more important. It has been shown for various DNA-reactive compounds that there is a constant ratio between their DNA and hemoglobin adducts. Therefore, it is possible to measure effective, internal exposure of DNA to certain substances by determining the corresponding hemoglobin adducts (Neumann, Citation1984; Osterman-Golkar et al., Citation1976). Smaller hemoglobin adducts do not influence the average lifespan of an erythrocyte (120 d). Therefore, hemoglobin adducts tend to accumulate in the human body and their analytical determination is now routinely possible. Hemoglobin adducts are thought to be ideal surrogates of DNA adducts since, in contrast to DNA, hemoglobin can be isolated in large quantities from small blood samples (Angerer et al., 2007; ECETOC, Citation1989). A further advantage of hemoglobin adducts as biomarkers is that electrophilic intermediates have to pass cell membranes prior to the reaction with hemoglobin in a similar way as required for the formation of DNA adducts. For the latter adducts to occur, the electrophilic intermediates have to cross the nuclear membrane. The stability of the electrophilic intermediates is shown by their ability to cross the membranes similar to DNA-reactive species. Serum albumin adducts, which have a half-life of about 21 d in humans (Rappaport et al., Citation2002), may also be useful indicators for the electrophilic and mutagenic properties of chemical substances. Like the hemoglobin adducts, the reaction of the electrophilic intermediate with serum albumin would first require the intra-cellular formation of the intermediate followed by its permeation across a cell membrane to the blood.
DNA adducts of benzene
It is well established that benzene is metabolized to reactive intermediates that are able to covalently bind to nucleophilic sites of cellular macromolecules including nucleic acids in DNA. Benzene metabolites that bind to DNA are benzene oxide (Lindstrom et al., Citation1997; Norpoth et al., 1988, 1996), benzoquinones (Gaskell et al., Citation2002; Levay et al., Citation1991; Pongracz & Bodell, Citation1991), hydroquinone (Bodell et al., Citation1996; Gaskell et al., Citation2005a,b) and muconaldehyde (Bleasdale et al., Citation1996).
In animal experiments, covalent binding of benzene metabolites to DNA, which is generally believed to be an initiating event in benzene carcinogenesis, has been shown to occur in several tissues by radiochemical analyses (Arfellini et al., Citation1985; Lutz & Schlatter, Citation1977; Mazzullo et al., Citation1989; Snyder et al., Citation1978a,Citationb; Turteltaub & Mani, Citation2003).
After in vitro reaction of deoxyguanosine with p-benzoquinone and hydroquinone, deoxyguanosine–benzoquinone adducts have been found and partly characterized (Gaskell et al., Citation2005a,Citationb; Jowa et al., Citation1990; Snyder & Hedli, Citation1996; Snyder et al., Citation1987). With 32P-postlabeling coupled to HPLC, the 2′-deoxycytidine-3′-phosphate adduct was shown to be the major adduct formed by the reaction of p-benzoquinone and DNA. Hydroquinone formed one single detectable deoxyguanosine DNA adduct, which was a minor product of the reaction of DNA with p-benzoquinone (Gaskell et al., Citation2005a,Citationb).
In vivo experiments confirm the formation of DNA adducts in several tissues as well as in leucocytes of mice that were dosed 500 mg/kg benzene i.p. (Li et al., Citation1996). The analysis of DNA from white blood cells shows the same adduct pattern as DNA extracted from bone marrow. After separation of the modified nucleotides with multidimensional thin layer chromatography, one major and one minor adduct was detected (Levay et al., Citation1996). The first experiments using HL-60 cells (a human promyelocytic cell line) verified in co-chromatographic experiments that the DNA adducts with hydroxyquinone were the same as those formed in vivo with benzene in bone marrow (Bodell et al., Citation1993, Citation1996).
So far, DNA adducts of benzene have not been detected in humans. The covalent binding index of benzene to DNA may be too low to form measurable benzene DNA adduct levels by applying the currently available analytical methods.
Protein adducts of benzene
The reaction products of benzene oxide with cysteine of hemoglobin and plasma albumin specifically indicate an internal exposure to benzene. The existence of hemoglobin adducts after exposure to benzene was demonstrated in blood samples of mice and rats (Pereira & Chang, Citation1981; Sabourin et al., Citation1990; Sun et al., Citation1990). S-phenylcysteine is formed by the reaction of benzene oxide with the sulfhydryl group of cysteine of hemoglobin and serum albumin in animals and humans (Bechtold et al., Citation1992a,b; Lindstrom et al., Citation1998; Yeowell-O’Connell et al., Citation1998). S-(2,5-dihydroxyphenyl) cysteine and S-(2,3-dihydroxyphenyl)cysteine, the 1,2- and 1,4-benzoquinone adducts of hemoglobin and albumin are formed in animals and humans by binding of 1,2- and 1,4-benzoquinone to cysteine after exposure to benzene (Melikian et al., Citation1992; Waidyanatha et al., Citation1998).
Several analytical assays for the determination of the adducts of benzene oxide with cysteine of hemoglobin and albumin as well as with N-terminal valine of hemoglobin have been developed, validated, published in the peer reviewed literature, and applied to benzene exposed workers and unexposed control groups. All published methods to determine cysteine adducts of benzene oxide in hemoglobin are GC/MS methods and use a similar procedure following extraction of the globin from the red blood cells and subsequent hydrolysis. Deuterated S-phenylcysteine is used as an internal standard. The LOD are 20 pmol/g hemoglobin to 500 pmol/g hemoglobin (Bechtold et al., Citation1992a; Hanway et al., Citation2000; Yeowell-O’Connell et al., Citation1996, Citation1998). The method by Yeowell-O`Connell et al. for the determination of cysteine adducts of benzene oxide in hemoglobin was adapted for the determination of the analogous adduct in albumin with a LOD of 54 pmol/g albumin (Lindstrom et al., Citation1998; Yeowell-O’Connell et al., Citation1998).
Melikian et al. developed a method for the determination of 1,4-benzoquinone adducts of hemoglobin. The globin is isolated, hydrolyzed and the benzoquinone adducts are separated by HPLC. After derivatization with acetic anhydride and methanesulfonic acid the samples are again purified by HPLC and subsequently measured by GC/MS (Melikian et al., Citation1992). Another method for the determination of 1,2- and 1,4-benzoquinone adducts of hemoglobin and albumin is described by Waidyanatha et al. The protein is reacted with trifluoroacetic anhydride and methanesulfonic acid and after extraction, the adducts are analyzed by GC/MS in NCI mode with a LOD of 20 pmol/g protein (Waidyanatha et al., Citation1998).
A review on benzene oxide adducts in hemoglobin and albumin has been published by Johnson et al., Citation2007. The cysteine adduct of benzene oxide in hemoglobin was not detected in workers exposed to up to 28 ppm benzene in air, due to the high LOD of 500 pmol/g hemoglobin (Bechtold & Henderson, Citation1993). Improvements of the methods lowered the LOD and allowed the determination of the benzene oxide adduct in cysteine of hemoglobin in controls and workers with a median level of 32 pmol/g globin for the control group and 47 and 129 pmol/g globin for workers exposed to ≤31 ppm and >31 ppm benzene, respectively, with a significant correlation between the formation of hemoglobin adducts and benzene exposure (Yeowell-O’Connell et al., Citation1998). A follow-up study with a higher number of study subjects (n = 87) produced very similar values (Yeowell-O’Connell et al., Citation2001). Studies on benzene oxide–cysteine adducts in albumin showed a correlation between the exposure levels of benzene in air and the formation of these adducts in albumin. Differentiation between exposed workers and controls was possible (Bechtold & Henderson, Citation1993). A study on controls (n = 19) and workers exposed to ≤31 ppm (n = 7) and >31 ppm (n = 12) benzene, respectively, reported median benzene oxide–cysteine adduct levels of 103, 351 and 2010 pmol/g albumin (Yeowell-O’Connell et al., Citation1998).
Background levels in commercial human proteins were found to be 1.6 nmol 1,2-benzoquinone adduct/g hemoglobin and 0.85 nmol 1,4-benzoquinone adduct/g hemoglobin in hemoglobin and 1.6 nmol 1,2-benzoquinone adduct/g albumin and 8.9 nmol 1,4-benzoquinone adduct/g albumin in albumin (Waidyanatha et al., Citation1998). Problems occurred in further studies on workers exposed to benzene with the previous mentioned method. The derivatized 1,2-benzoquinone adducts in hemoglobin and albumin were unstable and could not be measured reproducibly, due to the lack of a suitable internal standard. The 1,4-benzoquinone adduct in hemoglobin gave irreproducible results as well (Yeowell-O’Connell et al., Citation2001). Therefore, deuterated internal standards of 1,2- and 1,4-benzoquinone adducts were used in an advanced method (Lin et al., Citation2006). Median levels of 1,4-benzoquinone-albumin adducts were determined to be 2110, 5850 and 13 800 pmol/g albumin for controls and workers exposed to ≤31 ppm and >31 ppm benzene, respectively (Yeowell-O’Connell et al., Citation2001). The high levels of 1,4-benzoquinone adducts in albumin were related to demographics, diet and lifestyle factors in a follow-up study with persons occupationally not exposed to benzene (Lin et al., Citation2006). Among others, the background levels are due to phenol and hydroquinone derived from the diet (McDonald et al., Citation2001). Therefore 1,2- and 1,4-benzoquinone adducts are not specific to benzene exposure (Bader & Angerer, Citation1995).
Conclusion for DNA and protein adducts of benzene as biomarkers of exposure
To date, DNA adducts of benzene metabolites cannot be used as biomarkers mainly due to the lack of sensitive and specific analytical methods to measure such adducts. In contrast, adducts of benzene oxide with hemoglobin or plasma proteins, regarded as surrogates of the DNA adducts, are potential markers of exposure. Adducts of benzene metabolites other than benzene oxide are diagnostically unspecific. The correlations between air benzene concentrations and blood adduct levels of benzene oxide in investigations of benzene exposed workers and controls suggest that hemoglobin adducts might be diagnostically less sensitive than adducts of plasma proteins, and support the use of protein adducts of benzene oxide as biomarkers. In addition, serum albumin adducts have a relatively long half-life (about 21 d) compared to benzene in blood or urine and SPMA in urine. Unfortunately, the analytical methods for the determination of hemoglobin and plasma protein adducts are not sensitive enough to monitor environmental exposures. Moreover, reproducibility and reliability data of these analytical methods only exist for one laboratory. Taken together, these considerations suggest that the determination of hemoglobin and protein adducts of benzene is not viable for routine use in environmental medicine or as exposure biomarkers.
Common Criteria and biomarkers/analytical methodology
Overall, benzene in blood and urine and SPMA in urine are the most relevant and valid biomarkers (WHO, Citation2001) for interpreting benzene exposure in a risk-based context, and these biomarkers meet most of the Common Criteria questions related to biomarkers/analytical methodology (). Analytical methodologies for these biomarkers are specific and sensitive enough to evaluate general population exposure to benzene. Laboratory external quality assessment schemes are available to test the proficiency (i.e. an assessment of the accuracy of laboratories in conducting a particular measurement) of measuring benzene in blood and SPMA in urine, but not for benzene in urine. Sampling strategies for most of the identified studies evaluated here included some perspective on lifestyle or occupation that could be confounders or contribute to additional unmeasured sources of benzene. In the studies that measured benzene in blood, the sampling strategy did consider loss of the compound from metabolism and/or volatilization. Some of the studies that used SPMA did consider the stability of this biomarker of exposure as part of the evaluation while other studies did not.
Benzene in blood, urine or expired breath unequivocally indicates the uptake of benzene. However, because of the short half-life of benzene, its concentrations in these biological matrices reflect only recent exposure. Under identical conditions of exposure and because of the lipophilic properties of benzene, its concentration in blood is higher than in urine or expired breath. Therefore, benzene blood levels are diagnostically the most sensitive of these three measures and enable an assessment of background exposure among different population groups. However, blood sampling requires invasive collection methods which may trigger ethical dilemmas. Furthermore, the amount of blood that can be obtained and the frequency of sampling is limited, especially in environmental studies with children and elderly. As a consequence, benzene levels in urine are nowadays being discussed as an alternative to benzene blood levels. Measuring benzene in urine, however, is hampered by possible contamination. Similarly, benzene in expired breath has not proven to be a reliable biomarker for assessing benzene exposure. Breath sampling, transportation and storage considerations, contamination, adsorption, losses, and lack of standardized methods, among other factors, have thus far precluded a reliable application of this biomarker on a broad scale (Hays et al., Citation2012; Ong & Lee, Citation1994).
SPMA is considered to be the most specific metabolite of benzene. To date, there is no other known precursor of SPMA in urine. By contrast, all other metabolites of benzene lack diagnostic specificity and are not suitable for assessing benzene exposure in environmental risk assessment. Moreover, SPMA in urine is a diagnostically sensitive parameter that not only is suitable for assessing benzene background exposure among non-smokers, but also can be used to discriminate between smokers and non-smokers. Because of its longer half-life in urine compared to that of benzene in blood, SPMA reflects a longer window of exposure (e.g. ∼24 h). The drawback of using SPMA as a biomarker is that it is a metabolic detoxification product and does not produce benzene toxicity; therefore, its use for anything other than evaluating potential exposure is limited.
The urinary metabolites ttMA, phenol, hydroquinone and catechol, have non-benzene sources such as the diet and are not useful for determining benzene exposure at air benzene exposure concentrations below 0.2–0.5 ppm for ttMA, 0.5–5 ppm for phenol, 0.5 ppm for hydroquinone and 2 ppm for catechol (ACGIH, Citation2007; Arnold et al., Citation2010; Kim et al., Citation2006a; McDonald et al., Citation2001; Weaver et al., Citation2000). However, urinary ttMA is recommended for occupational monitoring by ACGIH and the German Research Foundation and may be useful where dietary background sources will be negligible. When the purpose is to evaluate potential benzene toxicity or evaluating the potential mode of action of benzene, measuring these metabolites may be important; however, it is important to account for the impact of background sources.
While hemoglobin and plasma protein adducts of benzene metabolites are promising biomarkers of exposure because of their longer half-life in the body, unfortunately, they are not sensitive enough to monitor environmental exposures.
General population biomonitoring studies generally do not include considerations of toxicokinetics. In addition, all the studies evaluated here used blood or urine spot samples. This has the potential to either underestimate or overestimate exposure depending upon when the sample was collected relative to when the exposure occurred. Application of a PBPK model can provide some additional perspective. Such a model could provide predictions on the kinetics and tissue levels of benzene metabolites and link biomarker concentrations to adverse effects. Single urine samples could be useful for cross-sectional screening of populations for exposure, while 24 h collections would be more appropriate for assessing individual exposures. Serial measurements of several biomarkers over a longer time frame are probably necessary to understand health effects, although this is not usually feasible.
Risk assessment/risk characterization
The wealth of benzene biomonitoring data, PBPK information and toxicity data allows for a robust risk assessment evaluation. Inhalation exposure to benzene occurs on a daily basis since benzene, a volatile solvent, is used as an industrial chemical and is a natural component of petroleum products and tobacco smoke. Because benzene has been classified as a known human carcinogen based upon studies of highly exposed workers (Baan et al., Citation2009), it is generally accepted that exposure to benzene should be minimized (Boogaard & van Sittert, Citation1996). For the general population, exposure to benzene is likely highly intermittent and orders of magnitude lower than the aforementioned studies. Current occupational exposures in the US and Europe are also much lower today since industrial hygiene controls are in place to limit excessive exposure to benzene. In the occupational setting, the measurement of airborne benzene concentrations and biomonitoring are important tools used to manage benzene exposure. Benzene biomonitoring data linked to the benzene occupational standard have been used for over 20 years (ACGIH, Citation2001). Only recently have reliable large-scale benzene biomonitoring data become available for the general population (CDC, Citation2009). In addition, a number of small targeted biomonitoring studies are available. To derive risk estimates for benzene, we considered the Common Criteria related to benzene biomarkers of exposure, PBPK models, toxicity data and biomonitoring guidance values (i.e. human tissue levels equivalent to exposure at defined toxicological/regulatory benchmark concentrations) to compare to general population and worker biomonitoring data.
Relevant toxicology data
The major portion of the toxicology data in humans are from inhalation studies, which is the most relevant exposure route in humans. These are primarily occupational exposure studies from the manufacture and use of benzene. While benzene has acute toxicities, the adverse health effects that most likely affect people are from chronic exposure. These include hematotoxicity, with the most severe non-cancer effect being aplastic anemia and cancer primarily in the form of AML. For the “Risk characterization” section, the key toxicological studies used by US and European Union (EU) government authorities for cancer and non-cancer endpoints are considered () for derivation of biomonitoring guidance values and comparison to biomonitoring data.
Table 5. Air exposure levels corresponding to toxicological endpoints for the general public.
Relationship between the biomarker of exposure and known human health effect
Ideally the biomarker of choice would directly correlate with a known human health effect; thereby, allowing a direct comparison of exposure to toxicity and potential risk. As described earlier, many of the biomarkers of benzene exposure are likely responsible for known human health effects such as AML and hematotoxicity, since it is generally agreed that benzene must be metabolized to exert effects (Andrews et al., Citation1977; Ross, Citation1996; Valentine et al., Citation1996). Thus, conversion of benzene to metabolites and the action of these metabolites is necessary for toxicity. However, the precise metabolites responsible for effect remain elusive, and many have proposed that a combination of metabolites is likely to be responsible for toxic effects (Medinsky et al., Citation1995; Snyder & Hedli, Citation1996; Witz et al., Citation1996).
The two most studied health effects of benzene in humans are hematotoxicity and cancer, specifically leukemia. Leukemia, especially AML, is a rare chronic disease that is thought to result from multiple and interacting environmental and genetic components, likely experienced over years (Linet et al., Citation2006). Thus, linking benzene exposure biomarkers to leukemia outcomes is difficult at best, since large population sizes and serial biomarker exposures over time would be the preferred approach. Furthermore, there would need to be an initial genetic characterization of that population to identify potential genetic factors that might increase susceptibility. This would necessitate a number of privacy and ethical considerations. No such studies have been reported, and it may be fortuitous if a single measurement of a benzene biomarker correlates with leukemia.
Since hematotoxicity can be a more prevalent outcome than leukemia as a result of benzene exposure, and hematotoxicity may not require years of exposure, some authors have attempted to link biomarkers of benzene to such effects in humans. Rothman et al. (Citation1996), who found significant decreases in white blood cells, lymphocytes, and increases in mean corpuscular volume in Chinese benzene workers, also examined these indices against phenol, ttMA, hydroquinone and catechol measurements in urine. Lymphocytes were significantly related to only hydroquinone, while mean corpuscular volume was significantly increased for higher levels of hydroquinone, ttMA and catechol, but not phenol. Also, Qu et al. (Citation2002) reported significantly decreased red blood cells, white blood cells and neutrophils for increases in phenol, SPMA, ttMA and albumin adducts. Slightly stronger relationships were seen for neutrophils, although Qu et al. (Citation2002) note that correlation coefficients were small, and none of the exposure markers predicted a further depression in blood counts, beyond what was predicted from benzene air concentrations.
Overall, there is no convincing evidence that a single exposure biomarker of benzene is strongly related to frank disease such as pancytopenia, aplastic anemia, MDS or AML. Some studies have attempted to link milder indices of hematotoxicity to single exposure biomarkers, although it is more likely that there is a complex relationship to a combination of exposure biomarkers and early benzene-induced disease. Therefore, the valid biomarkers of exposure detailed above (benzene in blood and urine and SPMA in urine) will be used for evaluating benzene exposure. However, ideally the combination of biomarkers that relate to disease will need to be identified before specific blood levels of benzene can be evaluated in the context of disease.
Pharmacokinetic data
As described in the “Pharmacokimetics models” section, there are a number of existing human PBPK models for benzene (Bois et al., Citation1996; Brown et al., Citation1998; Sinclair et al., Citation1999; Travis et al., Citation1990; Yokley et al., Citation2006). The approach by Hays et al. (Citation2012) that applied the PBPK model of Brown et al. (Citation1998) to derive a Biomonitoring Equivalent value for benzene in blood is used here. The model parameters are listed in .
Benchmarks
General population benchmarks
Non-cancer endpoints
The USEPA RfC for chronic inhalation exposure of benzene is 3 × 10⁻² mg/m3 (0.009 ppm) (USEPA, Citation2003). This value is based on benchmark dose modeling of data of decreased lymphocyte count in highly exposed workers (Rothman et al., Citation1996). The lower bound 95th percentile benchmark concentration (BMCL) is 8.2 mg/m3 (2.6 ppm). An overall uncertainty factor of 300 is applied to the BMCL to derive the RfC. The European Chemicals Bureau risk assessment derived a no observed adverse effect concentration of 3.2 mg/m3 (1 ppm) based upon decreased lymphocyte count in workers (European Commission Joint Research Center Institute for Health and Consumer Protection, Citation2008). The USEPA RfC is used here to determine the biomonitoring guidance value and comparison to biomonitoring data.
Cancer endpoints
The USEPA classifies benzene as a Group A (known human) carcinogen for all routes of exposure. This characterization is based upon significantly increased risk of leukemia in highly exposed workers and is supported by evidence from animal studies. The USEPA inhalation unit risk for an increase in lifetime risk for an individual exposed for a lifetime to 1 µg/m3 benzene in air ranges from 2.2 × 10⁻⁶ to 7.8 × 10⁻⁶ (USEPA, Citation2003). For a calculated risk level of 1 × 10⁻⁵, this translates to a concentration range 1.3 to 4.5 µg/m3. Since benzene has been classified as a Category 1 carcinogen (known human), the EU assumes no safe level of exposure; however, an Air Quality Standard of 5 µg/m3 for benzene has been set (Directive 2008/50/EC), which is similar to the upper range of the USEPA air concentration corresponding to a calculated risk level of 1 × 10⁻⁵. The average (2.9 µg/m3, 0.0009 ppm) of the concentration range corresponding to a calculated risk level of 1 × 10⁻⁵ is used here to determine the biomonitoring guidance value.
Occupational benchmarks
The Occupational Safety and Health Administration TWA and the EU Indicative Occupational Exposure Level for benzene is 3.2 mg/m3 (1 ppm). The ACGIH threshold limit value (TLV) is 0.5 ppm. ACGIH derived Biological Exposure Indices (BEI) of 25 µg SPMA/g creatinine and 500 µg ttMA/g creatinine (post-shift sampling) that correspond to the TLV. The MAK committee of the German Research Foundation does not derive BAT (biological tolerance value for occupational exposures) or MAK (maximum concentration at the workplace) values out of the principle that no exposure to established human carcinogens can be “acceptable” or “tolerated”. Instead, so-called EKA (exposure equivalents for carcinogenic working substances) values are derived, which allow estimation of the resulting concentrations of benzene blood, urinary SPMA or urinary ttMA exclusively due to uptake of benzene by inhalation (DFG, 2007). The BEI values relating to the ACGIH TLV of 0.5 ppm will be used for this assessment.
Risk characterization
For risk characterization, the biomarkers of exposure (i.e. benzene in blood, benzene in urine and urinary SPMA) were related to toxicological/regulatory benchmarks to derive a biomonitoring guidance value for each biomarker to compare to the biomonitoring data for the general population.
For blood benzene, the biomonitoring equivalent value (Hays et al., Citation2012) relating to the USEPA non-cancer and cancer endpoints was used. For the non-cancer endpoint, Hays et al. (Citation2012) derived a human equivalent point of departure of 4400 ng/L giving a final biomonitoring equivalent value of 150 ng/L (accounting for intra-species uncertainty and database completeness). The Biomonitoring Equivalent value corresponding to 1 × 10⁻⁵ theoretical cancer risk ranged from 5.8 ng/L to 20.4 ng/L; the average value of 13.1 ng/L is used for this assessment.
To relate urinary benzene and SPMA measurements to toxicological/regulatory benchmarks, the same approach outlined for the ACGIH BEI for benzene is used here whereby published linear regression equations that relate urinary biomarker concentrations to air concentrations were used (). This was done by determining the urinary concentration that relates to either the non-cancer or cancer benchmark for each regression equation. The average value derived from the regression lines for benzene or SPMA was used for comparison to the biomonitoring data. In effect, this approach “models” the expected internal dose (biomarker concentration) from a measured external dose (air concentration) similar to a PBPK model. The non-cancer USEPA RfC value of 0.009 ppm falls at the lower end of the exposure range covered by the regression equations (). It was necessary to extrapolate below the exposure range to derive the urinary values that relate to the 1 × 10⁻⁵ theoretical cancer risk. For urinary benzene, 0.24 µg/L ± 0.15 (average ± standard deviation) and 0.06 µg/L ± 0.04 correspond to the air benzene concentration equivalent to the USEPA RfC and 1 × 10⁻⁵ theoretical cancer risk, respectively. Hays et al. (Citation2012) recently derived a similar value of 0.16 µg/L corresponding to the USEPA RfC. Since a PBPK model for urinary benzene is not available, Hays et al. (Citation2012) used the regression equation of Perbellini et al. (Citation2003) that established the relationship of blood benzene to urinary benzene. For urinary SPMA, 2.2 µg/g creatinine ± 2.4 (average ± standard deviation) and 0.7 µg/g creatinine ± 0.7 correspond to the air benzene concentration equivalent to the USEPA RfC and 10−5 theoretical cancer risk, respectively.
Table 6. Published regression models comparing airborne benzene concentrations with urinary benzene and SPMA concentrations.
Biomonitoring data of benzene in blood and benzene and SPMA in urine for adult smokers and non-smokers were compared to the benchmarks described above. Data were used if the biomarker was detected in >50% of adult subjects. Where applicable, non creatinine corrected data were corrected using the U.S. population mean creatinine value of 1.38 g/L for ages 30–39. In general, for the non-smoking general population and the urban worker, the major source of benzene exposure is inhalation of vapors from petroleum products and automobile exhaust. Since these exposures can be intermittent, vary over time, and benzene and its metabolites are short-lived in the body, temporal (daily/weekly) variability of biomarker concentrations within individuals is expected (Hays et al., Citation2012; Sexton et al., Citation2005). Spot urine or blood sampling only reflect a “snapshot” concentration, and individuals with concentrations in the upper end of the population distribution likely reflect short-term peak exposures. Therefore, population central tendency concentrations are more likely representative of long-term average exposures and are more appropriately compared to biomonitoring guidance values based upon chronic toxicity benchmarks that assume long-term steady state exposure (Hays et al., Citation2012; Kirman et al., Citation2012).
General population exposure
Blood benzene
The CDC (Citation2009) recently published biomonitoring data of benzene in blood. The CDC study is a stratified representative sample of the USA. It evaluated individuals 20–59 years of age in 2001–2002 and 2003–2004. In general, there were not any substantial differences between the two groups. The 50th percentile values were 30 ng/L and 27 ng/L, respectively. As expected, smokers (median = 110 ng/L) had much higher benzene exposure compared to non-smokers where greater than 50% of non-smokers did not have benzene detected in their blood (LOD = 24 ng/L) (Kirman et al., Citation2012). CDC also surveyed potential exposure to cigarette smoke and petroleum products. Exposure of the general US population to second-hand smoke and gasoline vapors or diesel exhaust results in higher blood benzene concentrations compared to the non-exposed population (). However, the median values for all these groups are below the estimated blood benzene concentration related to the USEPA RfC for benzene (150 ng/L).
Table 7. CDC biomonitoring data for benzene in blood (ng/L).
The central tendencies of blood benzene concentrations from several targeted random studies of non-occupationally exposed individuals (Ashley et al., Citation1994; Bergamaschi et al., Citation1999; Brugnone et al., Citation1989a,Citationb; Carrer et al., Citation2000; Hajimiragha et al., Citation1989; Kirkeleit et al., Citation2006a,b; Kivisto et al., Citation1997; Kok and Ong, Citation1994; Lin et al., Citation2007; Navasumrit et al., Citation2005, Citation2008; Ong et al., Citation1996; Perbellini et al., Citation1988, Citation2003; Romieu et al., Citation1999) were plotted with the results from CDC NHANES studies (Ashley et al., Citation1994; CDC, Citation2009; Lin et al., 2007) and compared to the benzene biomonitoring equivalent value relating to USEPA RfC and cancer slope factor (). These studies represent individuals from North America, Europe and Asia.
Figure 3. Reported blood benzene concentrations (central tendency) for the general population compared to the benzene biomonitoring equivalent value based upon USEPA non-cancer and cancer benchmarks. Each bar represents a separate exposure population.
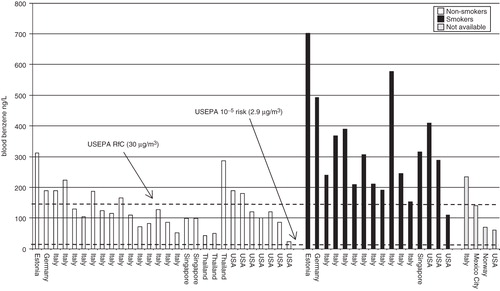
The majority of non-smoking study groups had central tendency values below the benzene biomonitoring equivalent value (150 ng/L) releated to non-cancer effects, whereas almost the entire smoking group exceeded this level (). Overall, the values for non-smokers (43–312 ng/L) and smokers (153–702 ng/l) are well below the blood level that relates to the USEPA RfC point of departure of 4400 ng/L. All the central tendency values were above the blood level that relates to the air concentration at the calculated risk level of 1 × 10⁻⁵.
Urinary benzene and SPMA
Similar trends are seen for urinary benzene (Ayi Fanou et al., Citation2006; Bergamaschi et al., Citation1999; Fustinoni et al., Citation2005a,Citationb; Ghittori et al., Citation1995; Kim et al., Citation2006a; Kivisto et al., Citation1997; Kok & Ong, Citation1994; Lagorio et al., Citation1998; Maestri et al., Citation1993; Ong et al., Citation1996; Pezzagno et al., Citation1999; Waidyanatha et al., Citation2001) and SPMA (Aston et al., Citation2002; Ayi Fanou et al., Citation2006; Boogaard & van Sittert, Citation1996; Crebelli et al., Citation2001; Einig et al., Citation1996; Fustinoni et al., Citation2005a; Garte et al., Citation2005; Ghittori et al., Citation1995, 1999; Hotz et al., Citation1997; Kim et al., Citation2006a; Kivisto et al., Citation1997; Maestri et al., Citation1993, Citation2005; Melikian et al., Citation1999b, Citation2002; Navasumrit et al., Citation2008; Pople et al., Citation2002; Stommel et al., Citation1989; Waidyanatha et al., Citation2004) biomonitoring data from North America, Europe, Asia and Africa ( and ). As expected, the urinary benzene and SPMA concentrations for smokers were generally higher than for non-smokers. The comparisons in and should be evaluated with care because of the variability across the regression lines and the need to extrapolate below the range of measured exposure levels when deriving the urinary values corresponding to the air concentrations related to the USEPA RfC and 10−5 excess cancer risk level.
Figure 4. Reported urinary benzene concentrations (central tendency) for the general population compared to the urinary concentration related to USEPA non-cancer and cancer benchmarks. Each bar represents a separate exposure population.
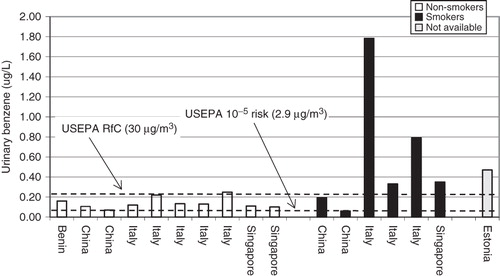
Figure 5. Reported urinary SPMA concentrations (central tendency) for the general population compared to the urinary concentration related to USEPA non-cancer and cancer benchmarks. Each bar represents a separate exposure population. NA = North America and ND = not defined.
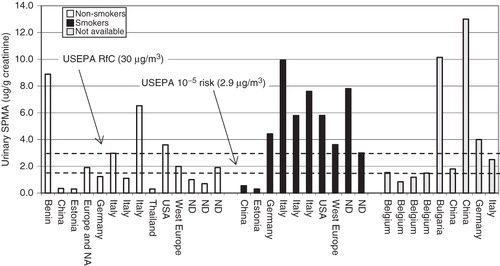
Biomarker levels and air exposure concentrations
As described in and (B), benzene ambient air monitoring data indicate that the average exposure concentrations in the USA and Europe range between 0.3 and 20 μg/m3. A comparison of the data in indicate that the majority of central tendency biomarker concentrations for non-smokers relate to air concentrations within this range, and virtually all the biomarker data for smokers are above this range. This is expected for the smoking populations. Likely causes of the apparent increased exposure for some of the non-smoking populations would include exposure to mobile sources, petroleum products and second-hand smoke.
For the general population, benzene biomarkers of exposure in non-smoking reference populations are generally consistent with the ambient background exposure levels, taking into account the location and the amount of smoking that occurs, and biomarkers of exposure for some reference populations, especially smokers, indicate that benzene exposure may exceed established regulatory benchmarks.
Urban worker exposure
Urinary SPMA and ttMA concentrations for urban workers (i.e. those that are exposed to benzene indirectly during their job tasks (e.g. taxi drivers, gasoline attendants, traffic policemen, temple workers burning incense)) were compared to the corresponding ACGIH BEI value corresponding to the ACGIH TLV of 0.5 ppm ( and ). The central tendency values for SPMA (Ayi Fanou et al., Citation2006; Barbieri et al., Citation2004; Bono et al., Citation2005; Carrieri et al., Citation2006; Crebelli et al., Citation2001; Manini et al., Citation2006, Citation2008; Navasumrit et al., Citation2008) and ttMA (Barbieri et al., Citation2004; Carrieri et al., Citation2006; Chanvaivit et al., Citation2007; Crebelli et al., Citation2001; Manini et al., Citation2006, Citation2008; Navasumrit et al., Citation2008; Violante et al., Citation2003) are well below the ACGIH BEI (with the exception of ttMA for temple workers exposed to incense burning; Navasumrit et al., Citation2008), and are generally in the same range as for the general population shown in .
Figure 6. Reported urinary SPMA concentrations (central tendency) for urban workers compared to the ACGIH BEI. Each bar represents a separate exposure population. ND = not definded.
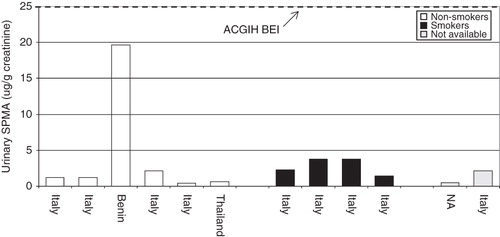
Figure 7. Reported urinary ttMA concentrations (central tendency) for urban workers compared to the ACGIH BEI. Each bar represents a separate exposure population. ND = not definded.
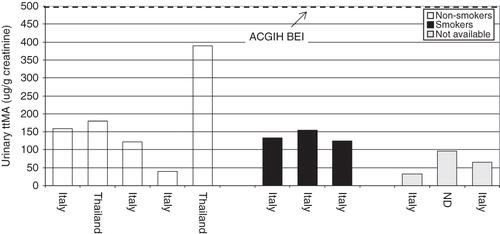
Industrial worker exposure
In the USA and Western Europe, industrial workers are primarily exposed to benzene in occupations that produce/process benzene or use benzene as an intermediate for the manufacture of other chemicals (VCEEP, Citation2006). Benzene exposure is tightly controlled and air monitoring is extensively used to ensure exposure is below appropriate industrial hygiene guideline values. Biomonitoring data is also used in this regard, and a limited number of studies have been published (Boogaard & van Sittert, Citation1996; Kirkeleit et al., Citation2006a,Citationb; van Sittert et al., Citation1993). In other parts of the world such as Asia and Eastern Europe, where occupational benzene exposure is not as tightly controlled, worker biomonitoring data demonstrates exposure above 1 ppm (Garte et al., Citation2005; Kim et al., Citation2006a,b; Kivisto et al., Citation1997; Lin et al., Citation2008; Panev et al., Citation2002; Rothman et al., Citation1998).
Common Criteria and risk assessment/risk management
The available toxicology and PBPK data for benzene met most of the data requirements for the Common Criteria and allowed a risk assessment evaluation of the biomonitoring data (). While the exact mode of action is not known and the key metabolite(s) responsible for benzene’s effects have not been conclusively identified, the available data did allow a linkage between the key toxicological benchmarks derived by governmental agencies (e.g. based upon a decrease in lymphocyte count and AML) to an internal-based biomarker concentration (i.e. benzene in blood and urine and SPMA in urine), and biomonitoring guidance values were compared to existing benzene biomonitoring data. Similar to the governmental toxicological benchmarks, the biomonitoring guidance values, such as the biomonitoring equivalent determined for benzene, are risk management tools used for priority setting, identifying additional research needs and evaluating if exposure to a particular chemical needs to be controlled (Hays et al., Citation2012). A number of considerations should be taken into account when evaluating benzene biomonitoring data: (1) the short half-life of benzene and metabolites in the body; (2) the temporal intra-individual variability of benzene and metabolites; (3) the comparison of spot blood and urine samples to chronic toxicological benchmarks and (4) the conservative nature of the toxicological benchmarks (Hays et al., 2012). It is clear from the biomonitoring data that smoking is one of the main contributors to benzene exposure, and exposures to the non-smoking general population appear to be consistent with the level expected from benzene exposure in ambient air. Considering the above factors, in general, a biomarker level that is less than the biomonitoring guidance value would indicate acceptable exposure levels with little need for risk management considerations. While levels above the biomonitoring guidance value do not necessarily indicate an increased risk of harm, the exceeded value may act as an indicator to public health officials that additional risk management activities are necessary. For benzene, governmental agencies and industry have been working for decades to lower benzene exposures by decreasing the content in gasoline, reducing automobile emissions, removing benzene from consumer products and by recommending that individuals stop smoking. Currently, there is little trend data for benzene biomonitoring data (CDC’s (Citation2009) data indicates a slight decrease in the blood benzene median value for the US population from 30 to 27 ng/L for the years of 2001–2004), but air quality monitoring in the US indicate average ambient air benzene concentrations have decreased 66% percent from 1994 to 2009 (USEPA, 2010).
Summary and conclusions
The Common Criteria provided a robust framework to evaluate benzene biomonitoring data in a risk-based context. Most of the Common Criteria were “satisfied”. There are relatively robust datasets for exposure, well characterized and validated analytical methods for benzene and metabolites in blood and/or urine, an extensive toxicology and epidemiology dataset, and several PBPK models of benzene have been developed. These data enabled a linkage between the key toxicological endpoints (i.e. a decrease in lymphocyte count and AML) to an internal-based biomarker concentration (i.e. benzene in blood and urine and SPMA in urine). This information; therefore, allows derivation of toxicologically-based biomarker concentrations that can be used to evaluate biomonitoring data in a risk assessment context.
However, some key data gaps were identified through the Common Criteria framework. Probably the biggest data gap is the lack of knowledge of the mechanism of action for benzene. Several hypotheses have been advanced, and a mode of action of key events has been proposed by Meek & Klaunig (2010). While it is generally agreed that the metabolism of benzene is required for the major toxicities of benzene to develop (i.e. hematotoxicity and cancer), the actual metabolite that is responsible for this event is not known, and may actually involve more than one, and they may also interact. Moreover, a better understanding of the dose at the target tissue is needed. This can be accomplished and has been done to some extent in animal models, but not with humans. Studies that correlate dose of benzene or more preferably its metabolites to target tissues such as bone marrow, to effect on tissue function would be beneficial. Unfortunately, while animals do develop tumors from exposure to benzene, these are unlike the type of cancer that develops in humans. Therefore, another need to understand the mechanism of action of benzene is an animal model that will develop MDS and/or AML, as do humans from the exposure benzene. With better information on the actual active benzene metabolite(s), more detailed PBPK models could make more confident predictions of dose to target tissue. To accomplish this, several benzene metabolites may need to be monitored simultaneously. Although this may be possible at high doses in animals models, it would be problematic to translate this to humans at current general population or occupational exposure levels since the contribution of these metabolites (i.e. phenol, hydroquinone, catechol) from benzene is overwhelmed by other sources (e.g. diet) (Arnold et al., Citation2010; Johnson et al., Citation2007). In addition, these metabolites are short-lived, while health effects can take weeks (peripheral blood effects), months (reduced bone marrow function) or years (MDS or AML) to become apparent. Thus, metabolites would need to be monitored serially over long time frames, which is resource intensive. Thus, more research is needed on whether biomarkers of benzene exposure can predict early, key events. Longer term research is needed to link these possible key events with long-term health effects, but it will probably be impractical to use biomonitoring in these longer term studies, unless a very quick, inexpensive, sensitive, specific, non-invasive method is developed.
Another important limitation when evaluating benzene biomonitoring data is the relatively short biological half-life of the biomarkers of exposure. These biomarkers reflect only very recent exposure, and serial sampling indicates there is significant daily/weekly intra-individual variability (Sexton et al., Citation2005). Central tendency biomarker concentrations were used in this assessment for comparison to derived risk-based biomonitoring guidance values. This assumes that individuals at the upper end of the distribution experience short-term peak exposures, and their exposure will mirror the central tendency over time. This could be confirmed by serial resampling of individuals at the upper end of the distribution (Hays et al., Citation2012; Kirman et al., Citation2012). To overcome the limitation of the short half-life of blood benzene and urinary benzene and SPMA, hemoglobin and plasma protein adducts of benzene metabolites are promising biomarkers of exposure because of their longer half-life in the body; unfortunately, they are not sensitive enough to monitor environmental exposures.
Although information on the mechanism of action and the ultimate chemical moiety responsible for benzene’s toxic effects are lacking, there is adequate information available to evaluate benzene biomonitoring data from a risk assessment standpoint. Comparison of the biomarker (i.e. blood benzene and urinary benzene and SPMA) central tendency values to biomonitoring guidance values gave fairly consistent results. For the general population, central tendency values for non-smokers are generally below or slightly elevated above the estimated blood benzene biomarker level corresponding to the USEPA RfC. Biomarkers of exposure for smokers and some reference populations exceed these levels. For non-smokers, exposures to second-hand smoke, gasoline products or automobile exhaust are the main sources of benzene exposure. All biomarker central tendency levels were above the level consistent with a benzene air concentration at 10−5 theoretical cancer risk. Overall, biomarker central tendency levels are generally consistent with the level that would result from ambient air exposure to benzene. Confidence in the blood benzene biomonitoring guidance value is fairly high since it was derived based upon a validated PBPK model (Hays et al. Citation2012). The confidence in the urinary benzene and SPMA biomonitoring guidance values are less because of the lack of a PBPK model to estimate these values, the variability across the regression lines used to estimate the values, and that it was necessary to extrapolate outside of the range of measured exposure levels.
Finally, biomonitoring guidance values based upon existing governmental toxicological benchmarks (i.e. USEPA RfC) such as the Biomonitoring Equivalent for benzene should be used as risk management tools for screening human biomonitoring data (Hays et al., Citation2012). A biomarker level less than the biomonitoring guidance value would indicate acceptable exposure levels with little need for risk management considerations. While levels above the biomonitoring guidance value do not necessarily indicate an increased risk of harm, particularly due to the conservative nature of the toxicological guidance values upon which they are based, this may act as an indicator to public health officials that additional risk management activities are necessary. In the case of benzene, governmental agencies and industry have been working for decades to lower benzene exposures by decreasing the content in gasoline, reducing automobile emissions, removing benzene from consumer products and by recommending that individuals stop smoking.
Declaration of interest
This publication stems from a subgroup of the HESI Integration of Biomonitoring Exposure Data into the Risk Assessment Process Technical Committee, whose work is funded through ILSI HESI. The authors’ affiliation is as shown on the cover page. The authors have sole responsibility for the writing and content of the paper.
This article has been reviewed in accordance with the policy of the National Health and Environmental Effects Research Laboratory, USEPA and approved for publication. Approval does not signify that the contents necessarily reflect the views and policies of the Agency, nor does mention of trade names or commercial products constitute endorsement or recommendation for use.
Acknowledgements
We thank Antonia Calafat and the late Larry Needham of the CDC, National Center for Environmental Health, Division of Laboratory Sciences for their valuable suggestions during the preparation of the manuscript.
References
- ACGIH. (2001). Benzene: BEI® documentation. 7th ed. Cincinnati, OH: American Conference of Governmental Industrial Hygienist
- ACGIH. (2007). Threshold limit values (TLVs) and biological exposure indices (BEIs). Cincinnati, OH: American Conference of Governmental Industrial Hygienist
- Ahmad Khan H. (2007). Benzene’s toxicity: a consolidated short review of human and animal studies. Hum Exp Toxicol, 26, 677–85
- Aksoy M, Dincol K, Akgun T, et al. (1971). Haematological effects of chronic benzene poisoning in 217 workers. Br J Ind Med, 28, 296–302
- Aksoy M, Dincol K, Erdem S, et al. (1972). Details of blood changes in 32 patients with pancytopenia associated with long-term exposure to benzene. Br J Ind Med, 29, 56–64
- Albertini R, Bird M, Doerrer N, et al. (2006). The use of biomonitoring data in exposure and human health risk assessments. Environ Health Perspect, 114, 1755–62
- Albitar M, Manshouri T, Shen Y, et al. (2002). Myelodysplastic syndrome is not merely “preleukemia”. Blood, 100, 791–8
- Alegretti AP, Thiesen FV, Maciel GP. (2004). Analytical method for evaluation of exposure to benzene, toluene, xylene in blood by gas chromatography preceded by solid phase microextraction. J Chromatogr B, 809, 183–7
- Amodio-Cocchieri R, Del Prete U, Cirillo T, et al. (2001). Evaluation of benzene exposure in children living in Campania (Italy) by urinary trans,trans-muconic acid assay. J Toxicol Environ Health Part A, 63, 79–87
- Andreoli C, Leopardi P, Crebelli R. (1997). Detection of DNA damage in human lymphocytes by alkaline single cell gel electrophoresis after exposure to benzene or benzene metabolites. Mutat Res, 377, 95–104
- Andrews LS, Lee EW, Witmer CM, et al. (1977). Effects of toluene on the metabolism, disposition, and hemopoietic toxicity of [3H]benzene. Biochem Pharmacol, 26, 293–300
- Angerer J. (1979). V. Chromatographische methoden zur bestimmung von phenolen im harn. Int Arch Occup Environ Health, 42, 257–68
- Angerer J. (1983). Pravention beruflich bedingter Gesundheitsschaden durch Benzol, Toluol, Xylole und Ethylbenzol. Arbeitsmed Sozialmed Praventivmed, 18, 69
- Angerer J, Bird MG, Burke TA, et al. (2006). Strategic biomonitoring initiatives: moving the science forward. Toxicol Sci, 93, 3–10
- Angerer J, Ewers U, Wilhelm M. (2007). Human biomonitoring: state of the art. Int J Hyg Environ Health, 210, 201–28
- Angerer J, Horsch B. (1992). Determination of aromatic hydrocarbons and their metabolites in human blood and urine. J Chromatogr, 580, 229–55
- Angerer J, Scherer G, Schaller KH, et al. (1991). The determination of benzene in human blood as an indicator of environmental exposure to volatile aromatic compounds. Fresenius’ J Anal Chem, 339, 740–2
- Angerer J, Schildbach M, Kramer A. (1998). Gas chromatographic method for the simultaneous determination of S-p-toluylmercapturic acid and S-phenylmercapturic acid in human urine. J Anal Toxicol, 22, 211–4
- Arfellini G, Grilli S, Colacci A, et al. (1985). In vivo and in vitro binding of benzene to nucleic acids and proteins of various rat and mouse organs. Cancer Lett, 28, 159–68
- Arnold SM, Price PS, Dryzga MD. (2010). Defining the contribution of non-benzene sources of benzene metabolites in urine: implications for biomonitoring and risk assessment. Chem Biol Interact, 184, 299–301
- Ashley DL, Bonin MA, Cardinali FL, et al. (1992). Determining volatile organic compounds in human blood from a large sample population by using purge and trap gas chromatography/mass spectrometry. Anal Chem, 64, 1021–9
- Ashley DL, Bonin MA, Cardinali FL, et al. (1994). Blood concentrations of volatile organic compounds in a nonoccupationally exposed us population and in groups with suspected exposure. Clin Chem, 40, 1401–4
- Aston JP, Ball RL, Pople J E, et al. (2002). Development and validation of a competitive immunoassay for urinary s-phenylmercapturic acid and its application in benzene biological monitoring. Biomarkers, 7, 103–12
- Atkinson TJ. (2009). A review of the role of benzene metabolites and mechanisms in malignant transformation: summative evidence for a lack of research in nonmyelogenous cancer types. Int J Hyg Environ Health, 212, 1–10
- ATSDR. (2007). Toxicological profile for benzene (Update). Atlanta (GA): Agency for Toxic Substances and Disease Registry, US Department of Health & Human Services, Public Health Service
- Ayi Fanou L, Mobio TA, Creppy EE, et al. (2006). Survey of air pollution in Cotonou, Benin--air monitoring and biomarkers. Sci Total Environ, 358, 85–96
- Baan R, Grosse Y, Straif K, et al. (2009). A review of human carcinogens – part f: chemical agents and related occupations. Lancet Oncol, 10, 1143–4
- Bader M, Angerer J. (1995). N-phenylvaline in hemoglobin as a possible biomarker for benzene exposure [update on benzene]. 1, 209–17
- Barbieri A, Accorsi A, Raffi GB, et al. (2002). Lack of sensitivity of urinary trans,trans-muconic acid in determining low-level (ppb) benzene exposure in children. Arch Environ Health, 57, 224–8
- Barbieri A, Sabatini L, Accorsi A, et al. (2004). Simultaneous determination of t,t-muconic, S-phenylmercapturic and S-benzylmercapturic acids in urine by a rapid and sensitive liquid chromatography/electrospray tandem mass spectrometry method. Rapid Commun Mass Spectrom, 18, 1983–8
- Barr DB, Angerer J. (2006). Potential uses of biomonitoring data: a case study using the organophosphorus pesticides chlorpyrifos and malathion. Environ Health Perspect, 114, 1763–9
- Bechtold WE, Henderson RF. (1993). Biomarkers of human exposure to benzene. J Toxicol Environ Health, 40, 377–86
- Bechtold WE, Lucier G, Birnbaum LS, et al. (1991). Muconic acid determinations in urine as a biological exposure index for workers occupationally exposed to benzene. Am Ind Hyg Assoc J, 52, 473–8
- Bechtold WE, Sun JD, Birnbaum LS, et al. (1992a). S-phenylcysteine formation in hemoglobin as a biological exposure index to benzene. Arch Toxicol, 66, 303–9
- Bechtold WE, Willis J K, Sun JD, et al. (1992b). Biological markers of exposure to benzene: S-phenylcysteine in albumin. Carcinogenesis, 13, 1217–20
- Bergamaschi E, Brustolin A, De Palma G, et al. (1999). Biomarkers of dose and susceptibility in cyclists exposed to monoaromatic hydrocarbons. Toxicol Lett, 108, 241–7
- Bernauer U, Vieth B, Ellrich R, et al. (1999). Cyp2E1-dependent benzene toxicity: the role of extrahepatic benzene metabolism. Arch Toxicol, 73, 189–96
- Bernauer U, Vieth B, Ellrich R, et al. (2000). Cyp2E1 expression in bone marrow and its intra- and interspecies variability: approaches for a more reliable extrapolation from one species to another in the risk assessment of chemicals. Arch Toxicol, 73, 618–24
- Bird MG, Greim H, Kaden DA, et al. (2010). Benzene, 2009 – health effects and mechanisms of bone marrow toxicity: implications for t-AML and the mode of action framework. Chem Biol Interact, 184, 3–6
- Birnbaum LS, Cohen Hubal EA. (2006). Polybrominated diphenyl ethers: a case study for using biomonitoring data to address risk assessment questions. Environ Health Perspect, 114, 1770–5
- Bleasdale C, Kennedy G, Macgregor JO, et al. (1996). Chemistry of muconaldehydes of possible relevance to the toxicology of benzene. Environ Health Perspect, 104, 1201–9
- Bodell WJ, Levay G, Pongracz K. (1993). Investigation of benzene-DNA adducts and their detection in human bone marrow. Environ Health Perspect, 99, 241–4
- Bodell WJ, Pathak DN, Levay G, et al. (1996). Investigation of the DNA adducts formed in B6C3F1 mice treated with benzene: implications for molecular dosimetry. Environ Health Perspect, 104, 1189–93
- Bois FY, Jackson ET, Pekari K, et al. (1996). Population toxicokinetics of benzene. Environ Health Perspect, 104, 1405–11
- Bond GG, Mclaren EA, Baldwin CL, et al. (1986). An update of mortality among chemical workers exposed to benzene. Br J Ind Med, 43, 685–91
- Bono R, Traversi D, Maestri L, et al. (2005). Urban air and tobacco smoke in benzene exposure in a cohort of traffic policemen. Chem Biol Interact, 153–154, 239–42
- Boogaard PJ. (2009). Biomonitoring of the workplace and environment. In: Ballentyne B, Marrs T, Syversen T, eds. General and applied toxicology. 3rd ed. Chichester (UK): Wiley, 2559–89
- Boogaard PJ, Van Sittert NJ. (1995). Biological monitoring of exposure to benzene: a comparison between s-phenylmercapturic acid, trans,trans-muconic acid, and phenol. Occup Environ Med, 52, 611–20
- Boogaard PJ, Van Sittert NJ. (1996). Suitability of S-phenyl mercapturic acid and trans-trans-muconic acid as biomarkers for exposure to low concentrations of benzene. Environ Health Perspect, 104, 1151–7
- Bradford Hill A. (1965). The environment and disease: association or causation. Proc R Soc Med, 58, 295–300
- Brown EA, Shelley ML, Fisher JW. (1998). A pharmacokinetic study of occupational and environmental benzene exposure with regard to gender. Risk Anal, 18, 205–13
- Brugnone F, Perbellini L, Faccini GB, et al. (1989a). Benzene in the blood and breath of normal people and occupationally exposed workers. Am J Ind Med, 16, 385–99
- Brugnone F, Perbellini L, Faccini GB, et al. (1989b). Breath and blood levels of benzene, toluene, cumene and styrene in non-occupational exposure. Int Arch Occup Environ Health, 61, 303–11
- Brugnone F, Perbellini L, Maranelli G, et al. (1992). Reference values for blood benzene in the occupationally unexposed general population. Int Arch Occup Environ Health, 64, 179–84
- Bruinen de Bruin Y, Koistinen K, Kephalopoulos S, et al. (2008). Characterisation of urban inhalation exposures to benzene, formaldehyde and acetaldehyde in the European Union: comparison of measured and modelled exposure data. Environ Sci Pollut Res Int, 15, 417–30
- Brunnemann KD, Lee HCL, Hoffmann D. (1976). Chemical studies on tobacco smoke, xlvii. On the quantitative analysis of catechols and their reduction. Anal Lett, 9, 933–55
- Buratti M, Fustinoni S, Colombi A. (1996). Fast liquid chromatographic determination of urinary trans,trans-muconic acid. J Chromatogr B, 677, 257–63
- Butenhoff JL, Olsen GW, Pfahles-Hutchens A. (2006). The applicability of biomonitoring data for perfluorooctanesulfonate to the environmental public health continuum. Environ Health Perspect, 114, 1776–82
- Calafat AM, Mckee RH. (2006). Integrating biomonitoring exposure data into the risk assessment process: phthalates [diethyl phthalate and di(2-ethylhexyl) phthalate] as a case study. Environ Health Perspect, 114, 1783–9
- Capleton AC, Levy LS. (2005). An overview of occupational benzene exposures and occupational exposure limits in Europe and North America. Chem Biol Interact, 153–154, 43–53
- Carrer P, Maroni M, Alcini D, et al. (2000). Assessment through environmental and biological measurements of total daily exposure to volatile organic compounds of office workers in Milan, Italy. Indoor Air, 10, 258–68
- Carrieri M, Bonfiglio E, Scapellato M L, et al. (2006). Comparison of exposure assessment methods in occupational exposure to benzene in gasoline filling-station attendants. Toxicol Lett, 162, 146–52
- CDC. (2009). Fourth national report on human exposure to environmental chemicals. Atlanta (GA): Centers for Disease Control and Prevention. Available from: http://www.cdc.gov/exposurereport/ [last accessed 18 May 2011]
- Chaney AM, Carlson GP. (1995). Comparison of rat hepatic and pulmonary microsomal metabolism of benzene and the lack of benzene-induced pneumotoxicity and hepatotoxicity. Toxicology, 104, 53–62
- Chanvaivit S, Navasumrit P, Hunsonti P, et al. (2007). Exposure assessment of benzene in Thai workers, DNA-repair capacity and influence of genetic polymorphisms. Mutat Res, 626, 79–87
- Chen Y, Li G, Yin S, et al. (2007). Genetic polymorphisms involved in toxicant-metabolizing enzymes and the risk of chronic benzene poisoning in Chinese occupational exposed population. Xenobiotica, 27, 103–12
- Chen AA, Thomas DK, Ong LL, et al. (2011). Humanized mice with ectopic artificial liver tissues. Proc Natl Acad Sci USA, 108, 11842–7
- Collins JJ, Conner P, Friedlander BR, et al. (1991). A study of the hematologic effects of chronic low-level exposure to benzene. J Occup Med, 33, 619–26
- Collins JJ, Ireland BK, Easterday PA, et al. (1997). Evaluation of lymphopenia among workers with low-level benzene exposure and the utility of routine data collection. J Occup Environ Med, 39, 232–7
- Coutrim MX, Jager AV, De Carvalho LR, et al. (1997). Capillary electrophoresis determination of urinary muconic acid as a biological marker for benzene in cigarette smoke. J Capillary Electrophor, 4, 39–45
- Crebelli R, Tomei F, Zijno A, et al. (2001). Exposure to benzene in urban workers: environmental and biological monitoring of traffic police in Rome. Occup Environ Med, 58, 165–71
- Cronkite EP, Bullis J, Inoue T, et al. (1984). Benzene inhalation produces leukemia in mice. Toxicol Appl Pharmacol, 75, 358–61
- Cronkite EP, Drew RT, Inoue T. (1985). Benzene hematotoxicity and leukemogenesis. Am J Ind Med, 7, 447–56
- Cronkite EP, Drew RT, Inoue T. (1989). Hematotoxicity and carcinogenicity of inhaled benzene. Environ Health Perspect, 82, 97–108
- Crump K. (1994). Risk of benzene-induced leukemia: a sensitivity analysis of the pliofilm cohort with additional follow-up and new exposure estimates. J Toxicol Environ Health, 42, 219–42
- Deisinger PJ, Hill TS, English JC. (1996). Human exposure to naturally occurring hydroquinone. J Toxicol Environ Health, 47, 31–46
- DFG. (1995a). S-phenylmercapturic acid. Determination in urine. In: Angerer J, Schaller KH, eds. Analyses of hazardous substances in biological materials. Weinheim: Wiley-VCH, 125–41
- DFG. (1995b). t,t-Muconic acid. Determination in urine. In: Angerer J, Schaller KH, eds. Analyses of hazardous substances in biological materials. Weinheim: Wiley VCH, 125–41
- DFG. (2007). List of MAK and BAT values 2007 [report no. 43]. Berlin: Deutsche Forschungsgemeinschaft
- Dor F, Dab W, Empereur-Bissonnet P, et al. (1999). Validity of biomarkers in environmental health studies: the case of PAHs and benzene. Crit Rev Toxicol, 29, 129–68
- Dougherty D, Garte S, Barchowsky A, et al. (2008). NQO1, MPO, CYP2E1, GSTT1 and GSTM1 polymorphisms and biological effects of benzene exposure - a literature review. Toxicol Lett, 182, 7–17
- Dowty BJ, Laseter JL, Storer J. (1976). The transplacental migration and accumulation in blood of volatile organic constituents. Pediatr Res, 10, 696–701
- Ducos P, Gaudin R, Bel J, et al. (1992). Trans,trans-muconic acid, a reliable biological indicator for the detection of individual benzene exposure down to the ppm level. Int Arch Occup Environ Health, 64, 309–13
- Eastmond DA, Smith MT, Irons RD. (1987). An interaction of benzene metabolites reproduces the myelotoxicity observed with benzene exposure. Toxicol Appl Pharmacol, 91, 85–95
- ECETOC. (1989). DNA and protein adducts: evaluation of their use in exposure monitoring and risk assessment [monograph no. 13]. Brussels, Belgium: European Centre for Ecotoxicology and Toxicology of Chemicals
- Egeghy PP, Nylander-French L, Gwin KK., et al. (2002). Self-collected breath sampling for monitoring low-level benzene exposures among automobile mechanics. Ann Occup Hyg, 46, 489–500
- Egeghy PP, Tornero-Velez R, Rappaport SM. (2000). Environmental and biological monitoring of benzene during self-service automobile refueling. Environ Health Perspect, 108, 1195–202
- Einig T, Dehnen W. (1995). Sensitive determination of the benzene metabolite S-phenylmercapturic acid in urine by high-performance liquid chromatography with fluorescence detection. J Chromatogr A, 697, 371–5
- Einig T, Dunemann L, Dehnen W. (1996). Sensitive gas chromatographic method for determination of mercapturic acids in human urine. J Chromatogr B, 687, 379–85
- European Commission Joint Research Center Institute for Health and Consumer Protection. (2008). European Union risk assessment report: benzene. Ispra, Italy: European Commission Joint Research Center Institute for Health and Consumer Protection. Available from: http://ecb.jrc.ec.europa.eu/DOCUMENTS/Existing-Chemicals/RISK_ASSESSMENT/REPORT/benzenereport063.pdf. [last accessed 26 Apr 2011]
- Eutermoser M, Rusch GM, Kuna RA., et al. (1986). A method for repeated evaluation of benzene uptake in rats and mice during a six hour inhalation period. Am Ind Hyg Assoc J, 47, 37–40
- Farris GM, Everitt JI, Irons RD, et al. (1993). Carcinogenicity of inhaled benzene in CBA mice. Fundam Appl Toxicol, 20, 503–7
- Farris GM, Robinson SN, Gaido KW, et al. (1997). Benzene-induced hematotoxicity and bone marrow compensation in B6C3F1 mice. Fundam Appl Toxicol, 36, 119–29
- Fishbeck WA, Langner RR, Kociba RJ. (1975). Elevated urinary phenol levels not related to benzene exposure. Am Ind Hyg Assoc J, 36, 820–4
- Fishbeck WA, Townsend JC, Swank MG. (1978). Effects of chronic occupational exposure to measured concentrations of benzene. J Occup Med, 20, 539–42
- Fleming-Jones ME, Smith RE. (2003). Volatile organic compounds in foods: a five year study. J Agric Food Chem, 51, 8120–7
- Fondelli MC, Bavazzano P, Grechi D, et al. (2008). Benzene exposure in a sample of population residing in a district of Florence, Italy. Sci Total Environ, 392, 41–9
- Franz TJ. (1984). Percutaneous absorption of benzene. In: MacFarland HN, Holdsworth CE, MacGregor JA, Call RW, Kane ML, eds. Advances in modern environmental toxicology. Princeton (NJ): Princeton Scientific Publishers, 61–70
- Fustinoni S, Buratti M, Campo L, et al. (2005a). Urinary t,t-muconic acid, S-phenylmercapturic acid and benzene as biomarkers of low benzene exposure. Chem Biol Interact, 153–154, 253–6
- Fustinoni S, Consonni D, Campo L, et al. (2005b). Monitoring low benzene exposure: comparative evaluation of urinary biomarkers, influence of cigarette smoking, and genetic polymorphisms. Cancer Epidemiol Biomarkers Prev, 14, 2237–44
- Galbraith D, Gross SA, Paustenbach D. (2010). Benzene and human health: a historical review and appraisal of associations with various diseases. Crit Rev Toxicol, 40, 1–46
- Garte S, Popov T, Georgieva T, et al. (2005). Biomarkers of exposure and effect in Bulgarian petrochemical workers exposed to benzene. Chem Biol Interact, 153–154, 247–51
- Gaskell M, Jukes R, Jones DJ, et al. (2002). Identification and characterization of (3",4"-dihydroxy)-1,n(2)-benzetheno-2′-deoxyguanosine 3′-monophosphate, a novel DNA adduct formed by benzene metabolites. Chem Res Toxicol, 15, 1088–95
- Gaskell M, Mcluckie KI, Farmer PB. (2005a). Comparison of the repair of DNA damage induced by the benzene metabolites hydroquinone and p-benzoquinone: a role for hydroquinone in benzene genotoxicity. Carcinogenesis, 26, 673–80
- Gaskell M, Mcluckie KI, Farmer PB. (2005b). Genotoxicity of the benzene metabolites para-benzoquinone and hydroquinone. Chem Biol Interact, 153–154, 267–70
- Ghantous H, Danielsson BR. (1986). Placental transfer and distribution of toluene, xylene and benzene, and their metabolites during gestation in mice. Biol Res Pregnancy Perinatol, 7, 98–105
- Ghittori S, Imbriani M, Maestri L, et al. (1999). Determination of S-phenylmercapturic acid in urine as an indicator of exposure to benzene. Toxicol Lett, 108, 329–34
- Ghittori S, Maestri L, Fiorentino ML, et al. (1995). Evaluation of occupational exposure to benzene by urinalysis. Int Arch Occup Environ Health, 67, 195–200
- Ghittori S, Maestri L, Rolandi L, et al. (1996). The determination of trans,trans-muconics acid in urine as an indicator of occupational exposure to benzene. Appl Occup Environ Hyg, 11, 187–91
- Glass DC, Gray CN, Jolley DJ, et al. (2003). Leukemia risk associated with low-level benzene exposure. Epidemiology, 14, 569–77
- Gobba F, Rovesti S, Borella P, et al. (1997). Inter-individual variability of benzene metabolism to trans,trans-muconic acid and its implications in the biological monitoring of occupational exposure. Sci Total Environ, 199, 41–8
- Gordon SM, Wallace LA, Brinkman MC, et al. (2002). Volatile organic compounds as breath biomarkers for active and passive smoking. Environ Health Perspect, 110, 689–98
- Green JD, Snyder CA, Lobue J, et al. (1981). Acute and chronic dose/response effect of benzene inhalation on the peripheral blood, bone marrow, and spleen cells of CD-1 male mice. Toxicol Appl Pharmacol, 59, 204–14
- Greenburg L, Mayers MR, Goldwater L, et al. (1939). Benzene (benzol) poisoning in the rotogravure printing industry in New York City. J Ind Hyg Toxicol, 21, 395–420
- Grob K, Frauenfelder C, Artho A. (1990). Uptake by foods of tetrachloroethylene, trichloroethylene, toluene, and benzene from air. Z Lebensm Unters Forsch, 191, 435–41
- Hajimiragha H, Ewers U, Brockhaus A, et al. (1989). Levels of benzene and other volatile aromatic compounds in the blood of non-smokers and smokers. Int Arch Occup Environ Health, 61, 513–8
- Hanway R, Cavicchioli A, Kaur B, et al. (2000). Analysis of S-phenyl-l-cysteine in globin as a marker of benzene exposure. Biomarkers, 5, 252–62
- Harley RA, Hooper DS, Kean AJ, et al. (2006). Effects of reformulated gasoline and motor vehicle fleet turnover on emissions and ambient concentrations of benzene. Environ SciTechnol, 40, 5084–8
- Hayes RB, Yin SN, Dosemeci M, et al. (1997). Benzene and the dose-related incidence of hematologic neoplasms in China: Chinese Academy of preventive Medicine – National Cancer Institute Benzene Study Group. J Natl Cancer Inst, 89, 1065–71
- Hays SM, Pyatt DW, Kirman CR, et al. (2012). Biomonitoring equivalents for benzene. Regul Toxicol Pharmacol, 62, 62–73
- HEI. (2007). Mobile-source air toxics: a critical review of the literature on exposure and health effects [special report 16]. Boston, MA: The Health Effects Institute. Available from: http://pubs.healtheffects.org/view.php?id=282 [last accessed 12 Jun 2009]
- Henderson RF. (1996). Species differences in the metabolism of benzene. Environ Health Perspect, 104, 1173–5
- Hoffmann D, Wynder EL. (1986). Chemical constituents and bioactivity of tobacco smoke. IARC Sci Publ, 74, 145–65
- Hotz P, Carbonnelle P, Haufroid V, et al. (1997). Biological monitoring of vehicle mechanics and other workers exposed to low concentrations of benzene. Int Arch Occup Environ Health, 70, 29–40
- Hughes MF. (2006). Biomarkers of exposure: a case study with inorganic arsenic. Environ Health Perspect, 114, 1790–6
- Hutt AM, Kalf GF. (1996). Inhibition of human DNA topoisomerase ii by hydroquinone and p-benzoquinone, reactive metabolites of benzene. Environ Health Perspect, 104, 1265–9
- IARC. (1982). Benzene. Some industrial chemicals and dyestuffs. Monographs on the evaluation of the carcinogenic risk of chemicals to humans [IARC monographs 29]. Lyon, France: International Agency for Research on Cancer, 93–148
- IARC. (1987). Overall evaluations of carcinogenicity: an updating of IARC monographs Volume 1 to 42 [IARC monographs on the evaluation of the carcinogenic risk of chemicals to humans]. Lyon, France: World Health Organization, International Agency for Research on Cancer, Suppl. 7, 38–174
- IARC. (1988). Environmental carcinogens. Methods of analysis and exposure measurement. Volume 10: Benzene and Alkylated Benzenes. Lyon, France: World Health Organization, International Agency for Research on Cancer
- Inoue O, Kanno E, Yusa T, et al. (2001). A simple HPLC method to determine urinary phenylmercapturic acid and its application to gasoline station attendants to biomonitor occupational exposure to benzene at less than 1 ppm. Biomarkers, 6, 190–203
- Inoue O, Kanno E, Kakizaki M, et al. (2000). Urinary phenylmercapturic acid as a marker of occupational exposure to benzene. Ind Health, 38, 195–204
- Inoue O, Seiji K, Kasahara M, et al. (1986). Quantitative relation of urinary phenol levels to breathzone benzene concentrations: a factory survey. Br J Ind Med, 43, 692–7
- Inoue O, Seiji K, Kasahara M, et al. (1988). Determination of catechol and quinol in the urine of workers exposed to benzene. Br J Ind Med, 45, 487–92
- Inoue O, Seiji K, Nakatsuka H, et al. (1989). Urinary t,t-muconic acid as an indicator of exposure to benzene. Br J Ind Med, 46, 122–7
- Irons RD, Dent JG, Baker TS, et al. (1980). Benzene is metabolized and covalently bound in bone marrow in situ. Chem Biol Interact, 30, 241–5
- Irons RD, Gross SA, Le A, et al. (2010). Integrating WHO 2001–2008 criteria for the diagnosis of myelodysplastic syndrome (MDS): a case-case analysis of benzene exposure. Chem Biol Interact, 184, 30–8
- Irons RD, Lv L, Gross SA, et al. (2005). Chronic exposure to benzene results in a unique form of dysplasia. Leuk Res, 29, 1371–80
- Irons RD, Stillman WS. (1996). The process of leukemogenesis. Environ Health Perspect, 104, 1239–46
- Jo WK, Pack, KW. (2000). Utilization of breath analysis for exposure estimates of benzene associated with active smoking. Environ Res, 83, 180–7
- Johnson ES, Langard S, Lin YS. (2007). A critique of benzene exposure in the general population. Sci Total Environ, 374, 183–98
- Johnson ES, Lucier G. (1992). Perspectives on risk assessment impact of recent reports on benzene. Am J Ind Med, 21, 749–57
- Jongeneelen FJ, Dirven HA, Leijdekkers CM, et al. (1987). S-phenyl-N-acetylcysteine in urine of rats and workers after exposure to benzene. J Anal Toxicol, 11, 100–4
- Jowa L, Witz G, Snyder R, et al. (1990). Synthesis and characterization of deoxyguanosine-benzoquinone adducts. J Appl Toxicol, 10, 47–54
- Khan, HA. (2007). Benzene’s toxicity: a consolidated short review of human and animal studies. Hum Exp Toxicol, 26, 677–85
- Kim S, Lin Q, Waidyanatha S, et al. (2007). Genetic polymorphisms and benzene metabolism in humans exposed to a wide range of air concentrations. Pharmacogenet Genomics, 17, 789–801
- Kim S, Vermeulen R, Waidyanatha S, et al. (2006a). Using urinary biomarkers to elucidate dose-related patterns of human benzene metabolism. Carcinogenesis, 27, 772–81
- Kim S, Vermeulen R, Waidyanatha S, et al. (2006b). Modeling human metabolism of benzene following occupational and environmental exposures. Cancer Epidemiol Biomarkers Prev, 15, 2246–52
- Kipen HM, Cody RP, Crump KS, et al. (1988). Hematologic effects of benzene: a thirty-five year longitudinal study of rubber workers. Toxicol Ind Health, 4, 411–30
- Kipen HM, Cody RP, Goldstein BD. (1989). Use of longitudinal analysis of peripheral blood counts to validate historical reconstructions of benzene exposure. Environ Health Perspect, 82, 199–206
- Kirkeleit J, Riise T, Bratveit M, et al. (2006a). Benzene exposure on a crude oil production vessel. Ann Occup Hyg, 50, 123–9
- Kirkeleit J, Riise T, Bratveit M, et al. (2006b). Biological monitoring of benzene exposure during maintenance work in crude oil cargo tanks. Chem Biol Interact, 164, 60–7
- Kirman CR, Aylward LL, Blount BC, et al. (2012). Evaluation of NHANES biomonitoring data for volatile organic chemicals in blood: application of chemical-specific screening criteria. J Expo Sci Environ Epidemiol, 22, 24–34
- Kirrane E, Loomis D, Egeghy P, et al. (2007). Personal exposure to benzene from fuel emissions among commercial fishers: comparison of two-stroke, four-stroke and diesel engines. J Expo Sci Environ Epidemiol, 17, 151–8
- Kissel JC, Curl CL, Kedan G, et al. (2005). Comparison of organophosphorus pesticide metabolite levels in single and multiple daily urine samples collected from preschool children in Washington State. J Expo Anal Environ Epidemiol, 15, 164–71
- Kivisto H, Pekari K, Peltonen K, et al. (1997). Biological monitoring of exposure to benzene in the production of benzene and in a cokery. Sci Total Environ, 199, 49–63
- Kok PW, Ong CN. (1994). Blood and urinary benzene determined by headspace gas chromatography with photoionization detection: application in biological monitoring of low-level nonoccupational exposure. Int Arch Occup Environ Health, 66, 195–201
- Krewski D, Snyder R, Beatty P, et al. (2000). Assessing the health risks of benzene: a report on the benzene state-of-the-science workshop. J Toxicol Environ Health Part A, 61, 307–38
- Lagorio S, Crebelli R, Ricciarello R, et al. (1998). Methodological issues in biomonitoring of low level exposure to benzene. Occup Med (Lond), 48, 497–504
- Lamm SH, Grunwald HW. (2006). Benzene exposure and hematotoxicity. Science, 312, 998–9; author reply 998–9
- Lan Q, Zhang L, Li G, et al. (2004). Hematotoxicity in workers exposed to low levels of benzene. Science, 306, 1774–6
- Lauwerys RR, Buchet J P, Andrien F. (1994). Muconic acid in urine: a reliable indicator of occupational exposure to benzene. Am J Ind Med, 25, 297–300
- Layton DM and Mufti GJ. (1986). Myelodysplastic Syndromes: their history, evolution, and relation to acute myeoloid leukaemia. Ann Hematol, 53, 423–36
- Lee BL, Ong HY, Ong YB, et al. (2005). A sensitive liquid chromatographic method for the spectrophotometric determination of urinary trans,trans-muconic acid. J Chromatogr B, 818, 277–83
- Lee BL, Ong HY, Shi CY, et al. (1993). Simultaneous determination of hydroquinone, catechol and phenol in urine using high-performance liquid chromatography with fluorimetric detection. J Chromatogr, 619, 259–66
- Levay G, Pathak DN, Bodell WJ. (1996). Detection of DNA adducts in the white blood cells of B6C3F1 mice treated with benzene. Carcinogenesis, 17, 151–3
- Levay G, Pongracz K, Bodell WJ. (1991). Detection of DNA adducts in HL-60 cells treated with hydroquinone and p-benzoquinone by, 32P-postlabeling. Carcinogenesis, 12, 1181–6
- Li G, Wang C, Xin W, et al. (1996). Tissue distribution of DNA adducts and their persistence in blood of mice exposed to benzene. Environ Health Perspect, 104, 1337–8
- Liang Y, Wong O, Yang L, et al. (2006). The development and regulation of occupational exposure limits in China. Regul Toxicol Pharmacol, 46, 107–13
- Lin LC, Chen WJ, Chiung YM, et al. (2008). Association between GST genetic polymorphism and dose-related production of urinary benzene metabolite markers, trans,trans-muconic acid and S-phenylmercapturic acid. Cancer Epidemiol Biomarkers Prev, 17, 1460–9
- Lin YS, McKelvey W, Waidyanatha S, et al. (2006). Variability of albumin adducts of 1,4-benzoquinone, a toxic metabolite of benzene, in human volunteers. Biomarkers, 11, 14–27
- Lin LC, Shih JF, Shih TS, et al. (2004a). An electrospray ionization tandem mass spectrometry based system with an online dual-loop cleanup device for simultaneous quantitation of urinary benzene exposure biomarkers trans,trans-muconic acid and S-phenylmercapturic acid. Rapid Commun Mass Spectrom, 18, 2743–52
- Lin LC, Tyan YC, Shih TS, et al. (2004b). Development and validation of an isotope-dilution electrospray ionization tandem mass spectrometry method with an on-line sample clean-up device for the quantitative analysis of the benzene exposure biomarker S-phenylmercapturic acid in human urine. Rapid Commun Mass Spectrom, 18, 1310–6
- Lin YS, Vermeulen R, Tsai CH, et al. (2007). Albumin adducts of electrophilic benzene metabolites in benzene-exposed and control workers. Environ Health Perspect, 115, 28–34
- Lindsey RH Jr, Bender RP, Osheroff N. (2005). Effects of benzene metabolites on DNA cleavage mediated by human topoisomerase II alpha: 1,4-hydroquinone is a topoisomerase II poison. Chem Res Toxicol, 18, 761–70
- Lindstrom AB, Yeowell-O’Connell K, Waidyanatha S, et al. (1997). Measurement of benzene oxide in the blood of rats following administration of benzene. Carcinogenesis, 18, 1637–41
- Lindstrom AB, Yeowell-O’Connell K, Waidyanatha S, et al. (1998). Formation of hemoglobin and albumin adducts of benzene oxide in mouse, rat, and human blood. Chem Res Toxicol, 11, 302–10
- Lindstrom AB, Yeowell-O’Connell K, Waidyanatha S, et al. (1999). Investigation of benzene oxide in bone marrow and other tissues of f344 rats following metabolism of benzene in vitro and in vivo. Chem Biol Interact, 122, 41–58
- Linet MS, Devesa SS, Morgan GJ. (2006). The leukemias. In: Schottenfeld D, Fraumeni, Jr JF., eds. Cancer epidemiology and prevention. 3rd ed. New York (NY): Oxford University Press, 841–71
- Lovern MR, Cole CE, Schlosser PM. (2001). A review of quantitative studies of benzene metabolism. Crit Rev Toxicol, 31, 285–311
- Low LK, Meeks JR, Norris KJ, et al. (1989). Pharmacokinetics and metabolism of benzene in zymbal gland and other key target tissues after oral administration in rats. Environ Health Perspect, 82, 215–22
- Luck E. (1990). Food applications of sorbic acid and its salts. Food Addit Contam, 7, 711–5
- Lutz WK, Schlatter C. (1977). Mechanism of the carcinogenic action of benzene: irreversible binding to rat liver DNA. Chem Biol Interact, 18, 241–5
- Maestri L, Ghittori S, Grignani E, et al. (1993). [The measurement of a benzene metabolite, urinary S-phenylmercapturic acid (S-PMA), in man by HPLC]. Med Lav, 84, 55–65
- Maestri L, Negri S, Ferrari M, et al. (2005). Determination of urinary S-phenylmercapturic acid, a specific metabolite of benzene, by liquid chromatography/single quadrupole mass spectrometry. Rapid Commun Mass Spectrom, 19, 1139–44
- Maltoni C, Ciliberti A, Cotti G, et al. (1989). Benzene, an experimental multipotential carcinogen: results of the long-term bioassays performed at the Bologna Institute of oncology. Environ Health Perspect, 82, 109–24
- Manini P, De Palma G, Andreoli R, et al. (2006). Environmental and biological monitoring of benzene exposure in a cohort of Italian taxi drivers. Toxicol Lett, 167, 142–51
- Manini P, De Palma G, Andreoli R, et al. (2008). Biological monitoring of low benzene exposure in Italian traffic policemen. Toxicol Lett, 181, 25–30
- Marchese S, Curini R, Gentili A, et al. (2004). Simultaneous determination of the urinary metabolites of benzene, toluene, xylene and styrene using high-performance liquid chromatography/hybrid quadrupole time-of-flight mass spectrometry. Rapid Commun Mass Spectrom, 18, 265–72
- Marrubini G, Coccini T, Manzo L. (2001). Direct analysis of urinary trans,trans-muconic acid by coupled column liquid chromatography and spectrophotometric ultraviolet detection: method applicability to human urine. J Chromatogr B, 758, 295–303
- Mazzullo M, Bartoli S, Bonora B, et al. (1989). Benzene adducts with rat nucleic acids and proteins: dose-response relationship after treatment in vivo. Environ Health Perspect, 82, 259–66
- McDonald TA, Holland NT, Skibola C, et al. (2001). Hypothesis: phenol and hydroquinone derived mainly from diet and gastrointestinal flora activity are causal factors in leukemia. Leukemia, 15, 10–20
- McDougal JN, Jepson GW, Clewell HJ 3rd, et al. (1990). Dermal absorption of organic chemical vapors in rats and humans. Fundam Appl Toxicol, 14, 299–308
- McMahon TF, Birnbaum LS. (1991). Age-related changes in disposition and metabolism of benzene in male C57Bl/6N mice. Drug Metab Dispos, 19, 1052–7
- Medinsky MA, Kenyon EM, Schlosser PM. (1995). Benzene: a case study in parent chemical and metabolite interactions. Toxicology, 105, 225–33
- Meek ME, Klaunig JE. (2010). Proposed mode of action of benzene-induced leukemia: interpreting available data and identifying critical data gaps for risk assessment. Chem Biol Interact, 184, 279–85
- Melikian AA, Meng M, O’Connor R, et al. (1999a). Development of liquid chromatography-electrospray ionization-tandem mass spectrometry methods for determination of urinary metabolites of benzene in humans [research report no. 87]. Boston (MA): The Health Effects Institute, 1–36. discussion 37–43
- Melikian AA, O’Connor R, Prahalad AK, et al. (1999b). Determination of the urinary benzene metabolites S-phenylmercapturic acid and trans,trans-muconic acid by liquid chromatography-tandem mass spectrometry. Carcinogenesis, 20, 719–26
- Melikian A, Prahalad A, Coleman S. (1992). Isolation and characterization of two benzene-derived hemoglobin adducts in-vivo in rats. Cancer Epidemiol Biomarkers Prev, 1, 307–13
- Melikian AA, Prahalad AK, Hoffmann D. (1993). Urinary trans,trans-muconic acid as an indicator of exposure to benzene in cigarette smokers. Cancer Epidemiol Biomarkers Prev, 2, 47–51
- Melikian AA, Prahalad AK, Secker-Walker RH. (1994). Comparison of the levels of the urinary benzene metabolite trans,trans-muconic acid in smokers and nonsmokers, and the effects of pregnancy. Cancer Epidemiol Biomarkers Prev, 3, 239–44
- Melikian AA, Qu Q, Shore R, et al. (2002). Personal exposure to different levels of benzene and its relationships to the urinary metabolites S-phenylmercapturic acid and trans,trans-muconic acid. J Chromatogr B, 778, 211–21
- Menezes HC, Amorim LC, Cardeal ZL. (2009). Sampling of benzene in environmental and exhaled air by solid-phase microextraction and analysis by gas chromatography-mass spectrometry. Anal Bioanal Chem, 395, 2583–9
- Midzenski MA, McDiarmid MA, Rothman N, et al. (1992). Acute high dose exposure to benzene in shipyard workers. Am J Ind Med, 22, 553–65
- Modjtahedi BS, Maibach HI. (2008). In vivo percutaneous absorption of benzene in man: forearm and palm. Food Chem Toxicol, 46, 1171–4
- Monks TJ, Butterworth M, Lau SS. (2010). The fate of benzene-oxide. Chem Biol Interact, 184, 201–6
- Murray KE, Adams RF. (1988). Determination of simple phenols in faeces and urine by high-performance liquid chromatography. J Chromatogr, 431, 143–9
- Natelson EA. (2007). Benzene-induced acute myeloid leukemia: a clinician's perspective. Am J Hematol, 82, 826–30
- Navasumrit P, Arayasiri M, Hiang OM, et al. (2008). Potential health effects of exposure to carcinogenic compounds in incense smoke in temple workers. Chem Biol Interact, 173, 19–31
- Navasumrit P, Chanvaivit S, Intarasunanont P, et al. (2005). Environmental and occupational exposure to benzene in Thailand. Chem Biol Interact, 153–154, 75–83
- Needham LL, Calafat AM, Barr DB. (2007). Uses and issues of biomonitoring. Int J Hyg Environ Health, 210, 229–38
- Neumann H-G. (1984). Analysis of hemoglobin as a dose monitor for alkylating and arylating agents. Arch Toxicol, 56, 1–6
- Nilsson RI, Nordlinder RG, Tagesson C, et al. (1996). Genotoxic effects in workers exposed to low levels of benzene from gasoline. Am J Ind Med, 30, 317–24
- Nomiyama K, Nomiyama H. (1974a). Respiratory elimination of organic solvents in man. Benzene, toluene, n-hexane, trichloroethylene, acetone, ethyl acetate and ethyl alcohol. Int Arch Arbeitsmed, 32, 85–91
- Nomiyama K, Nomiyama H. (1974b). Respiratory retention, uptake and excretion of organic solvents in man. Int Arch Arbeitsmed, 32, 75–83
- Norpoth KH, Muller G, Schell C, et al. (1996). Phenylguanine found in urine after benzene exposure. Environ Health Perspect, 104, 1159–63
- Norpoth K, Stucker W, Krewet E, et al. (1988). Biomonitoring of benzene exposure by trace analyses of phenylguanine. Int Arch Occup Environ Health, 60, 163–8
- NTP. (1986). NTP toxicology and carcinogenesis studies of benzene (CAS No. 71-43-2) in F344/N rats and B6C3F1 mice (gavage studies). Natl Toxicol Program Tech Rep Ser, 289, 1–277
- NTP. (2005). Report on carcinogens. 11th ed. Research Triangle Park (NC): US Department of Health and Human Services, Public Health Service, National Toxicology Program. Available from: http://ntp-server.Niehs.Nih.Gov/ntp/roc/toc11.html [last accessed 27 May 2008]
- Olmos V, Lenzken SC, Lopez CM, et al. (2006). High-performance liquid chromatography method for urinary trans,trans-muconic acid. Application to environmental exposure to benzene. J Anal Toxicol, 30, 258–61
- Ong CN, Kok PW, Lee BL, et al. (1995). Evaluation of biomarkers for occupational exposure to benzene. Occup Environ Med, 52, 528–33
- Ong CN, Kok PW, Ong HY, et al. (1996). Biomarkers of exposure to low concentrations of benzene: a field assessment. Occup Environ Med, 53, 328–33
- Ong CN. Lee BL. (1994). Determination of benzene and its metabolites: application in biological monitoring of environmental and occupational exposure to benzene. J Chromatogr B Biomed Appl, 660, 1–22
- Ong CN, Lee BL, Shi CY, et al. (1994). Elevated levels of benzene-related compounds in the urine of cigarette smokers. Int J Cancer, 59, 177–80
- Osterman-Golkar S, Ehrenberg L, Segerback D, et al. (1976). Evaluation of genetic risks of alkylating agents. II. Haemoglobin as a dose monitor. Mutat Res, 34, 1–10
- Paci E, Pigini D, Cialdella AM, et al. (2007). Determination of free and total S-phenylmercapturic acid by HPLC/MS/MS in the biological monitoring of benzene exposure. Biomarkers, 12, 111–22
- Page BD, Conacher HB, Salminen J, et al. (1993). Survey of bottled drinking water sold in Canada. Part 2. Selected volatile organic compounds. J AOAC Int, 76, 26–31
- Panev T, Popov T, Georgieva T, et al. (2002). Assessment of the correlation between exposure to benzene and urinary excretion of t, t-muconic acid in workers from a petrochemical plant. Int Arch Occup Environ Health, 75, S97–100
- Parke DV, Williams RT. (1953). Studies in detoxication. 49. The metabolism of benzene containing (14C1) benzene. Biochem J, 54, 231–8
- Perbellini L, Faccini GB, Pasini F, et al. (1988). Environmental and occupational exposure to benzene by analysis of breath and blood. Br J Ind Med, 45, 345–52
- Perbellini L, Princivalle A, Cerpelloni M, et al. (2003). Comparison of breath, blood and urine concentrations in the biomonitoring of environmental exposure to 1,3-butadiene, 2,5-dimethylfuran, and benzene. Int Arch Occup Environ Health, 76, 461–6
- Pereira MA, Chang LW. (1981). Binding of chemical carcinogens and mutagens to rat hemoglobin. Chem-Biol Interact, 33, 301–5
- Pezzagno G, Maestri L, Fiorentino ML. (1999). Trans,trans-muconic acid, a biological indicator to low levels of environmental benzene: some aspects of its specificity. Am J Ind Med, 35, 511–8
- Pirkle JL, Sampson EJ, Needham LL, et al. (1995). Using biological monitoring to assess human exposure to priority toxicants. Environ Health Perspect, 103, 45–8
- Plebani C, Tranfo G, Salerno A, et al. (1999). An optimized sampling and GC-MS analysis method for benzene in exhaled breath, as a biomarker for occupational exposure. Talanta, 50, 409–12
- Pongracz K, Bodell WJ. (1991). Detection of 3′-hydroxy-1, N6-benzetheno-2'-deoxyadenosine 3′-phosphate by 32P postlabeling of DNA reacted with p-benzoquinone. Chem Res Toxicol, 4, 199–202
- Pople JE, Ball RL, Padgett MJ, et al. (2002). Construction of a database of benzene biological monitoring. Toxicol Lett, 134, 301–4
- Powley MW, Carlson GP. (2000). Cytochromes P450 involved with benzene metabolism in hepatic and pulmonary microsomes. J Biochem Mol Toxicol, 14, 303–9
- Qu Q, Melikian AA, Li G, et al. (2000). Validation of biomarkers in humans exposed to benzene: urine metabolites. Am J Ind Med, 37, 522–31
- Qu Q, Shore R, Li G, et al. (2002). Hematological changes among Chinese workers with a broad range of benzene exposure. Am J Ind Med, 42, 275–85
- Rappaport SM, Waidyanatha S, Qu Q, et al. (2002). Albumin adducts of benzene oxide and 1,4-benzoquinone as measures of human benzene metabolism. Cancer Res, 62, 1330–7
- Regev L, Wu M, Zlotolow R, et al. (2012). Hydroquinone, a benzene metabolite, and leukemia: a case report and review of the literature. Toxicol Ind Health, 28, 64–73
- Richardson DB. (2008). Temporal variation in the association between benzene and leukemia mortality. Environ Health Perspect, 116, 370–4
- Rickert DE, Baker TS, Bus J S, et al. (1979). Benzene disposition in the rat after exposure by inhalation. Toxicol Appl Pharmacol, 49, 417–23
- Rinsky RA, Smith AB, Hornung R, et al. (1987). Benzene and leukemia. An epidemiologic risk assessment. N Engl J Med, 316, 1044–50
- Robison SH, Barr DB. (2006). Use of biomonitoring data to evaluate methyl eugenol exposure. Environ Health Perspect, 114, 1797–801
- Romieu I, Ramirez M, Meneses F, et al. (1999). Environmental exposure to volatile organic compounds among workers in Mexico City as assessed by personal monitors and blood concentrations. Environ Health Perspect, 107, 511–5
- Ross D. (1996). Metabolic basis of benzene toxicity. Eur J Haematol, 57, 111–8
- Rossi AM, Guarnieri C, Rovesti S, et al. (1999). Genetic polymorphisms influence variability in benzene metabolism in humans. Pharmacogenetics, 9, 445–51
- Rossi G, Pelizzari AM, Bellotti D, et al. (2000). Cytogenetic analogy between myelodysplastic syndrome and acute myeloid leukemia of elderly patients. Leukemia, 14, 636–41
- Rothman N, Bechtold WE, Yin SN, et al. (1998). Urinary excretion of phenol, catechol, hydroquinone, and muconic acid by workers occupationally exposed to benzene. Occup Environ Med, 55, 705–11
- Rothman N, Haas R, Hayes RB, et al. (1995). Benzene induces gene-duplicating but not gene-inactivating mutations at the glycophorin a locus in exposed humans. Proc Natl Acad Sci USA, 92, 4069–73
- Rothman N, Li GL, Dosemeci M, et al. (1996). Hematotoxicity among Chinese workers heavily exposed to benzene. Am J Ind Med, 29, 236–46
- Ruppert T, Scherer G, Tricker AR, et al. (1997). Trans,trans-muconic acid as a biomarker of non-occupational environmental exposure to benzene. Int Arch Occup Environ Health, 69, 247–51
- Ruppert T, Scherer G, Tricker AR, et al. (1995). Determination of urinary trans,trans-muconic acid by gas chromatography-mass spectrometry. J Chromatogr B, 666, 71–6
- Rushton L, Romaniuk H. (1997). A case-control study to investigate the risk of leukaemia associated with exposure to benzene in petroleum marketing and distribution workers in the United Kingdom. Occup Environ Med, 54, 152–66
- Sabourin PJ, Chen BT, Lucier G, et al. (1987). Effect of dose on the absorption and excretion of [14C]benzene administered orally or by inhalation in rats and mice. Toxicol Appl Pharmacol, 87, 325–36
- Sabourin PJ, Sun JD, MacGregor JT, et al. (1990). Effect of repeated benzene inhalation exposures on benzene metabolism, binding to hemoglobin, and induction of micronuclei. Toxicol Appl Pharmacol, 103, 452–62
- Scher DP, Alexander BH, Adgate JL, et al. (2007). Agreement of pesticide biomarkers between morning void and, 24-h urine samples from farmers and their children. J Expo Sci Environ Epidemiol, 17, 350–7
- Scherer G, Renner T, Meger M. (1998). Analysis and evaluation of trans, trans-muconic acid as a biomarker for benzene exposure. J Chromatogr B, 717, 179–99
- Scherer G, Ruppert T, Daube H, et al. (1995). Contribution of tobacco smoke to environmental benzene exposure in Germany. Environ Int, 21, 779–89
- Schnatter AR, Armstrong TW, Nicolich MJ, et al. (1996a). Lymphohaematopoietic malignancies and quantitative estimates of exposure to benzene in Canadian petroleum distribution workers. Occup Environ Med, 53, 773–81
- Schnatter AR, Armstrong TW, Thompson LS, et al. (1996b). The relationship between low-level benzene exposure and leukemia in Canadian petroleum distribution workers. Environ Health Perspect, 104, 1375–9
- Schnatter AR, Glass D, Tang G, et al. (2012). Myelodysplastic syndrome and benzene exposure among petroleum workers: an international pooled analysis. JNCI Journal of the National Cancer Institute, 2012; doi: 10.1093/jnci/djs411
- Schnatter AR, Kerzic PJ, Zhou Y, et al. (2010). Peripheral blood effects in benzene-exposed workers. Chem Biol Interact, 184, 174–81
- Schnatter AR, Rosamilia K, Wojcik NC. (2005). Review of the literature on benzene exposure and leukemia subtypes. Chem Biol Interact, 153–154, 9–21
- Serena P, Tapparo A, Bombi GG. (2000). Direct determination of t,t-muconic acid in human urine by two-dimensional liquid chromatography. Analyst, 125, 689–92
- Serrano FO, López IS, Revilla GN. (1991). High performance liquid chromatography determination of chemical preservatives in yogurt. J Liquid Chromatogr Related Technol, 14, 709–17
- Sexton K, Adgate JL, Church TR, et al. (2005). Children’s exposure to volatile organic compounds as determined by longitudinal measurements in blood. Environ Health Perspect, 113, 342–9
- Shahtaheri S J, Ghamari F, Golbabaei F. (2005). Sample preparation followed by high performance liquid chromatographic (HPLC) analysis for monitoring muconic acid as a biomarker of occupational exposure to benzene. Int J Occup Saf Ergon, 11, 377–88
- Sheets PL, Yost GS, Carlson GP. (2004). Benzene metabolism in human lung cell lines BEAS-2B and A549 and cells overexpressing CYP2F1. J Biochem Mol Toxicol, 18, 92–9
- Silver SR, Rinsky RA, Cooper SP, et al. (2002). Effect of follow-up time on risk estimates: a longitudinal examination of the relative risks of leukemia and multipe myeloma in a rubber hydrochloride cohort. Am J Ind Med, 42, 481–9
- Sinclair GC, Gray CN, Sherwood RJ. (1999). Structure and validation of a pharmacokinetic model for benzene. Am Ind Hyg Assoc J, 60, 249–58
- Singh R, Farmer PB. (2006). Liquid chromatography-electrospray ionization-mass spectrometry: the future of DNA adduct detection. Carcinogenesis, 27, 178–96
- Skowronski GA, Turkall RM, Abdel-Rahman MS. (1988). Soil adsorption alters bioavailability of benzene in dermally exposed male rats. Am Ind Hyg Assoc J, 49, 506–11
- Smith MT. (1996). The mechanism of benzene-induced leukemia: a hypothesis and speculations on the causes of leukemia. Environ Health Perspect, 104, 1219–25
- Smith RE, Bryant J, DeCillis A, et al. (2003). Acute myeloid leukemia and myelodysplastic syndrome after doxorubicin-cyclophosphamide adjuvant therapy for operable breast cancer: the national surgical adjuvant breast and bowel project experience. J Clin Oncol, 21, 1195–204
- Snyder R. (2000). Overview of the toxicology of benzene. J Toxicol Environ Health, 61, 339–46
- Snyder R. (2002). Benzene and leukemia. Crit Rev Toxicol, 32, 155–210
- Snyder R. (2004). Xenobiotic metabolism and the mechanism(s) of benzene toxicity. Drug Metab Rev, 36, 531–47
- Snyder R. (2007). Benzene's toxicity: a consolidated short review of human and animal studies by HA Khan. Hum Exp Toxicol, 26, 687–96
- Snyder R. (2012). Leukemia and benzene. Int J Environ Res Public Health, 9, 2875–93
- Snyder CA, Goldstein BD, Sellakumar AR. (1978a). Hematotoxicity of inhaled benzene to Sprague-Dawley rats and AKR mice at 300 ppm. J Toxicol Environ Health, 4, 605–18
- Snyder CA, Goldstein BD, Sellakumar AR, et al. (1980). The inhalation toxicology of benzene: incidence of hematopoietic neoplasms and hematotoxicity in AKR/J and C57BL/6J mice. Toxicol Appl Pharmacol, 54, 323–31
- Snyder R, Hedli CC. (1996). An overview of benzene metabolism. Environ Health Perspect, 104, 1165–71
- Snyder R, Jowa L, Witz G, et al. (1987). Formation of reactive metabolites from benzene. Arch Toxicol, 60, 61–4
- Snyder R, Lee EW, Kocsis JJ. (1978b). Binding of labeled benzene metabolites to mouse liver and bone marrow. Res Commun Chem Pathol Pharmacol, 20, 191–4
- Snyder R, Witz G, Goldstein BD. (1993). The toxicology of benzene. Environ Health Perspect, 100, 293–306
- Sorahan T, Kinlen LJ, Doll R. (2005). Cancer risks in a historical UK cohort of benzene exposed workers. Occup Environ Med, 62, 231–6
- Srbova J, Teisinger J, Skramovsky S. (1950). Absorption and elimination of inhaled benzene in man. Arch Ind Hyg Occup Med, 2, 1–8
- Stommel P, Muller G, Stucker W, et al. (1989). Determination of S-phenylmercapturic acid in the urine--an improvement in the biological monitoring of benzene exposure. Carcinogenesis, 10, 279–82
- Sul D, Lee D, Im H, et al. (2002). Single strand DNA breaks in T- and B-lymphocytes and granulocytes in workers exposed to benzene. Toxicol Lett, 134, 87–95
- Sun JD, Medinsky MA, Birnbaum LS, et al. (1990). Benzene hemoglobin adducts in mice and rats: characterization of formation and physiological modeling. Fundam Appl Toxicol, 15, 468–75
- Swaen GM, Van Amelsvoort L, Twisk JJ, et al. (2010). Low level occupational benzene exposure and hematological parameters. Chem Biol Interact, 184, 94–100
- Swerdlow SH, Campo E, Harris NL, et al. (2008) WHO classification of tumors of haematopoietic and lymphoid tissue. Lyon, France: International Agency for Research on Cancer
- Tharnpoophasiam P, Kongtip P, Wongwit W, et al. (2004). Simultaneous determination of trans,trans-muconic acid and S-phenylmercapturic acid by high pressure liquid chromatography and its application. Southeast Asian J Trop Med Public Health, 35, 717–23
- Thienes H, Haley TJ. (1972). Clinical toxicology. 5th ed. Philadelphia (PA): Lea & Febiger, 124–7
- Tovalin-Ahumada H, Whitehead L. (2007). Personal exposures to volatile organic compounds among outdoor and indoor workers in two Mexican cities. Sci Total Environ, 376, 60–71
- Travis CC, Quillen JL, Arms AD. (1990). Pharmacokinetics of benzene. Toxicol Appl Pharmacol, 102, 400–20
- Tsuruta H. (1989). Skin absorption of organic solvent vapors in nude mice in vivo. Ind Health, 27, 37–47
- Turteltaub KW, Mani C. (2003). Benzene metabolism in rodents at doses relevant to human exposure from urban air [research report no. 113]. Boston (MA): The Health Effects Institute, 1–26. discussion 27–35
- USEPA. (1998). Carcinogenic effects of benzene: an update [report no. EPA/600/P-97/001F]. Washington (DC): National Center for Environmental Assessment –Office of Research and Development. Available from: http://www.epa.gov/ncea/pdfs/benzenef.pdf [last accessed 25 Jun 2012]
- USEPA. (2002). Toxicological review of benzene (noncancer effects) [report no. EPA/635/R-02/001F]. Washington (DC): US Environmental Protection Agency. Available from: http://www.epa.gov/iris/toxreviews/0276tr.pdf [last accessed 25 Jun 2012]
- USEPA. (2003). Integrated risk information system: benzene. Washington (DC): US Environmental Protection Agency. Available from: http://www.epa.gov/iris/subst/0276.htm [last accessed 26 Apr 2011]
- USEPA. (2010). Ambient concentrations of benzene [report on the environment]. Washington (DC): US Environmental Protection Agency. Available from: http://cfpub.epa.gov/eroe/index.cfm?fuseaction=detail.viewInd&lv=list.listbyalpha&r=231333&subtop=341 [last accessed 5 Mar 2012]
- Valentine JL, Lee SST, Seaton MJ, et al. (1996). Reduction of benzene metabolism and toxicity in mice that lack CYP2E1 expression. Toxicol Appl Pharmacol, 141, 205–13
- Van Dokkum W, De Vos RH, Cloughley FA, et al. (1982). Food additives and food components in total diets in the Netherlands. Br J Nutr, 48, 223–31
- Van Sittert NJ, Boogaard PJ, Beulink GD. (1993). Application of the urinary S-phenylmercapturic acid test as a biomarker for low levels of exposure to benzene in industry. Br J Ind Med, 50, 460–9
- VCEEP. (2006). PBPK modeling for benzene, interpretation of benzene human biomonitoring, and modeling of benzene concentrations in human milk [Benzene Tier 1 VCCEP Submission, Appendix C]. Available from: http://www.tera.org/peer/VCCEP/benzene/Benzene%20VCCEP%20Appendix%20C%20-PBPK%20Modeling%2030-Mar-2006.pdf. [last accessed on 25 Jun 2012]
- Violante FS, Sanguinetti G, Barbieri A, et al. (2003). Lack of correlation between environmental or biological indicators of benzene exposure at parts per billion levels and micronuclei induction. Environ Res, 91, 135–42
- Waidyanatha S, Rothman N, Fustinoni S, et al. (2001). Urinary benzene as a biomarker of exposure among occupationally exposed and unexposed subjects. Carcinogenesis, 22, 279–86
- Waidyanatha S, Rothman N, Li G, et al. (2004). Rapid determination of six urinary benzene metabolites in occupationally exposed and unexposed subjects. Anal Biochem, 327, 184–99
- Waidyanatha S, Yeowell-O’Connell K, Rappaport SM. (1998). A new assay for albumin and hemoglobin adducts of 1,2- and 1,4-benzoquinones. Chem Biol Interact, 115, 117–39
- Wallace L. (1996). Environmental exposure to benzene: an update. Environ Health Perspect, 104, 1129–36
- Wallace LA, Pellizzari ED. (1987). Personal air exposures and breath concentrations of benzene and other volatile hydrocarbons for smokers and non smokers. Toxicol Lett, 35, 113–6
- Wan J, Shi J, Hui L, et al. (2002). Association of genetic polymorphisms in CYP2E1, MPO, NQ01, GSTM1, and GSTT1 genes with benzene poisoning. Environ Health Perspect, 110, 1213–8
- Wang L, Zhou Y, Liang Y, et al. (2006). Benzene exposure in the shoemaking industry in China, a literature survey, 1978-2004. Regul Toxicol Pharmacol, 46, 149–56
- Weaver VM, Buckley T, Groopman JD. (2000). Lack of specificity of trans,trans-muconic acid as a benzene biomarker after ingestion of sorbic acid-preserved foods. Cancer Epidemiol Biomarkers Prev, 9, 749–55
- Weaver VM, Davoli CT, Heller PJ, et al. (1996). Benzene exposure, assessed by urinary trans,trans-muconic acid, in urban children with elevated blood lead levels. Environ Health Perspect, 104, 318–23
- Weisel CP. (2010). Benzene exposure: an overview of monitoring methods and their findings. Chem Biol Interact, 184, 58–66
- WHO. (1993). Benzene [international programme on chemical safety, environmental health criteria 150]. Geneva: World Health Organization
- WHO. (2001). Biomarkers in risk assessment: validity and validation. [environmental health criteria 222]. Geneva: World Health Organization
- Winek CL, Collom WD. (1971). Benzene and toluene fatalities. J Occup Med, 13, 259–61
- Witz G, Zhang Z, Goldstein BD. (1996). Reactive ring-opened aldehyde metabolites in benzene hematotoxicity. Environ Health Perspect, 104, 1195–9
- Wiwanitkit V, Suwansaksri J, Nasuan P. (2001). Feasibility of urinary trans,trans-muconic acid determination using high performance liquid chromatography for biological monitoring of benzene exposure. J Med Assoc Thai, 84, S263–8
- Wong O, Harris F, Armstrong TW, et al. (2010). A hospital-based case-control study of acute myeloid leukemia in Shanghai: analysis of environmental and occupational risk factors by subtypes of the WHO classification. Chem Biol Interact, 184, 112–28
- Wu F, Zhang Z, Wan J, et al. (2008). Genetic polymorphisms in HMTH1, HOGG1 and HMYH and risk of chronic benzene poisoning in a Chinese occupational population. Toxicol Appl Pharmacol, 233, 447–53
- Yardley-Jones A, Anderson D, Jenkinson P. (1988). Effect of occupational exposure to benzene on phytohaemagglutinin (PHA) stimulated lymphocytes in man. Br J Ind Med, 45, 516–22
- Yeowell-O’Connell K, McDonald TA, Rappaport SM. (1996). Analysis of hemoglobin adducts of benzene oxide by gas chromatography-mass spectrometry. Anal Biochem, 237, 49–55
- Yeowell-O'Connell K, Rothman N, Smith MT, et al. (1998). Hemoglobin and albumin adducts of benzene oxide among workers exposed to high levels of benzene. Carcinogenesis, 19, 1565–71
- Yeowell-O'Connell K, Rothman N, Waidyanatha S, et al. (2001). Protein adducts of 1,4-benzoquinone and benzene oxide among smokers and nonsmokers exposed to benzene in China. Cancer Epidemiol Biomarkers Prev, 10, 831–8
- Yin SN, Li GL, Tain FD, et al. (1987a). Leukaemia in benzene workers: a retrospective cohort study. Br J Ind Med, 44, 124–8
- Yin SN, Li Q, Liu Y, et al. (1987b). Occupational exposure to benzene in China. Br J Ind Med, 44, 192–5
- Yokley K, Tran HT, Pekari K, et al. (2006). Physiologically-based pharmacokinetic modeling of benzene in humans: a Bayseian approach. Risk Anal, 26, 925–43
- Yu R, Weisel CP. (1996a). Measurement of benzene in human breath associated with an environmental exposure. J Expo Anal Environ Epidemiol, 6, 261–77
- Yu R, Weisel CP. (1996b). Measurement of the urinary benzene metabolite trans,trans-muconic acid from benzene exposure in humans. J Toxicol Environ Health, 48, 453–77
- Zhang L, Rothman N, Wang Y, et al. (1998a). Increased aneusomy and long arm deletion of chromosomes 5 and 7 in the lymphocytes of Chinese workers exposed to benzene. Carcinogenesis, 19, 1955–61
- Zhang L, Wang Y, Shang N, et al. (1998b). Benzene metabolites induce the loss and long arm deletion of chromosomes 5 and 7 in human lymphocytes. Leuk Res, 22, 105–13