
Abstract
The RISK21 integrated evaluation strategy is a problem formulation-based exposure-driven risk assessment roadmap that takes advantage of existing information to graphically represent the intersection of exposure and toxicity data on a highly visual matrix. This paper describes in detail the process for using the roadmap and matrix. The purpose of this methodology is to optimize the use of prior information and testing resources (animals, time, facilities, and personnel) to efficiently and transparently reach a risk and/or safety determination. Based on the particular problem, exposure and toxicity data should have sufficient precision to make such a decision. Estimates of exposure and toxicity, bounded by variability and/or uncertainty, are plotted on the X- and Y-axes of the RISK21 matrix, respectively. The resulting intersection is a highly visual representation of estimated risk. Decisions can then be made to increase precision in the exposure or toxicity estimates or declare that the available information is sufficient. RISK21 represents a step forward in the goal to introduce new methodologies into 21st century risk assessment. Indeed, because of its transparent and visual process, RISK21 has the potential to widen the scope of risk communication beyond those with technical expertise.
| Abbreviations: | ||
| AF | = | Adjustment Factor |
| AOP | = | Adverse Outcome Pathway |
| DALYs | = | Disability-Adjusted Life Years |
| HESI | = | Health and Environmental Sciences Institute |
| ILSI | = | International Life Sciences Institute |
| IPCS | = | International Programme on Chemical Safety |
| IVIVE | = | In vitro to in vivo Extrapolation |
| KEDRF | = | Key Events Dose Response Framework |
| MOA | = | Mode of Action |
| MOE | = | Margin of Exposure |
| MTD | = | Maximum Tolerated Dose |
| NOEL | = | No Adverse Effect Level |
| OECD | = | Organisation for Economic Cooperation and Development |
| POD | = | Point of Departure |
| QAAR | = | Quantitative Activity Activity Relationships |
| QKEDRF | = | Quantitative Key Events Dose Response Framework |
| QSAR | = | Quantitative Structure Activity Relationships |
| RISK21 | = | Risk Assessment in the 21st Century |
| REACH | = | Registration, Evaluation, Authorisation, and Restriction of Chemicals |
| SAR | = | Structure Activity Relationships |
| SCCS | = | Scientific Committee on Consumer Safety |
| SCHER | = | Scientific Committee on Health and Environmental Risks |
| SCENIHR | = | Scientific Committee on Emerging and Newly Identified Health Risks |
| TSCA | = | Toxic Substances Control Act |
| TTC | = | Threshold of Toxicological Concern |
| USEPA | = | United States Environmental Protection Agency |
Introduction
To address and catalyze improvements in human health risk assessment, the International Life Sciences Institute (ILSI) Health and Environmental Sciences Institute (HESI) created the Risk Assessment in the 21st Century (RISK21) Project. This multi-sector, international initiative began in 2009 and has involved the active participation of over 120 individuals from 12 countries, 15 government institutions, 20 universities, 2 nongovernmental organizations, and 12 corporations.
This collective effort, RISK21, has developed a problem formulation-based conceptual framework called the roadmap and a simple exposure-toxicity comparison matrix. The matrix enables exposure and hazard to be evaluated and compared effectively and transparently using all relevant sources of information sufficient for decision-making. The overarching principles of the RISK21 approach and an introduction to the roadmap and visualization matrix are described by CitationPastoor et al. (2014). The purpose of this paper is to describe in detail how to apply the RISK21 roadmap in risk assessment.
Terminology
In order to explain the RISK21 roadmap and matrix effectively, it is important to provide some working definitions of key terms used to describe the approach.
Risk and safety
The terms risk and safety often have different meanings, depending on the context. Regulatory policy seeks to minimize risk while optimizing safety. Both terms are often used in regulatory policy. Safe is included in the title of the Safe Drinking Water Act (CitationSafe Drinking Water Act Amendments of 1996) as well as in the recently-drafted Toxic Substances Control Act (TSCA) reform bill, the CitationSafe Chemicals Act of 2013 (US Senate Bill 696, 2013). The United States Environmental Protection Agency (USEPA)'s Superfund guidance states, “Risk assessors seek to determine a safe level for each potentially dangerous contaminant present” (Comprehensive Environmental Response, Compensation and Liability Act of 1980). The term margin of safety is used within numerous risk assessment guidance documents to indicate the margin between a dose that is likely to be without an adverse effect and the actual exposure. Often, the terms risk and safety are used interchangeably, as shown in the International Programme on Chemical Safety (IPCS) Environmental Health Criteria Monograph on “Principles and Methods for the Risk Assessment of Chemicals in Food” (WHO 2009). This document states that, “Risk assessment (in particular in the food context, also called ‘safety assessment’)…is a conceptual framework that provides a mechanism for the structured review of information relevant to estimating health outcomes in relation to exposure to chemicals present in food.”
However, in many other regulatory and legal contexts, risk and safety are not interchangeable. Risk is defined as the probability of harm, and hence almost never takes a value of zero, while safety is described as the absence of harm, and is often interpreted in absolute terms, that is, zero risk. For the purposes of this document, safety is used in the context of “reasonable certainty of no harm (Food Quality Protection Act of Citation1996).” Risk is considered the calculated likelihood of an adverse outcome based on the extent of exposure and relevant information on hazard. If a calculation shows an acceptable level of risk, a reasonable certainty of no harm determination can be made, and conversely if an unacceptable level of risk is calculated then one cannot make a reasonable certainty of no harm determination.
Precision and accuracy
A core principle of RISK21 is that data should be developed and assembled to achieve enough precision to make a decision. A clear understanding of how and why the term “precision” is used in RISK21 is important. The term precision is defined here as the representation of the degree of accuracy in the data, which is usually an estimate bounded by a confidence interval or range, the size of which is typically proportional to the quality and quantity of knowledge used to generate the estimate (CitationPastoor et al. 2014).
A fundamental characteristic of the RISK21 approach is the acknowledgment that toxicity and exposure values are estimated ranges or distributions rather than single, deterministic points. Such estimates are considered to be an approximation of a “true” or “real” value for human exposure or toxicity and are assumed to be relatively accurate.
Accuracy is defined as the “faithful measurement or representation of the truth; correctness; precision; and (physics, chemistry) – the degree of agreement between a measured or computed value of a physical quantity and the standard or accepted value for that quantity” (Collins 2009). For example, the height of a building, the volume of a beaker, or attendance at a sporting event each has a specific number that is absolutely correct.
Precision is the reproducibility or repeatability of a measurement. As shown in , measurements can differ from the “reference” or “true” value, reflecting the degree of accuracy. Accuracy and precision are not synonymous. Accuracy is the “faithful measurement or representation of the truth” and precision is “characterized by or having a high degree of exactness” (CitationWalker et al. 2003). Accuracy with precision is hitting the bull's-eye with five darts. Clustering five darts closely together on the outer ring is precise, but not accurate.
Figure 1. Graphical representation of the differences between precision and accuracy. Figure created by Pekaje, based on PNG version by Anthony Cutler, using en:xfig, en:inkscape, and en:HTML Tidy. Available at: www.en.wikipedia.org/wiki/File:Accuracy_and_precision.svg.
Uncertainty analysis provides a statement of how close the estimate is to the “true” or “deterministic” value. CitationWalker et al. (2003) tackles the overall meaning and application of uncertainty and its use in science and policymaking by adopting, “…a general definition of uncertainty as being any departure from the unachievable ideal of complete determinism.” Whereas variability is, in theory, knowable and ultimately irreducible, uncertainty is, in theory, often reducible by appropriate research (CitationWalker et al. 2001). Uncertainty analysis quantifies the gap between an estimate and the “real” value. The RISK21 approach addresses both variability and uncertainty.
In the case of human exposure and toxicity, we seldom know the “real” or “accurate” value. Acquisition of data allows us to estimate that value. In the RISK21 context, this translates to the questions: how accurate is our estimate of human exposure based on existing data and models? How accurate are animal-derived no adverse effect levels (NOELs) in predicting human NOELs? RISK21, as described in the present paper, was not designed to resolve this conundrum and offers no quantitative method to express uncertainty. Indeed, such an endeavor is contrary to the desired utility of the RISK21 approach. As argued by CitationGoldstein (2011), “…quantitative uncertainty analysis [is] an example of the problems caused by risk assessors attempting to do more than is needed or asked for by risk managers.”
Instead, the RISK21 approach uses the term precision to indicate the “exactness” of an estimate. RISK21 uses this term to facilitate the discussion and understanding of concepts surrounding uncertainty. At this time, our goal is not to craft and present quantitative guidelines or recommendations as to what defines “enough” precision, but rather to initiate dialog as to what can be done to resolve the underlying issues that must be addressed to appropriately make decisions regarding safety and risk.
Tiered and integrated evaluation strategies
The combination of the RISK21 roadmap with the visualization matrix is termed an integrated evaluation strategy. In the context of RISK21, integration refers primarily to the simultaneous consideration and evaluation of both toxicity and exposure. The RISK21 approach contains tiers, i.e., the results obtained from the lower tiers inform which resources and methodologies will be required within the upper tiers (see sections 3.2 and 3.3). However, one can enter the process at any tier, depending on the information already available and the urgency of the risk management need. Higher tiers may be more time consuming than lower tiers, even when the necessary information is available. RISK21 encourages the use of integrated testing strategies provided that the necessary level of precision for the decision can be assessed.
The RISK21 roadmap
The RISK21 roadmap and visualization matrix are tools that provide a transparent way to compare exposure and toxicity information and assess whether additional refinement is necessary to obtain the necessary level of precision for the decision. This approach is versatile and robust. It can be used within a regulatory agency for initial prioritization when decisions need to be made regarding which chemicals require more detailed evaluation. It can help a company determine which products warrant additional development, or to identify specific use patterns that require modification to reduce human health risk. It can be applied to make definitive risk decisions, provide general guidance on how to approach cumulative risk questions, or perform evaluations of new chemicals in novel situations. Lastly, because the RISK21 approach is flexible and guided by an overall integrated strategy, it allows for new information to be incorporated as appropriate.
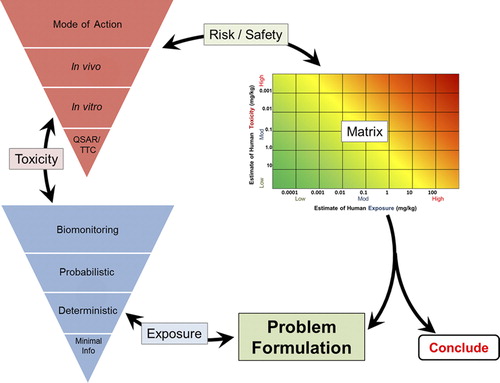
shows the RISK21 roadmap. Starting with problem formulation where the user defines the issue and degree of concern, exposure information required to make a decision is compiled and evaluated. Based on the exposure estimate, toxicity data is compiled and evaluated. The results can then be plotted on the visualization matrix to determine the degree of risk. Refinements can be made with additional exposure and toxicity information to improve the risk estimate and guide the decision.
Figure 2. General conceptual framework of the RISK21 approach.
Problem formulation
Problem formulation is the first, and arguably most important, step in the RISK21 roadmap. It establishes purpose, scope, and a plan for collecting and evaluating information that will guide the effective use of resources at each stage of the assessment process. This planning process systematically identifies the major factors to be considered in a particular evaluation. The USEPA's Guidelines on Ecological Risk Assessment were the first to introduce the concept of problem formulation, defining it as the analytical phase of the assessment wherein, “…the purpose of the assessment is articulated, the problem is defined and a plan for analyzing and characterizing risk is determined” (CitationUSEPA 1998). More recently, the importance of problem formulation has become more widely recognized in human health risk assessment and endorsed by several groups (CitationUSEPA 1992, CitationNational Academy of Sciences 2009, CitationWorld Health Organization 2009, CitationSheldon 2010). Problem formulation sets the stage for the ensuing risk assessment and identifies initial information on the chemistry, the occurrence and/or use, route of exposure, the human population to be considered, and the nature of the hazard to be assessed, among other categories of data. The following is a suggested set of considerations to guide problem formulation. Problem formulation may be revisited and refined during the course of the evaluation until sufficient precision of the data is reached to make a decision:
Scenario: A description of the situation including background on the occurrence and/or use of a biological, chemical, or physical agent.
Existing knowledge: An assembly and evaluation of the available chemical, physical, and biological information including knowledge of chemical class and hypothesized modes of action (including related substances), when available.
Context:
○ A definition of the overall chemical life cycle and determining which parts of the life cycle are to be included in the risk assessment.
○ A description of the potential exposure scenario(s).
○ A description of the potential exposed population(s).
Statement of the purpose of the assessment such as priority setting, screening, product selection, assessment of an existing situation, evaluation of a new use of an existing product, reassessment of acceptable exposure levels, assessment of combined exposures, or definitive risk assessment.
Identification of the decision point (e.g., an acceptable margin of exposure, or MOE).
Consideration of the available regulatory options that are available, if applicable.
Estimating exposure
The second step along the RISK21 roadmap involves the estimation of exposure. Although the general concept of taking a tiered approach to exposure assessment is not new, a unique feature of RISK21 is a consideration of exposure early in the risk assessment process. This can play an important role in guiding both the amount and type of toxicity data developed for the risk assessment. Comparison of exposure and toxicity estimates is necessary throughout this process because the initial estimates of exposure will influence the appropriate toxicity estimation methodology and vice versa. If the exposure estimate is very low, then it may be adequate to utilize a lower-precision, lower-tier approach for toxicity estimation in making a decision with confidence.
As shown in , RISK21 has developed a four-stage, tiered approach to estimating exposure that draws from other established tiered exposure frameworks (CitationDellarco et al. 2014). Exposure estimates can be constructed from limited information provided by physicochemical properties and route of exposure information (Tier 0), models based on transport and fate and use information (Tier 1), data from exposure studies (Tier 2), and data from biomonitoring studies (Tier 3). Any agent, even those without specific exposure information, can be evaluated by utilizing the lower tier approaches. The process is structured to provide an estimate of exposure proportional to the investment of resources (time and cost) such that a suitable level of resources is utilized for risk analysis and decision making. The resource relationship is driven by the information available to meet the need expressed in the problem formulation. The matrix aligns the level of exposure data needed to make the decision such that the precision of data is sufficient for the decision and additional resources may not need to be expended.
Figure 3. Tiered approach for exposure estimation.
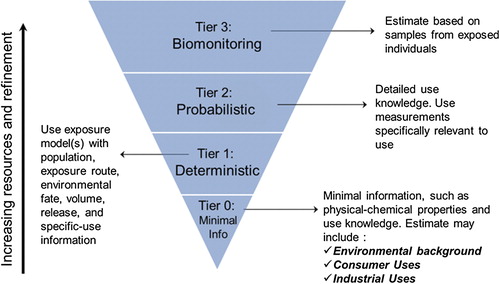
At the Tier 0 level, little is known about the chemical other than its structure and physical/chemical properties. This level is based on the least amount of information and will therefore result in the highest uncertainty but requires the fewest resources (time and cost) to estimate exposure. The Tier 0 assessment is intentionally developed to be conservative (i.e., provide high-end estimates of exposure and risk potential) such that with consideration for uncertainty, the actual exposure is likely well below Tier 0 estimates. Combined with information identified in the problem formulation phase, human exposure can be estimated by using exposure databases, exposure banding lookup tables (i.e., pre-established groupings or bands of potential exposures based on characteristics such as physico-chemical properties and uses), and/or calculating estimates based on physicochemical characteristics such as volatility or water solubility for the media and route of exposure being considered. At the Tier 1 level, exposure models can be used that are based on a more detailed understanding of the chemical's volume of use, release, and environmental transport and fate. Tier 1 is based on conservative models specific to the identified use. These models can often be refined to a high degree if additional usage information is available (CitationECETOC 2012). The choice of which model to apply and what background information is needed is driven by the problem formulation and the precision needed for the decision. A description of this process is highlighted in the RISK21 publication “Predicting Exposure Potential” (CitationDellarco et al. 2014).
At the Tier 2 level, chemical specific information is used to generate a likelihood estimate for human exposure. This tier is based on measured data and probabilistic methods such as Monte-Carlo analysis, and is used when there are sufficient data. These inputs are ranges of possible values and, taken together in the model, produce a range of possible estimates. At this probabilistic tier, variables often found in exposure factor guidelines such as volume of use, skin penetration, or respiratory rate are expressed as distributions rather than fixed values. The output, therefore, is also a distribution.
At the Tier 3 level, biomonitoring data and internal dose metrics are incorporated, as opposed to considering only external exposure. This tier includes chemical-specific measurements in environmental media (e.g., water, air, clothing patches, surface wipes) or biological media (e.g., blood, urine, exhaled air). Acquisition of this level of data often found in reports of major exposure studies or environmental health network surveys provides a far more accurate representation of human exposure but may be limited or absent for the chemical(s) being investigated. In addition, there are limitations to the use and interpretation of biomonitoring data that must be considered in any assessment (CitationJuberg et al. 2008).
Additional information is generally required to proceed through higher tiers. The goal is to advance through the tiers using more resources only when adequate safety margins are not realized. It is important to note that if exposure information for a specific substance is readily available there is no need to start at Tier 0 for the exposure assessment. The entry level tier is determined by the amount of information available for a specific substance and the purpose of the assessment.
Estimating toxicity
The next step in the process is an estimation of toxicity. As noted above, it is important that cross-comparison between exposure and toxicity estimations occur throughout the process. Initial estimates of toxicity may influence the choice of methodology used to estimate exposure. If a chemical is shown to have very low toxicity, it is possible that lower-tier, conservative exposure estimates may provide sufficient precision. It is also possible that only lower-tier estimates are possible because there is no legislative requirement for specific exposure information, for example for chemicals < 10 tonnes under Registration, Evaluation, Authorisation and Restriction of Chemicals (REACH).
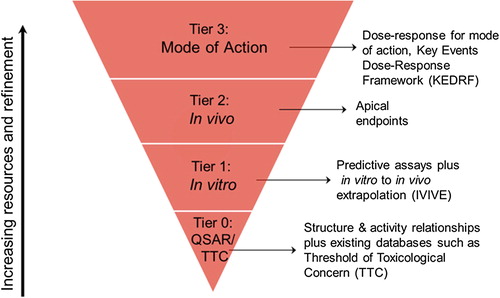
shows a tiered approach to estimating toxicity. As with the exposure schematic, the process is represented as an inverted pyramid to stress the concept that by increasing the level of precision, there is a proportionally larger investment of resources, possibly including animal testing, time, and/or finances.
Figure 4. Tiered approach for toxicity estimation.
However, it also is important to note that this precision– resource relationship is driven by the information at hand, as identified in the problem formulation. Therefore, what is identified as a high-tier, high-precision approach initially may not necessitate high resource use if the relevant information is readily available a priori. It is possible that one or two parameters are particularly valuable in assessing the toxicity of one or a series of chemicals and these may be determined without additional costly testing if the data are available.
This is an iterative process that should be revisited as toxicity and exposure estimates are combined on the matrix. If a higher degree of precision is required, then higher levels on the tier can be pursued, although the choice of studies should be targeted to meet the situation. Moving to a higher tier does not necessarily dictate the initiation of traditional toxicology studies; rather, it suggests that studies be carefully designed such that, when taken together, the data will provide the most relevant information while minimizing animal and monetary resources.
Tier 0 is the starting point when there are no specific toxicity data available for the chemical. The threshold of toxicological concern (TTC) (CitationKroes et al. 2005, CitationSCCS, SCHER, SCENIHR 2012) represents a Tier 0 method, based on broad chemical categories. The TTC approach requires an estimate of exposure in which there is reasonable confidence that it is not an underestimate. Despite a low level of precision the TTC method of hazard characterization has value in situations where the exposure is very low, and the risk estimate (i.e., MOE) is acceptable.
Simple structure-activity relationships (quantitative structure activity relationships [QSAR] and structure activity relationships [SAR]) and read-across comparisons with toxicity databases can provide general estimates of toxicity. These approaches have more precision than the TTC because they make comparisons within a smaller group of chemicals and could be accurate to within 3–5 orders of magnitude (CitationOECD 2007, CitationSchilter et al. 2014). Depending on how this estimate contributes to the risk area on the matrix, more toxicity data may be required.
Tier 1 utilizes in vitro and more sophisticated in silico methods to estimate toxicity. In this method one biological response is selected as a marker to define the potency of a group of chemicals with a similar mode of action and structure for which there is a strong data set. The biological response of the target chemical is determined and then it is assumed to have the same overall human toxicological NOEL as a known chemical (or group of chemicals) with a similar response. For example, the use of Quantitative Activity-Activity Relationships (QAAR) is the simplest form of Tier 1 assessment. An example of this methodology can be found in CitationRotroff et al. (2010), CitationJudson et al. (2011), and CitationThomas et al. (2013). In this approach, in vitro assays are designed to act as markers of a wider range of toxicological mechanisms or adverse outcome pathways which aim to estimate the human toxicity potential of a chemical. A range of in vitro or in silico toxicological values can be derived.
In addition, RISK21 has developed a framework for extrapolating in vitro concentrations to likely human doses. In vitro to in vivo extrapolation (IVIVE) approaches require knowledge of protein binding, metabolism, and kinetic behavior. Further, knowing toxicodynamic factors (e.g., affinity for a critical target protein) is also required to estimate the biological effect. These transformation steps can vary widely in their degree of complexity. Importantly, IVIVE can be used to identify critical knowledge gaps that once filled would increase precision and accuracy and, therefore, improve the model and reduce uncertainty. The complexity of IVIVE can vary with the precision necessary in the assessment. In higher tiers, IVIVE utilizes physiologically-based pharmacokinetic (PBPK) or biologically-based dynamic modeling. Hence, while described under Tier 1 of the RISK21 roadmap, IVIVE approaches may be incorporated into Tier 2, or even Tier 3, assessments of toxicity.
Tier 2 currently utilizes toxicity studies in laboratory animals as the major method used to generate data. This is the traditional method of hazard assessment and typically involves dosing animals (usually orally) for various lengths of time at a range of doses from the NOEL through the maximum tolerated dose (MTD) (CitationCasarett et al. 2013). However, CitationThomas et al. (2013) have described a refinement of the in vitro based methodology which brings in selected in vivo studies into a data driven toxicological testing framework which has the potential to operate as a Tier 2 method.
Tier 3 consists of the derivation of the key events that lead to an adverse outcome, described as a mode of action (MOA) or adverse outcome pathway (AOP) (CitationMeek et al. 2013). This tier is typically more resource intensive in estimating toxicity, unless the MOA is already known for a group of chemicals. At this level, there is a greater need for precision due to exposure concerns or a toxicological finding. Precision at this tier is achieved by gaining an understanding of the steps or “key events” in the mode of action, the relevance to human health of these key events and the dose–response relationship of the key events. Collectively, this is known as the key-events dose-response framework or KEDRF, the purpose of which is to identify a dose-metric in humans. A companion RISK21 paper (CitationSimon et al. 2014) describes this quantitative KEDRF (Q-KEDRF) approach.
Typically, at this level of investigation, molecular and cellular events are observed and quantified at the cellular and tissue levels, respectively. Correspondingly, estimates of exposure in this tier need to be expressed in terms of tissue dosimetry. This type of targeted investigation has been used many times in recent years to investigate the human relevance, either qualitatively or quantitatively, of toxicological findings with mostly high profile chemicals.
Though represented in a linear fashion, the toxicity tiered approach is actually iterative. In vitro and in vivo data can be coupled to provide the necessary level of precision. The RISK21 process allows, even encourages, the incorporation of either or both of these methods as long as their degree of precision can be quantified.
As knowledge on biology and toxicological mechanisms increases, there is an emerging goal to integrate quantitative information on key events and the signaling processes involved into a systems-based description of the overall process. This approach utilizes information from a variety of sources, including the results of in vitro assays and MOA/AOPs, together with knowledge on human biology, pathology, and genetic variability.
Using the RISK21 matrix
As noted above, the RISK21 visualization matrix is a tool that provides a transparent way to compare exposure and toxicity information and assess whether additional refinement is required to obtain the level of precision necessary for the decision context. If refinement is needed, the matrix provides visual guidance on what type of information (toxicity, exposure, or both) is likely to provide the greatest value.
The way in which the matrix is applied and interpreted is dependent on the purpose of the assessment (e.g., priority setting, product selection, assessment of existing situation, evaluation of new use of existing product) as well as the decision point (see problem formulation section for additional explanation). This visualization tool is flexible and can be adapted to fit the specific purpose at hand. A generic guide to utilizing the matrix is provided below, along with several illustrative examples of how this tool can be customized.
Units for exposure and toxicity axes
The RISK21 matrix requires that the units for exposure and toxicity be the same (i.e., like-for-like) such that the ranges or probability distributions can be combined to produce a risk estimate. Therefore, the toxicity information applied to the matrix represents the appropriate predicted human toxicity level. These values can be NOELs from animal studies, NOELs modified with adjustment factors or actual human toxicity data. The key is that the units for the toxicity estimate are the same as for the exposure estimate. The application of the RISK21 matrix in risk-benefit assessment has not yet been systematically explored. However, plotting health outcome using a composite health metric, such as Disability-Adjusted Life Years (DALYs), on the x-axis could facilitate such application.
One also could incorporate the range or probability distribution that includes the results of whatever adjustments or calculations are used to estimate a level which is reasonably certain to produce no harm in humans. The unadjusted data, such as the animal NOEL, also can be plotted onto the matrix. This method is especially useful when comparing a large number of values on one matrix as may be done in a prioritization exercise. However, in this case, all of the values used should be consistent, i.e., either adjusted or unadjusted. If the data variability is shown as a range, as is recommended for individual chemicals, the matrix can become cluttered when many chemicals are plotted at the same time, but the result will still provide an indication of where on the matrix the chemicals lie in relation to the other chemicals of concern, and thus be adequate to inform prioritization decisions (e.g., ). In such cases, it may be useful to produce two versions of the matrix, one showing the full distributions and another showing summary estimates.
Adjustment factors
Recalling the section in this paper about precision and accuracy, the intent is to plot accurate values on the matrix, but realize that the data inherently have uncertainty and variability. Variability and uncertainty represent the spread of data and should be represented on each axis. Uncertainty analysis provides an approximation of the “true” value, whatever that might be. Accounting for uncertainty can be challenging. In the case of toxicity data, “adjustment factors” (AFs) are used to account for the many factors that separate data acquired in animals from anticipated toxicity in humans. Depending on the chemical and the quantity and quality of data available, adjustment factors can be of any magnitude, but are typically 10- or 100-fold reductions in a NOEL or point of departure (POD), based on the assumption that humans are more sensitive than animals. Without data to the contrary, such adjustment (or “uncertainty”) factors are considered protective of human health. Where there is concern that there is no threshold for the critical effect, larger adjustment factors are often used, to provide an estimate of exposures associated with an increased risk of 1 in 100,000 or 1 in 1,000,000. Alternatively, the unadjusted values could be plotted, with appropriate interpretation of their relative position on the matrix. For such compounds, “acceptability” would require location much further into the lower left of the matrix.
The magnitude of the adjustment factor should always be stated in the documentation of values used on each axis as shown in (column C). Otherwise, the original value (NOEL, POD, etc.) can be obscured through the application of adjustment/uncertainty factors.
Table 1. Visual depictions of exposure and toxicity information using the RISK21 matrix.
General guidance
Visualize range or probability distributions for exposure and toxicity
The purpose of the RISK21visualization matrix is to give a visual indication of where the exposure and toxicity information lies and the precision of the estimation; how this is done depends on the output.
shows different ways in which the estimates of exposure and toxicity can be depicted visually. These include the following: A) the output is a range of values within which the toxicity or exposure lies but the method does not allow determination of where within the distribution the value lies; B) the output is a range of values and the method provides an estimate where the value lie lies within the distribution (e.g., mean, median); C) the method provides a point value to which default adjustment factors are applied (for toxicity only); or D) the method provides a probability distribution with percentiles indicated.
Choose and document the logic to be used for the assessment
The RISK21 matrix allows a direct comparison of exposure and toxicity estimates to perform an assessment that allows decisions to be made with more confidence, transparency, and consistency. At a basic level, the matrix provides a visual representation of whether and how the exposure and toxicity ranges overlap, with the ability to overlay appropriate evaluation contexts and criteria (e.g., margins of safety) using either shading or bright lines. Because the toxicity and exposure intersection is also known as a MOE, a decision must be made regarding the acceptable MOE. For example, if a 100-fold MOE is judged to be acceptable based on the problem formulation, a diagonal line should represent the 1:100 ratio. As shown, the color background is drawn using an acceptable MOE of 1 as a visualization and can be shifted as appropriate or removed if so desired.
The RISK21 process is flexible and not prescriptive. Therefore, a discussion of the applicable decision points that will be used in the interpretation of the matrix plot should be provided with sufficient detail and, when applicable, illustrated on the matrix.
Plot the exposure/toxicity intersection on the RISK21 matrix
The area formed by the intersection of the estimates for exposure and toxicity allows the information to be visualized in an integrated manner, helping to guide the next steps that may be required. The RISK21 visualization matrix also serves as an aid to decision making and has the potential to be of value in risk communication. The position, size, and shape of the area give guidance on the acceptability of the scenario and what steps could be taken to increase precision. Deriving and visualizing this intersection is a step-wise process which is likely to be repeated several times during the course of an assessment using the RISK21 roadmap. Although the details will vary each time this intersection is plotted, the steps are the same. The various ways in which this intersection can be shown and some examples regarding their application are provided below:
Matrix applications
Intersection using two ranges
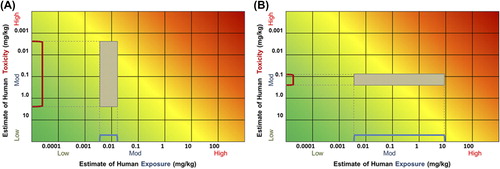
Creating the exposure-toxicity intersection using two ranges is straightforward; the area enclosed by the intersection of the two ranges forms the area in the two representative plots shown in .
Figure 5. Exposure-toxicity intersection formed from two ranges. (A) Illustrates a scenario where there is a wide range of toxicity values, but a fairly narrow range of exposure estimates. (B) Illustrates a scenario where there is a wide range of exposure values but a fairly narrow range of toxicity estimates.
Intersection formed from a point value and range for exposure and a point value for toxicity with an AF applied
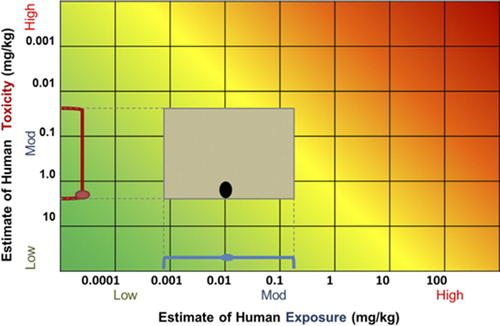
When one or both of the ranges have a mean, the means can also be illustrated on the matrix. shows an example where a range with a mean for exposure and a point estimate for toxicity for which a range has been created by the application of default adjustment factors are plotted. This allows one to visualize the relative contributions of the actual measured data versus that of applied adjustment factors toward the precision of the estimate.
Figure 6. Exposure-toxicity intersection formed from a mean with a range for exposure and a point value for toxicity to which a 100 ×adjustment factor has been applied.
Intersection formed from using two probability distributions
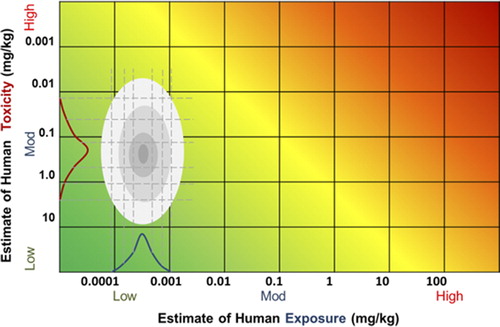
Mixing two probability distributions is less straightforward but it can be achieved using isoprobability contour mapping (CitationAbbas et al. 2010). The isoprobability contour or “isoprob” can be defined as a line that joins positions which are at the same difference in probability from where the median values of the two distributions intersect. shows an example of two normal probability distributions where the ovals are isoprobs representing +/−5% from the mean, +/−15% from the mean, +/− 30% from the mean and +/− 47.5% from the mean. This figure also shows how the isoprob contour can be applied to the RISK21 matrix.
Figure 7. Exposure-toxicity intersection formed from mixing two probability distributions showing isoprob contours.
Illustrative examples
The size of the area gives an indication of the precision of the estimate and its position provides an indication of relative risk or safety. Depending on the decision context, various next steps may be identified. Several examples illustrating the utility of the matrix are provided below.
Evaluation of additional data needs
By visualizing exposure and toxicity information concurrently, the RISK21 visualization matrix allows one to make determinations regarding what additional data, if any, should be generated in order to increase the precision necessary to make a decision. Suppose that the example shown in portrays the available information for a pesticide used on a specific crop type. For illustrative purposes, the acceptable safety level is indicated using a MOE of 1 (the yellow shaded zone). As currently plotted, there is not enough precision to enable a decision to be made. The shape of the box indicates that in order to refine the risk estimate, additional toxicity information will need to be generated, and that additional exposure refinement will not help in reaching a decision. In contrast, if the initial plot looked like , generating additional toxicity data would not be of value. The means to refine the risk estimate would be to assess the exposure scenario further.
Priority setting
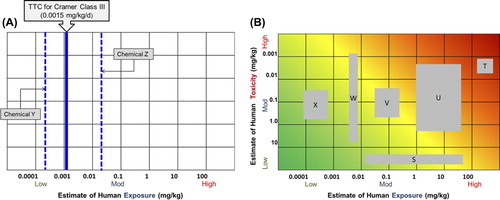
The RISK21 matrix is a useful tool in priority setting. It enables the user to prioritize which chemicals may require further assessment and to determine whether additional data gathering (for toxicity, exposure, or both) will be value-added. demonstrates how the matrix can be modified to apply the TTC as a low-tier prioritization and screening approach using only chemical structure and exposure information. In this example, chemical Y's estimated human exposure level lies well below the TTC for its associated Cramer Class and it would not be prioritized for additional assessment. Exposure to chemical Z is considerably higher and indicates that additional refinement is necessary before any decision on this chemical can be made. represents a plot of six chemicals that an organization is required to prioritize for further testing. In this scenario, one may utilize the matrix to determine which chemicals may require additional toxicity testing (W and U) or exposure refinement (S), and those which potentially have enough information for a decision to be made (e.g., additional data generation will not be valuable; X and T). This same approach could be applied for new product development, where decisions need to be made regarding which candidate chemicals will be prioritized for additional development based on potential risk.
Figure 8. Illustrative examples of the RISK21 visualization matrix used for priority setting. (A) Adaptation of the matrix to apply the Threshold of Toxicological Concern (TTC) as a low-tier prioritization and screening approach, using only chemical structure and exposure information; (B) Illustrative example of how the RISK21 matrix could be used for six chemicals for which both exposure and toxicity information is available.
Evaluation of new use or release scenario
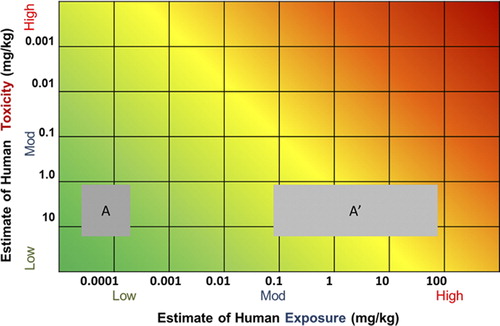
The RISK21 matrix can be used to evaluate the effect that a change in exposure scenario (e.g., different use or release of a chemical) may have on the overall risk picture. illustrates the initial exposure scenario (A), where the intersection is clearly in the green area of the plot. The modified or “new” exposure scenario (A’) demonstrates the potential for increased risk and may necessitate additional refinement or mitigation measures. Similarly, one could plot the likely impact of different risk management options, to determine which, if any, would achieve the desired mitigation and to enable ready ranking of the options for the magnitude of their impact.
Figure 9. Hypothetical plot of a single chemical before and after changes in its exposure scenario.
Conclusions
The RISK21 integrated evaluation strategy is a problem formulation based, exposure driven roadmap that takes advantage of existing information to graphically represent the intersection of exposure and toxicity data on a highly visual matrix. Transparent decisions can then be made to acquire additional data, depending on the level of precision needed to make a decision about safety and risk.
RISK21 emphasizes problem formulation and consideration of exposure at the beginning of the assessment. Problem formulation is a systematic way of identifying what needs to be known and helps chart the derivation of data. This step can be revisited to determine if there is enough precision in the data to make a safety decision.
This tiered approach to data development does not prescribe a list of studies that should be performed in a fixed order. It utilizes existing information to decide what data would be most useful based on the level of precision that is needed. Initial estimates of exposure and toxicity may have high variability and, consequently, significant uncertainty. Whereas such variability and uncertainty may be adequate for some assessments, reduction in uncertainty can be achieved with the targeted development of additional data. The RISK21 tiered approach reduces the time, resources, and number of animals required in an assessment while delivering adequate determinations of safety and risk for the decision context.
Quantification of the degree of certainty about exposure and toxicity at each stage in the process is a key principle of the RISK21 roadmap. This allows decisions to be made with more confidence and also enables the reasoning behind the decision to be communicated in a transparent manner.
The roadmap and visualization matrix can easily incorporate new methods. As they are developed, and together with improved ways of using existing methods, new methods can be brought into the framework. In this way the static nature of the 20th century testing regime (CitationHartung 2009) can be avoided. The framework will be constant, but the components within it can evolve as the science develops. It represents a step forward in the goal to introduce new methodologies into 21st century risk assessment.
Acknowledgements
The authors gratefully acknowledge the government, academic, and industry scientists of the HESI RISK21 Technical Committee for their contributions to this work. A full list can be accessed here: www.risk21.org
In particular, the authors thank Drs Gordon Barrett (Health Canada), Cheryl Bellin (DuPont), Penny Fenner-Crisp (consultant), Jay Goodman (Michigan State University), Abigail Jacobs (USFDA), Glenn Rice (USEPA), Ken Sexton (University of TX, Houston), Martin Stephens (Johns Hopkins), Claire Terry (Dow Chemical), and Korinna Wend (BfR, Germany) for their critical review of the manuscript.
Declaration of interest
This manuscript was prepared under the auspices of the International Life Sciences Institute Health and Environmental Sciences Institute (ILSI HESI), a non-profit organization aimed at engaging scientists from academia, government, industry, research institutes, and NGOs to identify and resolve global health and environmental issues. ILSI HESI collects funding from member companies to support projects. The authors’ affiliations are as shown on the cover page. The authors had sole responsibility for the writing and content of the paper. The views and opinions expressed in the paper are those of the authors, and do not necessarily reflect the views of the authors’ employers or the opinions or policies of the US EPA or NIH. Mention of trade names does not constitute endorsement. None of the authors has recently or is currently involved as an expert witness in litigation or formal government rule-making on the subject of this paper. The authors employed by ILSI HESI participated as part of their normal employment. No other authors received financial support or an honorarium in the preparation of this paper. The authors declare that there are no conflicts of interest.
References
- Abbas AE, Budescu DV, Gu Y. (2010).Assessing joint distributions with isoprobability contours.Manag Sci, 56, 997–1011.
- Casarett LJ, Doull J, Klaassen CD. (2013).Casarett and Doull's Toxicology: The Basic Science of Poisons, 8th ed. New York: McGraw-Hill Medical Pub. Division.
- Collins English Dictionary - Complete & Unabridged 10th Edition 2009 © William Collins Sons & Co. Ltd. 1979, 1986 © HarperCollins Publishers 1998, 2000, 2003, 2005, 2006, 2007, 2009.
- Comprehensive Environmental Response, Compensation and Liability Act of 1980. Pub.L. 96-510, 42 U.S.C. §§ 9601–9675, December 11, 1980.
- Dellarco M, Zaleski R, Gaborek BJ, Qian H, Bellin CA, Egeghy P, et al. (2014).RISK21 Tiered Exposure Assessment including Exposure Bands for Rapid Decision-Making. In preparation.
- ECETOC. (2012).ECETOC TRA version 3: Background and rationale for the improvements. Technical report No 114. European Centre for Ecotoxicology and Toxicology of Chemicals, Brussels, July 2012.
- Food Quality Protection Act of 1996.Pub.L. 104–170, 7 U.S.C. §§ 136, August 3, 1996.
- Goldstein BD. (2011).Risk assessment of environmental chemicals: if it ain't broke.Risk Anal, 31, 1356–62.
- Hartung T. (2009).Toxicology for the twenty-first century.Nature, 460, 208–12.
- Juberg DR, Bus J, Katz DS. (2008).The opportunities and limitations of biomonitoring. Mackinac Center Policy Brief. No. S2008-01. ISBN: 1-890624-73-X. Available at:www.mackinac.org/9244 [Accessed 10 January 2014].
- Judson RS, Kavlock RJ, Setzer RW, Cohen Hubal EA, Martin MT, Knudsen TB, et al. (2011).Estimating toxicity-related biological pathway altering doses for high-throughput chemical risk assessment.Chem Res Toxicol, 24, 451–62.
- Kroes R, Kleiner J, Renwick AG. (2005).The threshold of toxicological concern in risk assessment.Toxicol Sci, 86, 226–30.
- Meek, ME, Boobis, AR, Cote, I, Dellarco, V, Fotakis, G, Munn, S, et al. (2013).New developments in the evolution and application of the WHO/IPCS framework on mode of action/species concordance analysis.J Appl Toxicol, 34, 1–18.
- National Academy of Sciences. (2009). Science and Decisions: Advancing Risk Assessment. Washington, DC, USA: National Research Council of the National Academies. 363 p.
- OECD. (2007).Guidance Document on the Validation of (Q)SAR Models. Series on Testing and Assessment, No. 69.
- Pastoor TP, Bachman AN, Bell DR, Cohen SM, Dellarco M, Dewhurst IC, Doe JE, et al. (2014).A 21st century roadmap for human health risk assessment.Crit Rev Toxicol, 44, 1–5.
- Rotroff DM, Wetmore BA, Dix DJ, Ferguson SS, Clewell HJ, Houck KA, et al. (2010).Incorporating human dosimetry and exposure into high-throughput in vitro toxicity screening.Toxicol Sci, 117, 348–58.
- Safe Chemicals Act of 2013. S. 696, 113th Congress. (2013).
- Safe Drinking Water Act Amendments of 1996. Pub.L. 104-182, 110 Stat 1613. August 6, 1996.
- Schilter B, Benigni R, Boobis A, Chiodini A, Cockburn A, Cronin MT, et al. (2014).Establishing the level of safety concern for chemicals in food without the need for toxicity testing.Regul Toxicol Pharmacol, 68, 275–96.
- Sheldon LS. (2010).Exposure framework. In: Krieger RI, Doull J, van Hemmen JJ, Hodgson E, Maibach HI, Ritter L, et al., Ed. Handbook of Pesticide Toxicology, Vol. 1, 3rd ed. Burlington, MA, USA: Elsevier, pp. 971–6.
- Simon TW, Simons SS, Preston RJ, Boobis AR, Cohen SM, Doerrer NG, et al. (2014).The use of mode of action information in risk assessment: quantitative key events/dose-response framework for modeling the dose-response for key events.Crit Rev Toxicol, 44, 17–43.
- SCCS, SCHER, SCENIHR. (2012).Joint Opinion on the Use of the Threshold of Toxicological Concern (TTC) Approach for Human Safety Assessment of Chemical Substances with focus on Cosmetics and Consumer Products, 8 June 2012 (www.ec.europa.eu/health/scientific_committees/consumer_safety/docs/sccs_o_092.pdf) (accessed 6 May, 2014).
- Thomas RS, Philbert MA, Auerbach SS, Wetmore BA, Devito MJ, Cote I, et al. (2013).Incorporating New Technologies into Toxicity Testing and Risk Assessment: Moving from 21st Century Vision to a Data-Driven Framework.Toxicol Sci, 136, 4–18.
- United States Congress. 2013. S. 696: Safe Chemicals Act of 2013. 113th Congress. Available at: www.govtrack.us/congress/bills/113/s696/text [Accessed 10 January 2014].
- United States Environmental Protection Agency. (1992). Guidelines for Exposure Assessment. U.S. Environmental Protection Agency, Risk Assessment Forum, Washington, DC, EPA/600/Z-92/001.
- United States Environmental Protection Agency. (1998). Guidelines for Ecological Risk Assessment. Washington, DC, USA: United States Environmental Protection Agency. Risk Assessment Forum. Report 191 p.
- Walker KD, Evans JS, MacIntosh D. (2001).Use of expert judgment in exposure assessment Part I. Characterization of personal exposure to benzene.J Expo Anal Environ Epidemiol, 11, 308–22.
- Walker WE, Harremoes P, Rotmans J, Van Der Sluijs JP, Van Asselt MBA, Janssen P, Krayer Von Krauss MP. (2003).Defining uncertainty a conceptual basis for uncertainty management in model-based decision support.Integr Assess, 4, 5–17.
- World Health Organization. (2009).Principles and methods for the risk assessment of chemicals in food. EHC 240. Available at: www.who.int/foodsafety/chem/principles/en/index1.html [Accessed 10 January 2014].