
Some 50–80% of patients with acute myeloid leukemia (AML) achieve a complete remission with contemporary chemotherapy protocols, yet the majority of them eventually relapse with resistant disease: some patients no longer respond to chemotherapy at disease recurrence; others accomplish second and even third remissions whose decreasing duration nevertheless indicates that the pool of residual leukemic cells, i.e. of cells that persisted during treatment with cytotoxic drugs, increases with every round of therapy [Citation1]. Either of these clinical courses therefore reflects an enhanced chemotherapy resistance of leukemic cells at relapse as compared to the cell population at diagnosis. Molecular changes enabling malignant cells to survive exposure to cytotoxic drugs may already have been present in a subset of the leukemic cell population at presentation, or may emerge during treatment [Citation2,Citation3], but in any case are thought to be selected as a consequence of drug therapy, and to play a major role in therapy resistance at relapse. Remarkably, however, even though various types of molecular alterations may be acquired at relapse, neither specific cytogenetic alterations nor functionally relevant point mutations as identified by whole genome sequencing were associated with relapse in a recurrent manner [Citation2,Citation3]. Certain copy number variations and known AML associated point mutations were newly present at relapse in small proportions of patients (usually < 10%), but the latter were lost in other patients, indicating that they are unlikely to represent drivers of therapy resistance at disease recurrence [Citation4]. These findings could either indicate that chemotherapy resistance at relapse is acquired through a large variety of different mechanisms, or that molecular changes of other types than those mentioned above are of more general relevance in this context. Indeed, an earlier study has suggested that the expression of specific genes may change in a consistent manner between diagnosis and relapse of AML [Citation5]. However, only a limited number of genes and mostly unpaired samples were probed in this investigation. Therefore, in the present study, genes whose expression changed in a relapse-specific manner were sought in a set of paired AML samples and on a genome-wide scale. To limit the genetic heterogeneity of the study population, only samples from patients with cytogenetically normal (CN) AML were used.
Clinical characteristics of 11 patients with CN AML from whom samples had been obtained at the time of diagnosis and of relapse are summarized in Supplementary Table I available online at http://informahealthcare.com/doi/abs/10.3109/10428194.2014.944523. Patients provided written informed consent prior to sample collection, and the reported studies were approved by the ethics committee of the Medical University of Vienna (EK 179/2011). Mononuclear cells were enriched through Ficoll gradient centrifugation, and RNA was extracted and hybridized to human ST1.1 microarrays (Affymetrix). Primary data analysis was performed using the Robust Multi-array Average algorithm. The levels of 4679 genes that displayed variable expression (i.e. an interquartile range of the log2 transformed data of > 0.65 across all samples) were compared between diagnosis and relapse samples using a paired moderated t-test (R-package limma), followed by multiple hypothesis correction according to Benjamini and Hochberg [Citation6]. These analyses revealed that 536 unique genes were up- and 551 down-regulated at relapse at a false discovery rate (FDR) < 10% (, Supplementary Table II available online at http://informahealthcare.com/doi/abs/10.3109/10428194.2014.944523).
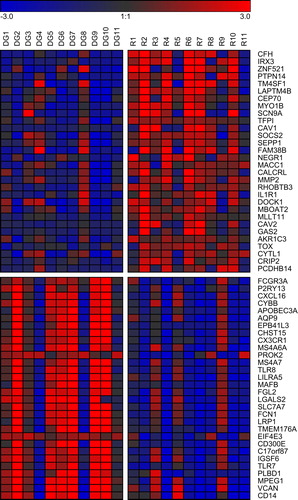
Figure 1. Genes differentially expressed between diagnosis and relapse of CN AML. Log2 fold changes compared to the mean of all samples are displayed for the 30 most up- and the 30 most down-regulated genes (i.e. significantly differentially expressed genes with the highest positive and negative mean log2 fold changes between the two disease states). Red, gene expression above the mean; blue, gene expression below the mean. DG, diagnosis; R, relapse.
Because relapse of AML is considered to result from the outgrowth of usually largely quiescent, chemotherapy resistant leukemic stem cells (LSCs), a possible relationship between LSC and relapse-associated gene expression signatures was investigated. Gene expression profiles of LSC enriched versus LSC depleted human AML cell populations, functionally defined based on their engraftment ability in an optimized xenotransplant assay, were recently reported [Citation7]. Of the 163 genes up-regulated in LSC enriched cell populations at an FDR < 10%, 19 were also up-regulated at relapse (p = 6.3 × 10− 7, odds ratio 4.29; Fisher's exact test). Similarly, 14 of the 41 genes down-regulated in LSCs were also down-regulated at relapse (p = 1.2 × 10− 11, odds ratio 16.36; Fisher's exact test), but no genes were regulated in an opposite manner in the two conditions (Supplementary Table II available online at http://informahealthcare.com/doi/abs/10.3109/10428194.2014.944523).
To further explore relations between the relapse-associated gene expression profile and gene expression patterns associated with LSCs, as well as with normal hematopoietic stem cells (HSCs) and with prognosis in AML, gene set enrichment analysis (GSEA) [Citation8] was performed. The 4679 genes whose expression had been compared between diagnosis and relapse of CN AML were ranked according to their associated t-statistic. The following gene lists were then probed against this relapse-associated gene expression profile: (i) genes up-regulated in functionally defined LSC enriched versus LSC depleted human AML cell populations [Citation7]; (ii) genes up- or down-regulated in LSCs versus other leukemic cells as defined by the expression of cell surface markers [Citation9]; (iii) genes up-regulated in HSCs versus progenitor and differentiated hematopoietic cells defined by specific cell surface markers [Citation7]; and (iv) genes whose increased or decreased expression was associated with poor outcome in AML [Citation10,Citation11], or in the subgroup of CN AML [Citation12]. Of note, the LSC and HSC signatures were related to each other [Citation7], and, even though not defined on this basis, were able to predict chemotherapy responsiveness in AML [Citation7,Citation9]. All gene lists were used as reported, without any modifications. Where available, the corresponding lists of down-regulated genes were also probed, but in several cases these were either not reported, or too short to be useful for GSEA. In agreement with relapse representing a chemotherapy resistant state, the functionally defined LSC signature [Citation7] and the HSC signature [Citation7], as well as the three gene expression signatures linked to poor outcome in AML [Citation10–12], were significantly enriched in the relapse-associated gene expression profile (). Conversely, the list of genes down-regulated in patients with poor response to chemotherapy [Citation10] was significantly negatively enriched in the relapse profile (while only small numbers of genes were down-regulated in poor responders in [Citation11,Citation12]), as was the list of genes down-regulated in surface-marker defined LSCs [Citation9] ().
Figure 2. Gene signatures associated with LSCs, HSCs and poor therapy response are enriched in the CN AML relapse profile. Lists of genes associated with functionally defined LSCs [Citation7], cell surface marker-defined HSCs [Citation7], poor response to chemotherapy [Citation10–12] or marker-defined LSCs [Citation9] were probed against the relapse-associated gene expression profile, ranked according to each gene's associated t-statistic, using gene set enrichment analysis (GSEA) [Citation8]. The number of genes present in the relapse profile, as well as the total number of genes, is indicated for each signature. NES, normalized enrichment score; FDR, false discovery rate. Similar results were obtained when genes were ranked according to their log2 fold change between the two disease states.
![Figure 2. Gene signatures associated with LSCs, HSCs and poor therapy response are enriched in the CN AML relapse profile. Lists of genes associated with functionally defined LSCs [Citation7], cell surface marker-defined HSCs [Citation7], poor response to chemotherapy [Citation10–12] or marker-defined LSCs [Citation9] were probed against the relapse-associated gene expression profile, ranked according to each gene's associated t-statistic, using gene set enrichment analysis (GSEA) [Citation8]. The number of genes present in the relapse profile, as well as the total number of genes, is indicated for each signature. NES, normalized enrichment score; FDR, false discovery rate. Similar results were obtained when genes were ranked according to their log2 fold change between the two disease states.](/cms/asset/a5e355bf-28b6-4972-901a-dbb10c648420/ilal_a_944523_f0002_oc.jpg)
The data presented in this report show that, in contrast to other investigated molecular alterations, changes in the expression of specific genes are associated with relapse of CN AML in a recurrent and significant manner. Corroborating the assumption that these changes indeed reflect, and possibly contribute to, a state of increased therapy resistance, the relapse-associated gene expression profile was enriched for gene signatures connected to poor outcome. Furthermore, a significant enrichment for gene expression signatures associated with LSCs was observed, thereby supporting the concept that relapse of AML results from the outgrowth of chemotherapy resistant LSCs and is associated with increased “stemness.” At the intersection of the relapse and the LSC signatures, a number of genes with potential roles in chemotherapy resistance were uncovered. For example, the gene coding for integrin α6, ITGA6, was expressed at elevated levels at relapse and in LSCs (Supplementary Table II available online at http://informahealthcare.com/doi/abs/10.3109/10428194.2014.944523). It was also up-regulated in AML cells with high levels of EVI1, which itself is a harbinger of a poor prognosis, and contributed to their therapy resistance [Citation13]. Similarly, targeted deletion of interferon regulatory factor 8 (IRF8), which was down-regulated both at relapse of CN AML and in LSCs (Supplementary Table II available online at http://informahealthcare.com/doi/abs/10.3109/10428194.2014.944523), increased proliferation and reduced apoptosis of myeloid cells in vitro, and promoted leukemogenesis in a mouse model [Citation14]. In metastatic colon cancer cell lines, its methylation mediated down-regulation also contributed to apoptosis resistance [Citation15]. Functional analyses of these and other genes at the intersections of LSCs, chemotherapy resistance, and relapse can be expected to yield novel insights into the biology of AML, and may lead to the discovery of novel targets for rationally designed therapies.
Notice of correction
Since this article was published online on the 18th August 2014, we have been notified of an acknowledgement. This version of the article is now corrected.
Supplementary material available online
Supplementary Tables I and II showing patient’s clinical data and genes differentially expressed between diagnosis and relapse of CN AML.
ilal_a_944523_sm6474.xlsx
Download MS Excel (11.5 KB)ilal_a_944523_sm6466.xlsx
Download MS Excel (113.5 KB)ilal_a_944523_sm6485.zip
Download Zip (4.3 MB)Acknowledgement
This work was funded by the Austrian Science Foundation (FWF), grants no P19795 and P21401 to R.W.
Potential conflict of interest
Disclosure forms provided by the authors are available with the full text of this article at www.informahealthcare.com/lal.
References
- Forman S, Rowe J. The myth of the second remission of acute leukemia in the adult. Blood 2013;121:1077–1082.
- Kern W, Haferlach T, Schnittger S, et al. Karyotype instability between diagnosis and relapse in 117 patients with acute myeloid leukemia: implications for resistance against therapy. Leukemia 2002;16:2084–2091.
- Ding L, Ley T, Larson D, et al. Clonal evolution in relapsed acute myeloid leukaemia revealed by whole-genome sequencing. Nature 2012;481:506–510.
- Parkin B, Ouillette P, Li Y, et al. Clonal evolution and devolution after chemotherapy in adult acute myelogenous leukemia. Blood 2013;121:369–377.
- Staber P, Linkesch W, Zauner D, et al. Common alterations in gene expression and increased proliferation in recurrent acute myeloid leukemia. Oncogene 2004;23:894–904.
- Benjamini Y, Hochberg Y. Controlling the false discovery rate: a practical and powerful approach to multiple testing. J R Stat Soc B 1995;57:289–300.
- Eppert K, Takenaka K, Lechman E, et al. Stem cell gene expression programs influence clinical outcome in human leukemia. Nat Med 2011;17:1086–1093.
- Subramanian A, Tamayo P, Mootha V, et al. Gene set enrichment analysis: a knowledge-based approach for interpreting genome-wide expression profiles. Proc Natl Acad Sci USA 2005;102:15545–15550.
- Gentles A, Plevritis S, Majeti R, et al. Association of a leukemic stem cell gene expression signature with clinical outcomes in acute myeloid leukemia. JAMA 2010;304:2706–2715.
- Heuser M, Wingen L, Steinemann D, et al. Gene-expression profiles and their association with drug resistance in adult acute myeloid leukemia. Haematologica 2005;90:1484–1492.
- Li Z, Herold T, He C, et al. Identification of a 24-gene prognostic signature that improves the European LeukemiaNet risk classification of acute myeloid leukemia: an international collaborative study. J Clin Oncol 2013;31:1172–1181.
- Metzeler K, Hummel M, Bloomfield C, et al. An 86-probe-set gene-expression signature predicts survival in cytogenetically normal acute myeloid leukemia. Blood 2008;112:4193–41201.
- Yamakawa N, Kaneda K, Saito Y, et al. The increased expression of integrin alpha6 (ITGA6) enhances drug resistance in EVI1(high) leukemia. PLoS One 2012;7:e30706.
- Konieczna I, Horvath E, Wang H, et al. Constitutive activation of SHP2 in mice cooperates with ICSBP deficiency to accelerate progression to acute myeloid leukemia. J Clin Invest 2008;118: 853–867.
- Yang D, Thangaraju M, Greeneltch K, et al. Repression of IFN regulatory factor 8 by DNA methylation is a molecular determinant of apoptotic resistance and metastatic phenotype in metastatic tumor cells. Cancer Res 2007;67:3301–3309.