
Abstract
Objective: To evaluate the peripheral blood mononuclear cell (PBMC) expression levels of hemeoxygenase 1 (HMOX-1), superoxide dismutase 1 (SOD-1), vascular endothelial growth factor A (VEGF-A), transforming growth factor beta 1 (TGF-β1), interleukin (IL)-6, IL-15 and AdipoQ genes to study their association with preeclampsia (PE). Methods: A total of 177 pregnant women were recruited: 108 cases and 69 controls. Quantification of gene expression was measured by quantitative real-time polymerase chain reaction (PCR) using TaqMan probes. Results: Underexpression of VEGF-A and TGF-β1 was a constant in most of the cases (80.91% and 76.36%, respectively) and their expression was associated with onset and/or severity of disease (p values < 0.05). IL-6, IL-15 and AdipoQ, showed low or no expression in PBMC samples evaluated. Conclusion: PBMC underexpression of VEGF-A and TGF-β1 is a hallmark of PE in the study population.
Background
Preeclampsia (PE) is included within a spectrum of conditions known as hypertensive disorders of pregnancy. PE is defined as hypertension and proteinuria and frequently occurs in the second trimester of pregnancy (Citation1). Signs and symptoms of the disease include edema, headache, and in severe cases it is associated with damages to the liver and kidney, clotting abnormalities and intrauterine growth retardation (Citation2). In Mexico, PE represents the first cause of maternal death with a frequency of 25% among women in gestation stage and worldwide the frequency of the disease ranges between 10% and 25% (Citation3–5).
The etiology of PE is still unknown, although genetic, immunologic and infectious risk factors have been described. The pathological pathways of disease involve an abnormal placental implantation process and consequently, oxidative stress and endothelial dysfunction (Citation1,Citation6–8). Due to the pathological processes involved, PE biomarker research has focused on the identification of the components (nucleic acids and proteins) implicated in these pathways. In this sense, placental and circulating mRNA/proteins of genes such as vascular endothelial growth factor A (VEGF-A), placental growth factor (PGF), transforming growth factor beta 1 (TGF-β1), hemeoxygenase 1 (HMOX-1), superoxide dismutase 1 (SOD-1), adiponectin (AdipoQ), interleukins 6 (IL-6) and 15 (IL-15), respectively, have been associated with PE, some with controversial results (Citation9–16). Recent evidence shows that placental and trophoblast remains may be released into the peripheral blood of pregnant women and can be used for the identification of pathological pregnancies such as PE (Citation17,Citation18). Considering that these “peripheral artifacts” may reflect the pathological process of the preeclamptic placenta and consequently induce a change in gene expression in blood circulating cells, we evaluated the association between mRNA levels in human peripheral blood mononuclear cells (PBMCs) of seven genes (HMOX-1, SOD-1, VEGF-A, TGF-β1, IL-6, IL-15 and AdipoQ) and PE in Mexican women. Additionally, their capacity to discriminate severity and onset PE was also tested.
Methods
Patients and Samples Collection
A total of 177 pregnant women with singleton pregnancy (108 PE cases and 69 normotensive controls) were enrolled from the High Risk Pregnancy Outpatient Service of the Unidad Medica de Alta Especialidad (UMAE) # 23 of the Instituto Mexicano del Seguro Social (IMSS) in Monterrey, Mexico, between September 2009 and April 2010. They provided written informed consent for their participation. Institutional Review Board approval was obtained (1905 Local Committee, ID number R-2010-1905-17) and the study was conducted in accordance with the Helsinki Declaration.
The PE cases were diagnosed according to general guidelines of the International Society for the Study of Hypertension in Pregnancy (Citation19). PE was considered as severe if the patient had a blood pressure ≥160 mm Hg systolic or ≥110 mm Hg diastolic on two occasions at least 6 h apart while the patient was at bed rest, and a proteinuria of 5 g or more in a 24-h urine specimen, or 3+ or greater in two random urine samples collected at least 4 h apart. The sub-classification of the cases group for early-late PE was made considering that additional maternal risk, such as maternal mortality is some 20-fold higher at less than 32 gestation weeks (GWs) than when PE occurs at term. Early PE was considered if present before 32 GW and late PE as that occurring with more than 32 GW (Citation20,Citation21). The control group consisted of normotensive women with uncomplicated pregnancies. Study exclusion criteria included chronic hypertension, chronic renal disease, gestational hypertension, gestational diabetes mellitus, and underlying medical diseases such as rheumatoid arthritis and systemic lupus erythematous. All patients provided a peripheral blood sample at the time of diagnosis (PE cases) or when they entered the protocol (controls). The blood samples were collected using EDTA collection tubes and were processed quickly in a period not longer than 30 min.
Gene Selection
Selection of the study genes was made according to their association with PE and/or their central role on the pathologic processes of the disease cited in previous reports (Citation7,Citation9,Citation10,Citation12–18,Citation22–25). Seven genes involved in oxidative stress (HMOX-1, SOD-1), angiogenesis-related events (VEGF-A, TGF-β1) and inflammation pathways (IL-6, IL-15, AdipoQ), were included.
RNA Isolation and cDNA Synthesis
Mononuclear cells were purified by the standard Histopaque®-1077 (Sigma-Aldrich®, St. Louis, MO) protocol. Total RNA was isolated from cells according to the QiagenRNeasy® Mini Kit protocol (Qiagen, West Sussex, UK). RNA concentration and its quality were measured using a NanoDrop Spectrophotometer (NanoDrop Technologies, Wilmington, DE). cDNA was synthesized from 1 µg of total RNA using SuperScriptTM III First-Strand Synthesis Super Mix and random hexamers (Invitrogen, Carlsbad, CA) according to the manufacturer's indications. cDNA samples were stored at −20°C until use.
Quantitative Real-Time PCR
Validation of qPCR assays
Efficiency, linear dynamic range of each quantitative real-time PCR (qPCR) assay, and the selection of the endogenous gene, were assessed by the construction of standard curves (Citation26,Citation27). In this stage, two pools of cDNAs were used: the first from normotensive women (controls); the second from women with a diagnosis of severe PE. cDNA from human microvascular endothelial cell line (HMEC-1) (Citation28) was included as a positive control, in all the determinations (Supplementary file S1, shows the culture conditions for this cell line). Five serial dilutions of each cDNA were made in a concentration range from 345.4 ng to 2762.9 ng. All the qPCR reactions were performed in a final volume of 10 μL, 1X of TaqMan Universal PCR Master mix and 1X of the TaqMan Gene Expression Assay primer and probe mix. Each assay was made in triplicate for the target gene of interest (HMOX-1 – Hs01110250_m1, SOD-1 – Hs00916176_m1, VEGF-A – Hs99999070_m1, TGF-β1 – Hs99999918_m1, IL-6 – Hs00174131_m1, IL-15 – Hs00174106_m1 and AdipoQ – Hs006605917_m1) or for hypoxanthine phosphoribosyltransferase (HPRT1), 18S ribosomal and glyceraldehyde-3-phosphate dehydrogenase (GAPDH) endogenous genes. qPCR reactions were performed on StepOne Plus Real-Time PCR System (Applied Biosystems, Foster City, CA) according to the manufacturer's instructions.
To select the quantification method, the PCR efficiency of both, the gene of interest and each endogenous gene, was determined considering the variation of Ct values with template dilution (Ct gene – Ct endogenous) (ΔCt). In this step, Ct values were generated from an equivalent standard curve. Consequently, the ΔCt values were plotted against log input amount and the slope value was obtained from a semi-log regression line. The absolute value of the slope of ΔCT versus a log input <0.1 was considered as a criterion for passing the validation experiment.
The choice of the endogenous gene was made considering three criteria: (Citation1) The most consistent and uniform expression (Ct value) in the different cDNA pools used in the construction of standard curves; (Citation2) amplification efficiency similar or equal to the interest gene according to the absolute value of its slope (slope of ΔCt versus log input <0.1); and relative abundance of its expression (more abundantly expressed than the target gene).
Determination of gene expression level
During the quantification of gene expression using the qPCR assay, 500 ng of cDNA from each patient sample were used in duplicate for the amplification round (according to the mixing conditions previously described). In each plate, a standard curve consisting of five points using cDNA from HMEC-1 cell line, in a concentration range of 32.32–1034.2 ng was included in triplicate. Ct values were normalized to the HPRT1 endogenous gene and gene expression was calculated as fold-change relative to the average of expression in the controls.
Statistical Analysis
Comparisons of risk factors and the clinical and personal characteristics among groups were performed using the Mann–Whitney U-test for continuous variables and Chi-square or Fisher's exact test for categorical variables. Differences between numerical data of gene expression and PE severity or onset of PE were made using Student’s t test or the Mann–Whitney U-test. The association between PE severity, PE onset and proportions of gene under/over expression was made using the Chi-square test, considering a cutoff point of under- or overexpression of 20% in the expression rate of change (fold change ≥1.2) compared with controls. The odds ratio (OR) was calculated for significant comparisons. Statistical analysis was performed considering a significance level of 0.05 in Sigma Plot v11.0 software.
Results
A total of 177 pregnant women (108 PE cases: 60 mild and 48 severe PE, and 69 controls) 15–40 years of age, with a singleton pregnancy between 21 and 38 GW were included in the protocol. Thirty-seven percent of the cases were diagnosed with PE before 34 GW (early PE) and the remaining 63% had a late onset of disease (34–37 GW). shows the general characteristics of the study groups. There were no differences in risk factors (such as use of barrier contraceptive method, family history of PE, maternal age or number of pregnancies) between cases and controls (p > 0.05).
Table 1. General characteristics and risks factors for PE of the study population.
The results of the qPCR assays validation, including the values related to endogenous gene selection, efficiencies of amplification and the choice of quantitative method, are summarized in and , respectively. GAPDH and HPRT1 genes showed the most consistent and uniform expression (Ct value) in the samples used in the construction of standard curves (). GAPDH expression showed more stability (p = 0.581) than HPRT1 (p = 0.307); both genes had Ct values closest to those obtained for the target genes, and were more abundantly expressed than them. Despite HPRT1 slope values were lower than the GAPDH (), both genes are endogenous suitable for PBMC gene expression experiments. However, in this study, HPRT1 gene was chosen as endogenous control because placental oxidative stress is a hallmark of PE (Citation29,Citation30) and GAPDH gene has a defined role in this process (Citation31,Citation32).
Table 2. Endogenous gene selection.
Table 3. Selection of the quantification method.
shows the absolute slope values obtained from semi-log regression of the ΔCT versus log input plot of VEGF-A, TGF-β1 and HMOX-1 genes, respectively (see Materials and methods section for details). Due to the fact that the slope absolute values were higher than 0.1 (criterion for passing the validation experiment), the quantitative method of the relative standard curve was selected over the 2−ΔΔCt method for all genes evaluated in the study.
According to the presence/absence of expression of the genes included in the study, the potential usefulness of HMEC-1 cell line for the construction of standard curves was evaluated. Our results showed that seven genes of interest were expressed in this cell line (Supplementary Table S1) and consequently its cDNA was included as a reference in the quantification stage.
In our study, IL-6, IL-15 and AdipoQ genes, showed low (Ct values above 35) or no real time PCR amplification in the patients samples used in the validation assays. These results were consistent even in spite of having an increased quantity of cDNA (data not shown) and these genes were excluded from subsequent stages of the analysis. and show the results obtained from evaluation of the expression levels of HMOX-1, SOD-1, VEGF-A and TGF-β1 genes. In general, all PE cases independently of severity and onset of the disease, showed uniform expression levels distribution of HMOX-1 and SOD-1 genes, in a range of −4.1–2.6 for HMOX-1, and −3.6–5.5 for SOD-1, respectively; only an outlier expression value (−12.0) was observed for HMOX-1 gene (). VEGF-A and TGF-β1 underexpression was predominantly observed in an 80.91% and 76.36% of PE cases. Expression levels for these genes were ranged from −4.9 to 7.8 for VEGF-A gene, and from −37.6–35.5 for TGF-β1, respectively. The mean expression was 1.8 for VEGF-A and −10.2 for TGF-β1 (). There were no differences in the expression levels of the study genes between PE subgroups (p > 0.05).
Figure 1. Distribution of gene expression levels in the PE cases. Selected genes (VEGF-A, TGF-β1, HMOX-1 and SOD-1, respectively) were analyzed by real-time PCR. Total PBMC RNA isolated from normal pregnant women (n = 69) and women with PE (n = 108) were analyzed. Gene expression was calculated using the relative standard curve method and was expressed as fold-change relative to the average of expression in the controls.
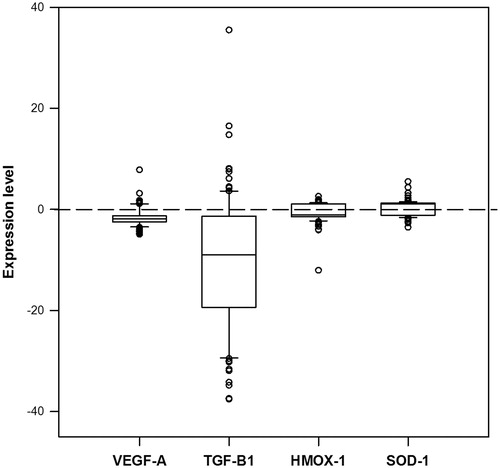
Table 4. Gene expression level of the study genes.
The association between PE severity and the expression of the interest genes was evaluated considering a rate of change of 20%. In this approximation, the mild and severe PE cases were sub-classified according to their HMOX-1, SOD-1, VEGF-A and/or TGF-β1 genes over/under expression (). Patients with a rate of expression lower than 20% for these genes were excluded from the analysis. According to the data mentioned above 32.7% of the cases were excluded from HMOX-1 analysis, 31.8% were eliminated from SOD-1 evaluation and 10.3% of PE women were not considered for VEGF-A association tests. TGF-β1 expression rates were higher or equal to 20% in all the PE cases and therefore, all of them were included in the analysis. displays the results obtained from the association between PE severity and over/under expression level status of HMOX-1, SOD-1, VEGF-A, and TGF-β1 genes, respectively. Considering only cases with a minimal differential rate expression of change of 20% for the interest gene, the proportion of severe PE patients with overexpression of TGF-β1 was higher (33.3%) than that observed for mild PE cases (15.3%) (OR = 2.78; 95% CI: 1.1–7.0; p = 0.028). Expression levels of HMOX-1, SOD-1 and VEGF-A genes were not associated to severity of the disease (). In a similar approximation, the association between PE onset and the gene expression level of the study genes was assessed (). Considering a rate of change of 20% only the overexpression of VEGF-A significantly increased the odds of early PE by 6.1 times (95% CI: 1.16–32.13) among the study population (p = 0.048).
Table 5. Analysis of PE cases with an expression fold change of 20% for the evaluated genes and their association with severity and/or onset of disease.
Discussion
PE is a pregnancy-specific hypertensive syndrome that causes substantial maternal and fetal morbidity and mortality (Citation23). The origin of this pathology is unknown; however, both the theory on which clinical PE is a result of factors released by the placenta into the circulation, generating a widespread maternal vascular endothelial dysfunction, and the knowledge that some placental abnormalities and utero-placental ischemia may induce the detachment of placenta micro-particles into the mother's blood stream, converge in the common PE pathologic processes that include vascular injury, inflammation and an increased oxidative stress. In this study, we test the possibility that placental factors or placental remains released into maternal circulation as a reflection of the pathological process of PE could induce a change in gene expression of seven genes in maternal PBMC from Mexican women. We found that at the mRNA level, maternal PBMC expression of IL-6, IL-15 and AdipoQ genes were not a useful tool to discriminate PE cases from normotensive controls because their quantification was close to the reliable limit for real time PCR detection. Compared with healthy pregnancies, IL-6, IL-15 and AdipoQ circulating proteins, have shown to be differentially expressed in complicated pregnancies including PE (Citation14,Citation33,Citation34); however, their expression levels in PBMC from PE women have not been previously reported. These differences between studies are not unexpected and may be explained considering that protein quantification in previous reports has been determined in early stages of pregnancy when clinical PE was not present. The low PBMC expression of these genes in our study may be a consequence of pregnancy stages in which PE is already established; on the other hand, maternal circulating proteins may be a reflection of their release by other tissues including placenta and not a direct contribution of maternal PBMC.
In this study, under- or overexpression of the oxidative stress-related genes HMOX-1 and SOD-1 in maternal PBMC were not a constant in PE cases, and their usefulness to discriminate severity or PE onset was not observed. Some studies have reported an increased HMOX-1 and SOD-1 protein level in plasma of PE women related to controls. More recently, Nakamura et al., described lower mRNA concentrations of HMOX-1, SOD-1, HMOX-2 and catalase, in the cellular component of blood from Japanese PE patients and their mRNA values correlated with PE severity (Citation13). Differences between this last report and our results may be related with differences between the studies designs and data analysis; for example, the blood cellular component used by Nakamura et al. in their protocol included all plasma-free blood components; it may include circulating trophoblast cells, or polymorphonuclear (such as neutrophils and eosinophils) cells. In our study, a PBMC separation using a density gradient was performed and therefore, our results represent only mRNA transcripts from blood cells within a specific density range. On the other hand, in this study, the expression level determination was made using the relative standard curve method whose data normalization involved an endogenous gene as a control of variations along sample manipulation. In the same sense, unlike plasmid constructs carrying the interest gene, we used HMEC-1 cDNA in the construction of standard curves and due to gene expression may be gestational-age dependent. A pool of RNA from normotensive controls (matched for GW) was used as a calibrator in data analysis. All the differences mentioned before could have an impact on the results obtained.
In this study, the expression levels of both, VEGF-A and TGF-β1 genes were markedly diminished in the cases group; this finding was obtained without the sub-classification of cases by severity or onset of disease; these results agree with the central role of angiogenesis throughout pregnancy and its recognized imbalance in the development of PE. VEGF-A is the most ubiquitous member of the vascular endothelial growth factors family. It is a hypoxia-induced gene, and is positively regulated by TGF-β1 and IL-6 in many cell types (Citation10). Throughout normal pregnancy, vascular health is maintained through VEGF-A and TGF-β1 binding to their respective membrane receptors (VEGF-R1, VEGF-R2 and TGF-βRII, respectively) (Citation11,Citation35) on the endothelial cells. In PE, VEGF-A and TGF-β1 pathways are antagonized by soluble proteins sFlt1 (soluble receptor of VEGF-A) and sEng (soluble co-receptor of TGF-β1). These anti-angiogenic soluble factors are a product of placental over secretion and cause local and systemic endothelial dysfunction (Citation36). Many studies have reported increased plasmatic protein levels of sFlt1, sEng, VEGF and TGF-β1, from pregnancies complicated by PE (Citation10), but their expression levels in PBMC had not been described. Our results suggest that VEGF-A and TGF-β1 production by PE PBMC may contribute in a small proportion in the increased protein level of these factors in maternal plasma, and it may be possible that elevated anti-angiogenic soluble proteins or other PE plasma components may have a negative effect on mRNA expression of VEGF-A and TGF-β1 in PBMC from PE women.
Unlike expression of HMOX-1 and SOD-1 genes, in this study, overexpression of VEGF-A was associated with an early onset of PE, and the overexpression of TGF-β1 with severity of the disease. Even when we observed significant differences between the proportions of PE cases with overexpression of VEGF-A or TGF-β1 genes in the study subgroups, such proportions involved a small number of patients with this condition (8 PE cases with an overexpression of VEGF-A and 25 with an overexpression of TGF-β1), therefore these association results should be considered cautiously.
It is important to note that about 30% of PE cases showed a rate of change for HMOX-1 and SOD-1 very similar to that of the controls (lower than 20%), so it was not possible to include them in the association tests. Interestingly, only 10.28% of PE cases showed this feature for the VEGF-A, and it was not present in any patient for TGF-β1. We consider that this range of differential expression of angiogenic-related genes is an important finding that may ensure reproducibility of the results, and could be considered in gene expression approaches for PE biomarkers.
In conclusion, our results show that the preeclamptic status is reflected on the expression level imbalance of VEGF-A and TGF-β1 genes in maternal PBMC. The association between PBMC IL-6, IL-15 and AdipoQ expression and PE could not be assessed; therefore, their potential role in the pathology of disease must be evaluated in future approximations.
Authors' contributions
M.L.M.F., I.G.V. and C.C.D.L.R. carried out the samples processing and the performance of expression studies and were involved in the preparation of manuscript. V.M.G., R.C.F., M.A.O.T., G.G.G., and J.I.B.A., participated in the design of the study and in the coordination of patient recruitment. K.C.S., I.P.R.S., C.O.C.M. and M.Z.O. participated in data acquisition, analysis and interpretation and reviewed the manuscript. I.G.V. was involved in the design of the study. M.L.M.F. conceived the study, participated in its design and coordination and performed the statistical analysis, and drafted the manuscript. All authors read and approved the final manuscript.
Declaration of interest
The authors declare that they have no competing interests. The authors are responsible for the content and writing of the research paper.
Supplementary Material
Download PDF (68.3 KB)Acknowledgments
We thank all the study participants. Also, the authors gratefully acknowledge the critical reading of the manuscript by María Guadalupe Ramos del Hoyo M. E.
This work was funded in part by FOMIX CONACyT-Gobierno del Estado de Zacatecas-121535 Grant, CB-SEP/CONACyT Grant-128567, and CONACyT-SSA/IMSS/ISSSTE Grant-138721, respectively.
References
- Pennington KA, Schlitt JM, Jackson DL, et al. Preeclampsia: multiple approaches for a multifactorial disease. Dis Model Mech 2012;5:9–18
- Carty DM, Delles C, Dominiczak AF. Novel biomarkers for predicting preeclampsia. Trends Cardiovasc Med 2008;18:186–94
- (SINAIS) SndIeS. Principales causas de mortalidad materna en México, 2005–2007. Available from: http://sinais.salud.gob.mx/descargas/xls/Princip_CausasMM_2005-2007.xls 2007
- Salud SD. Prevención, diagnóstico y manejo de la preeclampsia/eclampsia. 4th ed. México, DF: Lineamiento técnico; 2007
- Meads CA, Cnossen JS, Meher S, et al. Methods of prediction and prevention of pre-eclampsia: systematic reviews of accuracy and effectiveness literature with economic tructur. Health Technol Assess 2008;12:iii–iv, 1–270
- Balderas Pena LM, Vizcaino Magana CV, Hernandez Higareda S, et al. Lymphocyte subsets and preeclampsia. Ginecol Obstet Mex 2008;76:327–35
- Gonzalez C, Parra A, Ramirez-Peredo J, et al. Elevated vasoinhibins may contribute to endothelial cell dysfunction and low birth weight in preeclampsia. Lab Invest 2007;87:1009–17
- Cotran RS, Kumar V, Collins T. Patología tructural y tructural. 6th ed. México, D.F.: McGraw-Hill Interamericana Editores, S.A. de C.V.; 2000
- Lim JH. Effective prediction of preeclampsia by a combined ratio of angiogenesis-related factors. Obstet Gynecol 2008;111:1403–9
- Sharkey AM, Cooper JC, Balmforth JR, et al. Maternal plasma levels of vascular endothelial growth factor in normotensive pregnancies and in pregnancies complicated by pre-eclampsia. Eur J Clin Invest 1996;26:1182–5
- Lyall F, Simpson H, Bulmer JN, et al. Transforming growth factor-beta expression in human placenta and placental bed in third trimester normal pregnancy, preeclampsia, and fetal growth restriction. Am J Pathol 2001;159:1827–38
- Kim SY, Ryu HM, Yang JH, et al. Increased sFlt-1 to PlGF ratio in women who subsequently develop preeclampsia. J Korean Med Sci 2007;22:873–7
- Nakamura M, Sekizawa A, Purwosunu Y, et al. Cellular mRNA expressions of anti-oxidant factors in the blood of preeclamptic women. Prenat Diagn 2009;29:691–6
- Takacs P, Green KL, Nikaeo A, Kauma SW. Increased vascular endothelial cell production of interleukin-6 in severe preeclampsia. Am J Obstet Gynecol 2003;188:740–44
- Kauma S, Takacs P, Scordalakes C, et al. Increased endothelial monocyte chemoattractant protein-1 and interleukin-8 in preeclampsia. Obstet Gynecol 2002;100:706–14
- Briana DD. Adipocytokines in normal and complicated pregnancies. Reprod Sci 2009;16:921–37
- Purwosunu Y, Sekizawa A, Yoshimura S, et al. Expression of angiogenesis-related genes in the cellular component of the blood of preeclamptic women. Reprod Sci 2009;16:857–64
- Purwosunu Y. Evaluation of physiological alterations of the placenta through analysis of cell-free messenger ribonucleic acid concentrations of angiogenic factors. Am J Obstet Gynecol 2008;198:124.e121–7
- Brown MA, Lindheimer MD, de Swiet M, et al. The classification and diagnosis of the hypertensive disorders of pregnancy: statement from the International Society for the Study of Hypertension in Pregnancy (ISSHP). Hypertens Pregnancy 2001;20:IX–XIV
- von Dadelszen P, Magee LA, Roberts JM. Subclassification of preeclampsia. Hypertens Pregnancy 2003;22:143–8
- Fang R, Dawson A, Lohsoonthorn V, Williams MA. Risk factors of early and late onset preeclampsia among Thai women. Asian Biomed (Res Rev News) 2009;3:477–86
- Farina A, Sekizawa A, De Sanctis P, et al. Gene expression in chorionic villous samples at 11 weeks' gestation from women destined to develop preeclampsia. Prenat Diagn 2008;28:956–61
- Venkatesha S, Toporsian M, Lam C, et al. Soluble endoglin contributes to the pathogenesis of preeclampsia. Nat Med 2006;12:642–9
- Rajakumar A, Michael HM, Rajakumar PA, et al. Extra-placental expression of vascular endothelial growth factor receptor-1, (Flt-1) and soluble Flt-1 (sFlt-1), by peripheral blood mononuclear cells (PBMCs) in normotensive and preeclamptic pregnant women. Placenta 2005;26:563–73
- Rana S, Karumanchi SA, Levine RJ, et al. Sequential changes in antiangiogenic factors in early pregnancy and risk of developing preeclampsia. Hypertension 2007;50:137–42
- Livak KJ, Schmittgen TD. Analysis of relative gene expression data using real-time quantitative PCR and the 2(-Delta Delta C(T)) Method. Methods 2001;25:402–8
- Schmittgen TD, Livak KJ. Analyzing real-time PCR data by the comparative C(T) method. Nat Protoc 2008;3:1101–8
- Ades EW, Candal FJ, Swerlick RA, et al. HMEC-1: establishment of an immortalized human microvascular endothelial cell line. J Invest Dermatol 1992;99:683–90
- Coughlan MT, Vervaart PP, Permezel M, et al. Altered placental oxidative stress status in gestational diabetes mellitus. Placenta 2004;25:78–84
- Redman CW, Sargent IL. Placental stress and pre-eclampsia: a revised view. Placenta 2009;30:S38–42
- Baek D, Jin Y, Jeong JC, et al. Suppression of reactive oxygen species by glyceraldehyde-3-phosphate dehydrogenase. Phytochemistry 2008;69:333–8
- Dastoor Z, Dreyer JL. Potential role of nuclear translocation of glyceraldehyde-3-phosphate dehydrogenase in apoptosis and oxidative stress. J Cell Sci 2001;114:1643–53
- El-Baradie SM, Mahmoud M, Makhlouf HH. Elevated serum levels of interleukin-15, interleukin-16, and human chorionic gonadotropin in women with preeclampsia. J Obstet Gynaecol Can 2009;31:142–8
- Haugen F, Ranheim T, Harsem NK, et al. Increased plasma levels of adipokines in preeclampsia: relationship to placenta and adipose tissue gene expression. Am J Physiol Endocrinol Metab 2006;290:E326–33
- Schiessl B, Innes BA, Bulmer JN, et al. Localization of angiogenic growth factors and their receptors in the human placental bed throughout normal human pregnancy. Placenta 2009;30:79–87
- Powe CE, Levine RJ, Karumanchi SA. Preeclampsia, a disease of the maternal endothelium: the role of antiangiogenic factors and implications for later cardiovascular disease. Circulation 2011;123:2856–69