
Abstract
Vitamin E deficiency induces neuronal dysfunction and while oxidative stress is likely to be involved in mediating this process, the detailed mechanisms remain to be elucidated. Previously, we found axonal degeneration in the hippocampal CA1 region in vitamin E-deficient mice of 6 months of age (long-term). However, 3 month-old (short-term) vitamin E-deficient mice did not exhibit axonal degeneration in same region. In order to characterize the mechanisms involved in axonal degeneration in long-term vitamin E-deficient mice, we examined changes in microtubule-related proteins. Long-term vitamin E-deficiency led to significantly increased expression of the phosphorylated form of collapsin response mediator protein (CRMP)-2 compared to short-term deficiency. It is well known that CRMP-2 plays a crucial role in the maintenance of neurite function. Similarly, long-term vitamin E-deficiency significantly decreased the expression of silent mating type information regulation (SIRT)-2 mRNA compared to short-term deficiency. SIRT-2 belongs to a family of class III histone deacetylases (HDACs) and functions in the deacetylation of tubulins. Furthermore, the expression of microtubule-associated protein light chain (MAP-LC)3-2, which is a key autophagy protein was significantly higher in the short-term vitamin E-deficiency than the long-term deficiency. These results indicate that the mechanisms of axonal injury in long-term vitamin E-deficient mice are related to dysfunction in microtubules assembly via alterations in microtubule-related proteins and autophagy.
Introduction
It is well known that vitamin E is a common natural lipophilic vitamin [Citation1]. Vitamin E is present in cell membranes and its most important function is as an antioxidant [Citation2,Citation3]. To prevent lipid peroxidation, vitamin E scavenges free radicals and lipid peroxyl radicals that are generated from free radicals [Citation4]. A result of the antioxidant function of vitamin E is the attenuation of the possible development and progression of numerous serious free radical-related diseases, including Alzheimer's disease [Citation5] and atherosclerosis [Citation6]. Notably, administration of vitamin E has been recommended for the treatment of non-alcoholic steatohepatitis by the American Association for the Study of Liver Diseases [Citation7], American College of Gastroenterology [Citation8], and the American Gastroenterological Association [Citation9]. Recently, other beneficial functions of vitamin E have been reported, including the enhancement of immune responses [Citation10] and the induction of apoptosis in cancer cells [Citation11]. However, some of these effects cannot be explained by the antioxidant function of vitamin E. More than 90 years have passed since the discovery of vitamin E [Citation12] and the biological functions have not been completely elucidated.
Although experiments involving the treatment of cultured cells or animals with vitamin E are useful for discovering vitamin E functions, vitamin E deficiency and knockout models of α-tocopherol transfer protein (αTTP) have also been used to identify unknown functions of vitamin E. Previously, using vitamin E-deficient rats, we found enhanced lipid peroxidation [Citation13], appearance of apoptosis [Citation14], and induction of cognitive dysfunction [Citation15,Citation16]. Most studies, including our previous studies, utilize a 4–8-week period of feeding vitamin E-deficient diets to rats and mice. The reason for using a period of this length is to ensure the maximal elimination of vitamin E from living tissues. Compared with normal 3-month-old animals, the α-tocopherol content in the brain is significantly decreased in vitamin E-deficient rats of the same age. However, the time-course of the effects of vitamin E depletion in these studies is unclear. Previously, we examined axonal morphology in the hippocampal CA1 region of vitamin E-deficient mice [Citation17]. In vitamin E-deficient mice at 3 months of age, silver staining did not reveal morphological changes in axonal regions. However, axonal degeneration was induced in vitamin E-deficient mice at 6 months of age. In this model, the feeding of the vitamin E-deficient diet started at 4 weeks of age. Although long-term vitamin E-deficiency in mice induced axonal degeneration, the detailed degenerative mechanism remains to be elucidated.
Here, we focused on microtubule function in an effort to characterize the mechanism of axonal degeneration induction in long-term vitamin E-deficient mouse brain, because microtubules play a pivotal role in the maintenance of axonal structure [Citation18]. Previously, we found axonal degeneration in colchicine-treated neuro2a cells. It is well known that colchicine is an inhibitor of microtubule polymerization [Citation19]. Microtubules are cytoskeletal elements composed of tubulin heterodimers and act as a rail-like support structure in the axonal transport system [Citation20].
Autophagy is one of intracellular recycling systems similar to ubiquitin-proteasome system [Citation21]. More than 30 autophagy-related genes have been identified in yeast, many of which have orthologs in both animals and plants. Although, it is well known that autophagy activates in nutritional starvation state, recently, some reports have been shown that changes in autophagy function relates to cell death [Citation22] and neurodegenerative disorders [Citation23]. Previously, we have demonstrated that RNA interference of Atg7 or Beclin1 prevents neurite degeneration in nerve growth factor (NGF)-deprivation models of mice superior cervical ganglion (SCG) neurons [Citation24]. However, the relationship between the axonal degeneration and autophagy has not been elucidated.
The purpose of this study is to clarify the mechanism of axonal degeneration in long-term vitamin E-deficient mice. In the present study, we measured the expression of microtubule-related proteins and mRNA by western blotting and reverse transcription-polymerase chain reaction (RT-PCR), respectively. In addition, we measured the expression of microtubule-associated protein light chain (MAP LC)3 by western blotting.
Materials and methods
Animals, cell cultures and reagents
Three and six-month-old normal mice (wild-type C57BL/6) were obtained from Japan SLC, Inc. (Hamamatsu, Japan). Normal aged mice (24 months of age) were obtained from Tokyo Metropolitan Institute of Gerontology (Tokyo, Japan). Vitamin E deficiency model mice were achieved by feeding a vitamin E-deficient diet to normal 4-week-old mice until 3 (short-term) or 6 (long-term) months of age. The vitamin E-deficient diet (AIN-76A) was purchased from Funabashi Farm Co., Ltd. (Chiba, Japan).
Neuro2a cells, derived from a mouse neuroblastoma C1300 tumor, were originally obtained from the Human Science Research Resources Bank (HSRRB) (#IFO50081) (Osaka, Japan). The cells were grown in minimum essential medium (MEM) containing 5% heat-inactivated fetal calf serum (FCS) (Biological Industries, Beit Haemek, Israel), 50 U/ml of penicillin, and 50 μg/ml of streptomycin, and were plated in the wells of polyethyleneimine-coated plates. In order to elicit neurite extension, the FCS concentration was decreased from 5 to 1%. After 72 h, the cells were used for experiments.
All other chemical agents were obtained from either Wako Pure Chemical Industries, Ltd. (Osaka, Japan) or Sigma-Aldrich Corp. (St. Louis, MO, USA). All animal experiments were performed with the approval of the Animal Protection and Ethics Committee of the Shibaura Institute of Technology (Tokyo, Japan). All tissue culture plates and dishes were purchased from Becton Dickinson and Company (Franklin Lakes, NJ, USA).
Measurement of vitamin E contents
Alpha-tocopherol concentrations were measured using high performance liquid chromatography (HPLC) with an electrochemical detection as described previously with some modification [Citation13]. Each regional parts of brains was mixed with 1% NaCl solution (0.5 ml), 6% pyrogaroll solution (2 ml), 35% KOH solution (1 ml), and 2,2,5,7,8-pentamethyl-6-chromanol (PMC) as an internal standard. The mixture was saponified at 100°C for 45 min. After cooling, 1% NaCl solution and a mixture of hexane and ethyl acetate (9:1, by vol.) were added. After mixing, the extracts were evaporated under nitrogen gas, and methanol (0.2 ml) was added to the residue. The solutions were analyzed by HPLC (Nanospace SI-2, Shiseido Co., Ltd., Tokyo, Japan). Capsel pak C18 MGⅡ (4.6 × 150 mm; Shiseido Co., Ltd.) was used as the HPLC column. The HPLC grade methanol including 0.7% NaCO4·H2O was used as the mobile phase. The peaks of α-tocopherol were analyzed by S-MicroChrnom software (Shiseido Co., Ltd.).
Immunocytochemical analysis
After 24 h of treatment with 0.5 and 1 μM hydrogen peroxide, neuro2a cells were washed and fixed with 4% paraformaldehyde (PFA) in phosphate buffered saline (PBS) for 15 min at 4°C. The cells were then blocked with 10% goat serum in PBS for 1 h at room temperature (RT) and probed with anti-human CRMP-2 (C4G; mouse IgG monoclonal antibody; #11096, Immuno-Biological Laboratories Co., Ltd., Gunma, Japan) or rabbit polyclonal anti-phospho-CRMP-2 (T514 & S518; #OSC00046W, Osenses Pty Ltd., SA, Australia) diluted 1:400 in PBS containing 1% goat serum, 1% bovine serum albumin (BSA), and 0.05% Triton X-100 for 1 h at RT. The cells were then incubated with Alexa Fluor 488-conjugated anti-mouse or anti-rabbit IgG secondary antibodies (Life Technologies Japan Corp., Tokyo, Japan) diluted 1:500 in PBS for 1 h at RT.
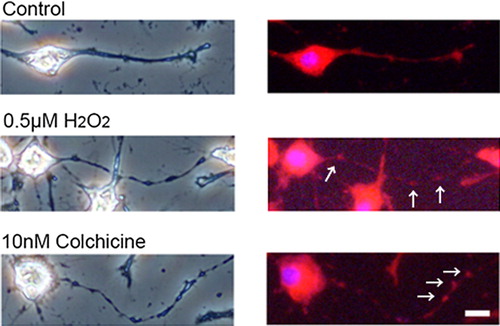
In order to clarify the relationship between neurite degeneration and mitochondria, we examined the localization of mitochondria. After 24 h of treatment with 0.5 μM hydrogen peroxide, neuro2a cells were incubated with 200 μM Mito Tracker (Life Technologies Japan Corp.) for 15 min in CO2 incubator. The cells were fixed with 4% PFA in PBS for 15 min in 4°C. In order to gain judgment of the status of nucleus, the cells were stained with 1 μM Hoechst 33258. For positive control sample, the cells were treated with 10 nM colchicine for 24 h.
Photomicrographs of neuro2a cells were taken on an IX81 phase-contrast microscope (Olympus Corp., Tokyo, Japan) equipped with a digital camera, stored, and then processed on a personal computer. The fluorescently labeled cells were observed and photographed with a fluorescence microscope (Olympus Corp.). Immunocytochemical experiments were performed at least three times.
RNA preparation and RT-PCR
Total RNA was purified from brain regions using the acid guanidinium thiocyanate-phenol-chloroform extraction (AGPC) method. ReverTra Ace®-α- and Blend Taq®-Plus- were employed for cDNA synthesis and RT-PCR, respectively. These methods were employed in accordance with the manufacturer's instructions (TOYOBO Co., Ltd, Tokyo, Japan). The CRMP-2 primers were designed according to a previous publication [Citation25] and ordered from Life Technologies Japan Ltd. The primers were designed to amplify a 314 base pair (bp) region of CRMP-2; the forward primer was 5′-CGGGGTAAACTCCTTCCTCGTGTACGGGGTAAACTCCTTCCTCGTG TA-3′ and the reverse primer was 5′-TGGTCT GGTTG GCAATAGTGATGGA-3′. The primers of silent mating type information regulation (SIRT)-2 (NM 022432.4) were designed using the Basic Local Alignment Search Tool of National Center for Biotechnology Information (http://blast.ncbi.nlm.nih.gov/Blast.cgi) and ordered from Life Technologies Japan. The primers were designed to amplify a 523 bp region of SIRT-2; the forward primer was 5′-GAGGCTCAGGATTCAGAC TCG-3′ and the reverse primer was 5′-ATGTGTAGA AGGTGCC GTGG-3′. Glyceraldehyde-3-phosphate dehydrogenase (G3PDH) was used as an internal standard for the RT-PCR experiments. The primer set for G3PDH (included in the RiverTra Ace-α-kit) was designed to amplify a 450 bp segment and as follows: forward, 5′-ACCACA GTCCAT GCCATCAC-3′; reverse, 5′-TCCA CCACCCTGTTGCT GTA-3′. PCR was carried out with the following protocols: CRMP-2: 40 s at 94°C, 40 s at 70°C and 70 s at 72°C; SIRT-2: 40 s at 94°C, 40 s at 63°C and 70 s at 72°C; G3PDH: 40 s at 94°C, 40 s at 55°C and 70 s at 72°C. All amplification protocols ended with a 2-min extension at 72°C. PCR cycle numbers for each gene were as follows: CRMP-2, 30 cycles; SIRT-2, 30 cycles; G3PDH, 33 cycles. After RT-PCR, all products were evaluated using 1% agarose gel electrophoresis.
Western blotting
All samples were homogenized in PBS and used in western blotting as described previously [Citation26], with some modifications. Sample lysates were centrifuged and protein contents were determined using a Bio-Rad protein assay (#500-0006JA, Bio-Rad Japan, Tokyo, Japan) according to the manufacturer's protocol. Protein extracts (15 μg) were separated on 10% sodium dodecyl sulfate (SDS)-polyacrylamide gels and transferred to PVDF transfer membranes (Immobilon; Merck KGaA, Darmstadt, Germany). The membranes were washed and incubated in blocking solution (Tris-HCl-buffered saline, pH 7.6 (TBS), containing 0.1% Tween 20 and 3% BSA) for 1 h at RT. The membranes were washed in TBS containing 0.1% Tween 20, and then treated with anti-human CRMP-2 or anti-phospho-CRMP-2 (pCRMP-2) at 1:1000 dilution overnight at 4°C. For the glycogen synthesis kinase (GSK)-3β assay, protein extracts (15 μg) were separated on 10% SDS-polyacrylamide gels and transferred to membranes treated with anti-GSK-3β mouse monoclonal antibody [3D10] (#ab93926, Abcam Plc., Cambridge, UK) or anti-GSK-3β (phospho S9) rabbit polyclonal antibody (#ab30619, Abcam Plc.) at 1:4000 dilution overnight at 4°C. In the microtubule-associated protein (MAP) light chain 3 (LC3) assay, the protein extracts (15 μg) were separated on 15% SDS-polyacrylamide gels. The transferred membranes were treated with anti-human LC3 (APG8B) (N-term) rabbit IgG polyclonal antibody (#AP1802a, Abgent, Inc., CA, USA) at 1:400 dilution overnight at 4°C. This antibody can detect MAP LC3-1 (18 kDa) and LC3-2 (16 kDa). Anti-mouse or anti-rabbit IgG HRP antibody (Promega Corp., Madison, WI, USA) was used as a secondary antibody at 1:4000 dilution for 1 h at RT. All western blotting experiments were performed at least three times. All chemiluminescent signals were generated by incubation with the detection reagents (ECL Prime Western Blotting Analysis Reagent; GE Healthcare UK Ltd., Buckinghamshire, UK) according to the manufacturer's protocol. For normalization of the bands for CRMP-2, GSK-3β, and MAP LC3, the membranes were reprobed with anti-β-actin antibody (#ab8226, Abcam Plc.). The relative intensities of CRMP-2, GSK-3β, and MAP LC3 were determined using LAS-3000 (FUJIFILM Corp., Tokyo, Japan). Expression ratios were calculated by dividing the phosphorylated CRMP-2 and GSK-3β value by those of the non-phosphorylated forms (pCRMP-2/CRMP-2, pGSK-3β/GSK-3β).
Statistical analysis
Data were plotted as the mean ± SE of the results of three independent experiments. Data were analyzed using the Student's t-test, with p < 0.05 considered significant.
Results
Changes in vitamin E contents in the brain of long-term vitamin E deficient mice
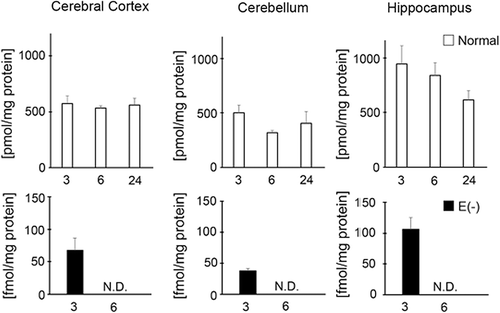
Before start of this study, we measured α-tocopherol contents in the brain of long-term vitamin E-deficient mice. Notably the level of α-tocopherol in wild type mice remained contrast during aging and in different tissues (). However, the α-tocopherol contents were significantly decreased in vitamin E-deficient mice of 3 months of age compared to age-matched controls. In long-term vitamin E-deficient mice, the α-tocopherol contents of brains were below the detection limit.
Figure 1. Measurement of vitamin E contents in cerebral cortex, cerebellum, and hippocampus. White column shows normal mice (3 month, n = 4; 6 month n = 4; 24 month n = 3) and black column shows vitamin E-deficient (E(‐), 3 month, n = 4; 6 month, n = 4). Details of sample preparation and experimental conditions are described in the Materials and methods.
Long-term vitamin E deficiency induces CRMP-2 phosphorylation in the mouse brain
Western blot analysis showed that the expression of total CRMP-2 did not differ among all samples. However, the expression of total CRMP-2 in the cerebellum and hippocampus of vitamin E-deficient mice tended to decrease in an age-dependent manner. pCRMP-2 expression in the cerebellum and hippocampus of mice was significantly increased in long-term vitamin E deficiency () compared to age-matched controls. In normal mice, pCRMP-2 expression did not change among all samples.
Figure 2. Changes in CRMP-2 and pCRMP-2 expression in long-term vitamin E-deficient mice. Black column shows vitamin E-deficient (E(‐), 3 month, n = 4; 6 month, n = 9) and white column shows normal mice (3 month, n = 7; 6 month, n = 9; 24 month, n = 8). Details of sample preparation and experimental conditions are described in the Materials and methods. The ratio of total CRMP-2 band intensity to β-actin band intensity and the ratio of pCRMP-2 band intensity to CRMP-2 band intensity in the cerebral cortex, cerebellum, and hippocampus (A). Western blot analysis of pCRMP-2 and CRMP-2 (B). RT-PCR analysis of CRMP-2 mRNA expression (C). The left image shows CRMP-2 mRNA and the right image shows G3PDH. The ratio of CRMP-2 mRNA band intensity to G3PDH band intensity (D). Immunocytochemical analysis of CRMP-2 and pCRMP-2 in the presence or absence of hydrogen peroxide in neuro2a cells (E). Images were obtained by fluorescence microscopy. Neuro2a cells were treated with 0.1 and 0.5 μM hydrogen peroxide. After 24 h, the cells were fixed with 4% PFA in PBS. Photomicrographs of the cells were taken and analyzed in axonal regions using a personal computer. The scale bar is 10 μm. Arrows indicate beading of the degeneration of neuro2a cells. A minimum of three wells were used per experiment. The ratio in normal mice of 3 months of age in each region was set to 1. Each column represents the mean of three independent experiments. Data were analyzed using Student's t-tests, *indicates p < 0.05 and **indicates p < 0.01.
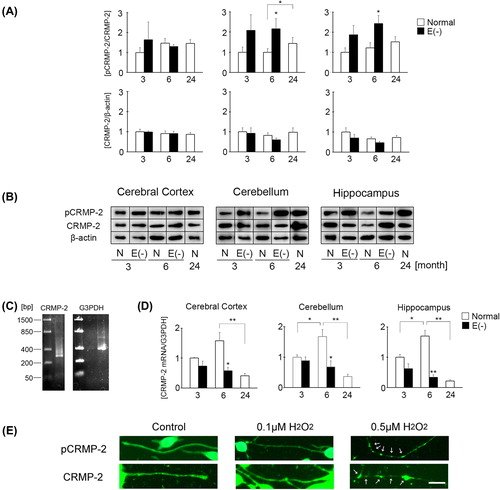
RT-PCR analysis indicated that CRMP-2 mRNA expression was significantly decreased in all brain regions of the long-term vitamin E-deficient mice compared to age-matched controls. In normal mice, CRMP-2 mRNA expression was the highest at 6 months of age. Furthermore, in the 24-month-old normal mice, CRMP-2 mRNA expression was significantly decreased compared to 6 months of age ().
In order to determine the relationship between CRMP-2 phosphorylation and oxidative damage in long-term vitamin E deficiency, we assessed the distribution of pCRMP-2 using a mouse neural crest-derived cell line. Treatment with 0.5 μM of hydrogen peroxide, which is used to induce oxidative stress, was employed to stimulate neurite degeneration in neuro2a cells. pCRMP-2 accumulated in the region of neurite beading in neuro2a cells (). This result indicates the possibility that CRMP-2 phosphorylation in long-term vitamin E deficiency is related to oxidative stress.
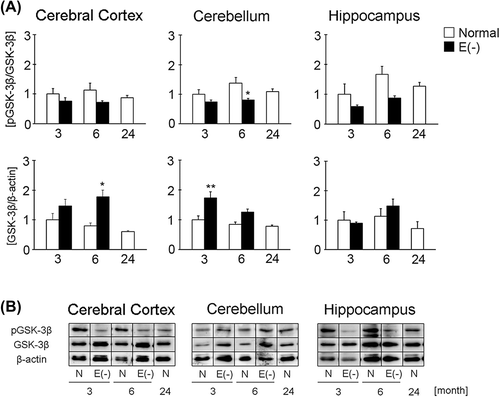
Long-term vitamin E deficiency attenuates GSK-3β phosphorylation in the mouse brain
CRMP-2 has a number of phosphorylation sites and GSK-3β phosphorylates T514 and S518. The expression of GSK-3ββ increased remarkably in vitamin E-deficient mice at 6 months of age compared to age-matched controls (). However the expression levels of pGSK-3ββ were unchanged or rather decreased, in a tissue specific manner, in vitamin E-deficiency versus normal mice. Finally in normal mice, GSK-3ββ expression tended to decrease in an age-dependent fashion, although differences are not significant. These data indicate that total amount of GSK-3ββ phosphorylation is reduced more relatively in vitamin E-deficient mice compared to age-matched controls.
Figure 3. Changes in GSK-3β and pGSK-3β expression in long-term vitamin E-deficient mice. Black column shows vitamin E-deficient (E(‐), 3 month, n = 7; 6 month, n = 8) and white column shows normal mice (3 month, n = 9; 6 month, n = 9; 24 month, n = 8). Details of sample preparation and experimental conditions are described in the Materials and methods. The graph shows the ratio of total GSK-3β band intensity to β-actin band intensity and the ratio of pGSK-3β band intensity to GSK-3β band intensity in the cerebral cortex, cerebellum, and hippocampus (A). Western blot analysis of pGSK-3β and GSK-3β (B). The ratio in normal mice of 3 months of age in each region was set to 1. Each column represents the mean of three independent experiments. Data were analyzed using Student's t-tests, *indicates p < 0.05 and **indicates p < 0.01.
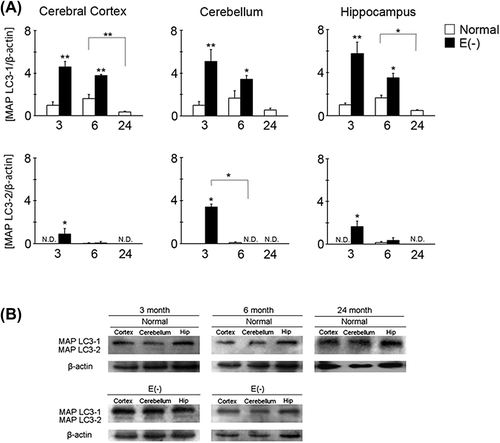
Long-term vitamin E deficiency attenuates MAP LC3-2 in the mouse brain
MAP LC3 is a major hallmark of autophagy. In particular, the induction of MAP LC3-2 is essential for the formation of autophagosomes. Compared with age-matched controls, MAP LC3-1 expression significantly increased in all brain regions of the vitamin E-deficient mice (). However, MAP LC3-1 expression gradually decreased in all brain regions of the vitamin E-deficient mice. In normal mice, the expression of MAP LC3-1 was the highest at 6 months of age in all brain regions. In the MAP LC3-2 assay, the highest levels were found in vitamin E-deficient mice at 3 months of age. The expression of MAP LC3-2 was decreased remarkably in long-term vitamin E-deficient mice. In most of the normal mouse samples, MAP LC3-2 expression was below the detection threshold.
Figure 4. Changes in MAP LC3-1 and LC3-2 expression in long-term vitamin E-deficient mice. Black column shows vitamin E-deficient (E(‐), 3 month, n = 4; 6 month, n = 5) and white column shows normal mice (3 month, n = 7; 6 month, n = 4; 24 month, n = 4). Details of sample preparation and experimental conditions are described in the Materials and methods. The graph shows the ratio of total MAP LC3-1 band intensity to β-actin band intensity and the ratio of LC3-2 band intensity to β-actin band intensity in the cerebral cortex, cerebellum, and hippocampus (A). Western blot analysis of MAP LC3-1 (16 kDa) and LC3-2 (14 kDa) (B). The ratio in normal mice of 3 months of age in each region was set to 1. Each column represents the mean of three independent experiments. Data were analyzed using Student's t-tests, *indicates p < 0.05 and **indicates p < 0.01.
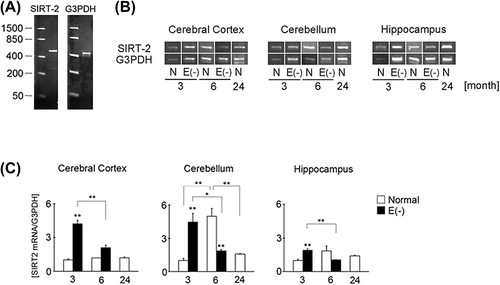
Expression of SIRT-2 in vitamin E-deficient mice was higher at 3 months than at 6 months of age
RT-PCR analysis of SIRT-2 expression indicated that 3-month-old vitamin E-deficient mice showed higher levels in all brain regions compared to 6-month-old vitamin E-deficient mice (). Moreover, compared to normal 3-month-old mice, SIRT-2 mRNA expression in vitamin E-deficient mice at 3 months of age significantly increased in all brain regions. In control mice, however, SIRT-2 mRNA expression tended to increase at 6 months of age compared to the other time points.
Figure 5. Changes in SIRT-2 mRNA expression in long-term vitamin E-deficient mice. Black column shows vitamin E-deficient (E(‐), 3 month, n = 4; 6 month, n = 4) and white column shows normal mice (3 month, n = 4; 6 month, n = 4; 24 month, n = 4). Details of sample preparation and experimental conditions are described in the Materials and methods. Panel (A) shows RT-PCR analysis of SIRT-2 mRNA expression. The results of agarose gel electrophoresis of SIRT-2(B). The left image shows SIRT-2 mRNA and the right image shows G3PDH. Panel (C) shows the ratio of SIRT-2 mRNA band intensity to G3PDH band intensity. The ratio in normal mice of 3 months of age in each region was set to 1. Each column represents the mean of three independent experiments. Data were analyzed using Student's t-tests, *indicates p < 0.05 and **indicates p < 0.01.
Mitochondria were localized in the regions of neurite beading in hydrogen peroxide-treated neuro2a cells
Mitochondria are known as the source of superoxide, which are one of free radicals. In order to clarify the relationship between oxidative damaged and neurite degeneration, we examined the localization of mitochondria in the presence or absence of low concentration of hydrogen peroxide. shows that the localization of mitochondria was matched with the regions of neurite beadings in hydrogen peroxide-treated neuro2a cells.
Figure 6. Localization of mitochondria in hydrogen peroxide-treated neuro2a cells. Neuro2a cells were treated with 0.5 μM of hydrogen peroxide. After 24 h, the cells were incubated with 200 μM Mito Tracker® for 15 min in CO2 incubator and were fixed with 4% PFA in PBS for 15 min in 4°C. In order to check the status of nucleus, 1 μM Hoechst 33258 was used as nucleus stain. For positive control sample, the cells were treated with 10 nM colchicine for 24 h. Phase-contrast (left) or fluorescence photomicrographs (right) were taken. Scale bar is 10 μm. The arrows show neurite beadings. The detailed method is described in Materials and methods.
Discussion
Long-term vitamin E deficiency in mice induces CRMP-2 phosphorylation, but not total CRMP-2 expression
The cytosolic protein CRMP-2 plays a crucial role in axonal and dendrite stabilization [Citation27]. Overexpression of CRMP-2 induces multiple axons in primary cultures of mouse hippocampal neurons [Citation28]. The non-phosphorylated form of CRMP-2 contributes to microtubule assembly by binding to tubulin, whereas the phosphorylated form of CRMP-2 cannot bind tubulin [Citation29]. The balance between CRMP-2 and pCRMP-2 may regulate microtubule assembly and dissociation. Furthermore, Cole et al. reported the hyperphosphorylation of CRMP-2 in Alzheimer's disease patients [Citation30], with the function of CRMP-2 with respect to microtubules being very similar to that of tau proteins. In the present study, compared to normal mice, pCRMP-2 expression tended to increase with vitamin E deficiency (). In particular, the expression of pCRMP-2 was significantly induced in the cerebellum and hippocampus of long-term vitamin E-deficient mice. On the other hands, in normal mice, pCRMP-2 expression did not change among all samples. These results indicate that vitamin E deficiency decreases the CRMP-2/pCRMP-2 ratio. A reduction in CRMP-2 attenuates the number of tubulin complexes and may induce microtubule instability. Previously, we found morphological changes in the axonal zone of CA1 region of the hippocampus in 6-month-old vitamin E-deficient mice using silver staining [Citation17]. A possible reason for this phenomenon is the destabilization of microtubules. However, further investigation is needed to clarify the relationship between CRMP-2 phosphorylation and chronic vitamin E deficiency.
Long-term vitamin E deficiency in mice induces GSK-3β expression and attenuates phosphorylation
CRMP-2 has several phosphorylation sites. Cyclin- dependent kinase (CDK) 5 phosphorylates Ser522, and GSK-3β phosphorylates Thr514 and Ser518 [Citation31–33]. In the present study, we measured the phosphorylation of Thr514 and Ser518 (). CRMP-2 is phosphorylated by the non-phosphorylated form of GSK-3β. To clarify the relationship between long-term vitamin E deficiency and pCRMP-2, we measured the expression of GSK-3β and pGSK-3β using western blotting. Compared to age-matched normal mice, GSK-3β expression tended to increase in vitamin E-deficient mice (). On the other hand, the expression of pGSK-3β tended to decrease in all brain regions of the vitamin E-deficient mice. Concurrently, we measured phosphorylation of Ser522 in CRMP-2. However, significant differences were not observed between the vitamin E-deficient mice and controls (data not shown). These results indicate that the CDK5 pathway was not related to axonal degeneration in our model of long-term vitamin E deficiency. A reduction of pGSK-3β increases the proportion of non-phosphorylated GSK-3β, resulting in the induction of CRMP-2 phosphorylation in long-term vitamin E-deficient mice. Axonal degeneration in long-term vitamin E deficiency mice may be connected with GSK-3β-induced CRMP-2 phosphorylation.
The relationship between vitamin E-deficiency-derived oxidative injury and pCRMP-2 expression
It is well known that vitamin E-deficiency induces oxidative injury [Citation14,Citation15,Citation34]. Furthermore, reactive oxygen species (ROS) induce axonal degeneration [Citation26]. Treatment with low concentrations of hydrogen peroxide, which is a ROS, induces axonal and dendrite degeneration in culture models [Citation26,Citation35]. Large numbers of neurite beads, which are a major hallmark of neurite degeneration, appeared in the hydrogen peroxide-treated cultured cells. Furthermore, lipid peroxidations (LOOH) were significantly increased in hydrogen peroxide-treated granule cells [Citation35]. In the present study, immunocytochemical analysis revealed the accumulation of pCRMP-2 in the regions of neurite beading (). Notably, mitochondria were localized with the regions of neurite beads in colchicine or hydrogen peroxide-treated neuro2a cells (). Mitochondria are known as the source of superoxide, which is one of free radicals. This result indicates that one of the reasons for the induction of axonal degeneration in long-term vitamin E deficiency may be associated with ROS-derived pCRMP-2 expression. In fact, lipid peroxidative product of brain increased remarkably in long-term vitamin E-deficient mice compared with the short-term ones (data not shown). There is not doubtful that the long-term vitamin E deficiency accelerates oxidation. In short-term vitamin E deficient mice may be able to make CRMP-2 protein. In this point, intracellular recovery system against vitamin E-deficient-derived oxidative stress may act normally. The long-term vitamin E-deficient mice disrupted improvement system. The small amount of CRMP-2 which are remaining in the axon is phosphorylated. However, we do not have direct evidence for the relationship between vitamin E deficiency-derived ROS production and CRMP-2 phosphorylation. Further investigation is needed to clarify the mechanisms of ROS-derived axonal degeneration in long-term vitamin E deficiency.
MAP LC3-2 expression is lower in mice subjected to long-term vitamin E deficiency compared to short-term deficiency
Previously, we did not find axonal degeneration in the hippocampal CA1 region of 3-month-old vitamin E-deficient mice [Citation17]. We hypothesize that one of the reasons for the maintenance of axonal stability was an intracellular recycling mechanism. In the axonal region, many substances are carried via the axonal transport system. If microtubule assembly is disrupted by vitamin E deficiency-derived CRMP2 phosphorylation, the transport system from the cell body to axonal regions is disrupted. MAP LC-3 is known as an Atg8. We have already studied about Atg6 (Beclin1) and Atg7. RNA interference of Beclin1 or Atg7 suppressed neurite degeneration in NGF-deprivation model of mice cervical ganglion neurons [Citation36]. Furthermore, we studied immunofluorescence of autophagy marker in granule cells in the presence or absence of hydrogen peroxide. Treatment with low concentration of hydrogen peroxide induced neurite degeneration including beads formation. The bead formations were matched with localization of monodansylcadaverine (MDC) [Citation35]. MDC is known as a marker of autophagy vacuoles. Additionally, we measured the expression of total MAP-LC3 without considering separating the expression of MAP LC3-1 and -2. However, these results were studied using cell line and primary cultured models. In the present study we used animal models. The expression of MAP LC3-1 was significantly increased in vitamin E-deficient mice compared to age-matched controls (). MAP LC3-1 expression was higher in vitamin E-deficient mice at 3 months of age than at 6 months of age. In controls, MAP LC3-1 expression did not significantly differ according to mouse age or brain region. It is well known that MAP LC3-2 induction is essential for autophagosome formation. In this study, MAP LC3-2 expression was the highest in the short-term vitamin E-deficient mice. Karim et al. reported that vitamin E plays a role in enhancing autophagy in rat hepatocyte cell [Citation37]. Gamma-tocotrienol, an isoform of vitamin E, induces autophagy in cancer cells through enhanced sphingolipid synthesis [Citation38]. These results indicate that short-term vitamin E-deficiency activates the intracellular recovery system in mice. To maintain microtubule function, damaged proteins or waste substances must be eliminated from axonal regions. Long-term vitamin E deficiency might induce dysfunction of the intracellular recovery system, including autophagy. Upon induction of axonal transport system dysfunction, accumulation of substances may be accelerated in the axonal region, resulting in axon abnormalities such as bead formation. However, the efficacy of autophagy, including acceleration or suppression has not yet elucidated completely in many types of cells. Further investigation is needed to identify the relationship between changes in autophagy and neurite degeneration.
SIRT-2 expression in mice is lower with long-term vitamin E deficiency than short-term deficiency
The activation of sirtuins, which belongs to a family of class III histone deacetylases (HDACs), is dependent on nicotinamide adenine dinucleotide levels. SIRT-2 exists in cytosolic and nuclear regions and plays pivotal roles in the cell cycle [Citation39]. Recently, other beneficial functions of SITR-2 have been reported, such as the deacetylation of microtubules [Citation40,Citation41]. During cell division, SIRT-2 plays an important role in the maintenance of microtubule depolymerization by deacetylation of tubulins [Citation42]. The balance between polymerization and depolymerization may play an important role in neurite morphology. In our study, the expression of SIRT-2 mRNA was higher in the vitamin E-deficient mice at 3 months of age than in normal mice (). Because vitamin E-deficient mice at 3 months of age can be classified as a short-term vitamin E deficiency, the neurons may normally exhibit enhanced microtubule metabolism. This hypothesis is similar to the induction of MAP LC3-2 in the vitamin E-deficient mice at 3 months of age (). On the other hand, SIRT-2 mRNA expression was significantly decreased in all brain regions of vitamin E-deficient mice at 6 months of age. It is possible that microtubule metabolism, composed of polymerization and depolymerization, is attenuated during long-term vitamin E deficiency. In controls, SIRT-2 mRNA expression tended to be elevated at 6 months of age. This result was similar to CRMP-2 mRNA expression (). Additionally, the expression of MAP-LC3 also tended to increase in 6 month of age (). An explanation for these results may be that 6 months of age could correspond to maturity in rodents. Although, the difference of neurons among brain tissues may be related, we could not clarify the reason of this phenomenon in this study.
Conclusions
In the present study, we found that long-term vitamin E deficiency induced axonal degeneration in mice via changes in the expression or phosphorylation of microtubule-related proteins. However, many of the details regarding the relationship between long-term vitamin E deficiency and biological functions of microtubule-related proteins remain to be elucidated. We anticipate that our continued investigation into the mechanisms of axonal degeneration via microtubule dysfunction will provide answers to some of these questions in the near future.
Acknowledgement
The authors would like to thank Mr. Keisuke Ushiki and Mr. Satoshi Terashima for the technical assistance in this research.
Declaration of interest
The authors report no declarations of interest. The authors alone are responsible for the content and writing of the paper.
This work was supported by the Ministry of Education, Culture, Sports, Science, and Technology (MEXT)- Supported Program for the Strategic Research Foundation at Private Universities. This study was also supported by a grant-in-aid for Project Research from the Shibaura Institute of Technology (Tokyo, Japan).
References
- Sies H , Stahl W , Sundquist AR . Antioxidant functions of vitamins. Vitamins E and C, beta-carotene, and other carotenoids. Ann NY Acad Sci 1992;669:7–20.
- Sies H . Oxidative stress: oxidants and antioxidants. Exp Physiol 1997;82:291–295.
- Niki E , Noguchi N . Dynamics of antioxidant action of vitamin E. Acc Chem Res 2004;37:45–51.
- Samhan-Arias AK , Tyurina YY , Kagan VE . Lipid antioxidants: free radical scavenging versus regulation of enzymatic lipid peroxidation. J Clin Biochem Nutr 2011;48:91–95.
- Sano M , Ernesto C , Thomas RG , Klauber MR , Schafer K , Grundman M , et al. A controlled trial of selegiline, alpha- tocopherol, or both as treatment for Alzheimer's disease. The Alzheimer's disease cooperative study. N Engl J Med 1997; 336:1216–1222.
- Kaga E , Karademir B , Baykal AT , Ozer NK . Identification of differentially expressed proteins in atherosclerotic aorta and effect of vitamin E. J Proteomics 2013;92:260–273.
- Chalasani N , Younossi Z , Lavine JE , Diehi AM , Brunt EM , Cusi K , et al. The diagnosis and management of non-alcoholic fatty liver disease: practice Guideline by the American Association for the Study of Liver Diseases, American College of Gastroenterology, and the American Gastroenterological Association. Hepatology 2012;55:2005–2023.
- Chalasani N , Younossi Z , Lavine JE , Diehi AM , Brunt EM , Cusi K , et al. The diagnosis and management of non-alcoholic fatty liver disease: practice Guideline by the American Association for the Study of Liver Diseases, American College of Gastroenterology, and the American Gastroenterological Association. Am J Gastroenterol 2012;107:811–826.
- Chalasani N , Younossi Z , Lavine JE , Diehi AM , Brunt EM , Cusi K , et al. The diagnosis and management of non-alcoholic fatty liver disease: practice Guideline by the American Association for the Study of Liver Diseases, American College of Gastroenterology, and the American Gastroenterological Association. Gastroenterology 2012;142:1592–1609.
- Adolfsson O , Huber BT , Meydani SN . Vitamin Eenhanced IL-2 production in old mice: naive but not memory T cells show increased cell division cycling and IL-2-producing Capacity. J Immunol 2001;167:3809–3817.
- Miyazawa T , Shibata A , Sookwong P , Kawakami Y , Eitsuka T , Asai A , et al. Antiangiogenic and anticancer potential of unsaturated vitamin E (tocotrienol). J Nutri Biochem 2009; 20:79–86.
- Evans HM , Bishop KS . On the existence of a hitherto unrecognized dietary factor essential for reproduction. Science 1922;56:650–651.
- Onodera K , Omoi N , Fukui K , Hayasaka T , Shinkai T , Suzuki S , et al. Oxidative damage of rat cerebral cortex and hippocampus, and changes in antioxidative defense systems caused by hyperoxia. Free Radic Res 2003;37: 367–372.
- Fukui K , Omoi N , Hayasaka T , Shinkai S , Suzuki S , Abe K , Urano S . Cognitive impairment of rats caused by oxidative stress and aging, and its prevention by vitamin E. Ann NY Acad Sci 2002;959:275–284.
- Fukui K , Onodera K , Shinkai T , Suzuki S , Urano S . Impairment of learning and memory in rat caused by oxidative stress and aging, and changes in antioxidative defense systems. Ann NY Acad Sci 2001;928:169–176.
- Ohkawa K , Takeda H , Yamazaki M , Isogai H , Nakano M , Shimomura M , et al. Pyrroloquinoline quinone (PQQ) prevents cognitive deficit caused by oxidative stress in rats. J Clin Biochem Nutr 2008;42:29–34.
- Fukui K , Kawakami H , Honjo T , Ogasawara R , Takatsu H , Shinkai T , et al. Vitamin E deficiency induces axonal degeneration in mouse hippocampal neurons. J Nutr Sci Vitaminol (Tokyo) 2012;58:377–383.
- Poulain FE , Sobel A . The microtubule network and neuronal morphogenesis: Dynamic and coordinated orchestration through multiple players. Mol Cell Neurosci 2010;43:15–32.
- Fukui K , Sekiguchi H , Takatsu H , Koike T , Koike T , Urano S . Tocotrienol prevents AAPH-induced neurite degeneration in neuro2a cells. Redox Rep 2013;18: 238–244.
- Fukushima N , Furuta D , Hidaka Y , Moriyama R , Tsujiuchi T . Post-translational modifications of tubulin in the nervous system. J Neurochem 2009;109:683–693.
- Ohsumi Y . Molecular dissection of autophagy: two ubiquitin-like systems. Nat Rev Mol Cell Biol 2001;2:211–216.
- Yu L , Alva A , Su H , Dutt P , Freundt E , Welsh S , et al. Regulation of an ATG7-beclin 1 program of autophagic cell death by caspase-8. Science 2004;304:1500–1502.
- Nixon RA . Autophagy in neurodegenerative disease: friend, foe or turncoat? Trends Neurosci 2006;29:528–535.
- Yang Y , Fukui K , Koike T , Zheng X . Induction of autophagy in neurite degeneration of mouse superior cervical ganglion neurons. Eur J Neurosci 2007;26:2979–2988.
- Shinkai-Ofuchi F , Yamakawa Y , Hara H , Tobiume M , Nishijima M , Hanada K , Hagiwara K . Identification and structural analysis of C-terminally truncated collapsing response mediator protein-2 in a murine model of prion disease. Proteome Sci 2010;8:53. doi:10.1186/1477-5956-8-53.
- Fukui K , Takatsu H , Koike T , Urano S . Hydrogen peroxide induces neurite degeneration: Prevention by tocotrienols. Free Radic Res 2011;45:681–691.
- Chae YC , Lee S , Heo K , Ha SH , Jung Y , Kim JH , et al. Collapsin response mediator protein-2 regulates neurite formation by modulation tubulin GTPase activity. Cell Signal 2009;21:1818–1826.
- Inagaki N , Chihara K , Arimura N , Menager C , Kawano Y , Matsuo N , et al. CRMP-2 induces axons in cultured hippocampal neurons. Nat Neurosci 2001;4:781–782.
- Fukata Y , Itoh TJ , Kimura T , Menager C , Nishimura T , Shiromizu T , et al. CRMP-2 binds to tubulin heterodimers to promote microtubule assembly. Nat Cell Biol 2002;4: 583–591.
- Cole AR , Noble W , van Aalten L , Plattner F , Meimaridou R , Hogan D , et al. Collapsin response mediator protein-2 hyperphosphorylation is an early event in Alzheimer's disease progression. J Neurochem 2007;103:1132–1144.
- Uchida Y , Oshima T , Sasaki Y , Suzuki H , Yanai S , Yamashita N , et al. Semaphorin3A signaling is mediated via sequential Cdk5 and GSK3beta phosphorylation of CRMP-2: implication of common phosphorylating mechanism underlying axon guidance and Alzheimer's disease. Genes Cells 2005; 10:165–179.
- Xlong T , Tang J , Zhao J , Chen H , Zhao F , Li J , et al. Imvolvement of the Akt/GSK-3beta/CRMP-2 pathway in axonal injury after hypoxic-ischemic brain damage in neonatal rat. Neuroscience 2012;216:123–132.
- Yoshimura T , Kawano Y , Arimura N , Kawabata S , Kikuchi A , Kaibuchi K . GSK-3beta regulates phosphorylation of CRMP-2 and neuronal polarity. Cell 2005;120:137–149.
- Fukui K , Takatsu H , Shinkai T , Suzuki S , Abe K , Urano S . Appearance of amyloid beta-like substances and delayed-type apoptosis in rat hippocampus CA1 region through aging and oxidative stress. J Alzheimer's Dis 2005;8:299–309.
- Fukui K , Ushiki K , Takatsu H , Koike T , Urano S . Tocotrienols prevent hydrogen peroxide-induced axon and dendrite degeneration in cerebellar granule cells. Free Radic Res 2012; 46:184–193.
- Touma E , Kato S , Fukui K , Koike T . Calpain-mediated cleavage of collapsing response mediator protein (CRMP)-2 during neurite degeneration in mice. Eur J Neurosci 2007; 26:3368–3381.
- Karim MR , Fujimura S , Kadowaki M . Vitamin E as a novel enhancer of macroautophagy in rat hepatocyte and H4-II-E cells. Biochem Biophys Res Commun 2010;394:981–987.
- Jiang Q , Rao X , Kim CY , Freiser H , Zhang Q , Jiang Z , Li G . Gamma-tocotrienol induces apoptosis and autophagy in prostate cancer cells by increasing intracellular dihydrosphingosine and dihydroceramide. Int J Cancer 2012;130:685–693.
- Michan S , Sinclair D . Sirtuins in mammals: insight into their biological function. Biochem J 2007;404:1–13.
- North BJ , Marshall BL , Borra MT , Denu JM , Verdin E . The human Sir2 ortholog, SIRT2, is an NAD+-dependent tubulin deacetylase. Mol Cell 2003;11:437–444.
- Suzuki K , Koike T . Mammalian Sir2-related protein (SIRT)2-mediated modulation of resistance to axonal degeneration in slow Wallerian degeneration mice: a crucial role of tubulin deacetylation. Neuroscience 2007;147:599–612.
- Zhang H , Park SH , Pantazides BG , Karpiuk O , Warren MD , Hardy CW , et al. SIRT2 directs the replication stress response through CDK9 deacetylation. Proc Natl Acad Sci USA 2013;110:13546–13551.