Abstract
Sustained release nanoformulations of second line anti-tubercular drugs can help in reducing their dosing frequency and improve patient’s compliance in multi-drug resistant tuberculosis (MDR TB). The objective of the current study was to investigate the pharmacokinetics and tissues distribution of ethionamide encapsulated in poly (DL-lactide-co-glycolide) (PLGA) nanoparticles. The drug loaded nanoparticles were 286 ± 26 nm in size with narrow size distribution, and zeta-potential was −13 ± 2.5 mV. The drug encapsulation efficiency and loading capacity were 35.2 ± 3.1%w/w and 38.6 ± 2.3%w/w, respectively. Ethionamide-loaded nanoparticles were administered orally to mice at two different doses and the control group received free (unencapsulated) ethionamide. Ethionamide-loaded PLGA nanoparticles produced sustained release of ethionamide for 6 days in plasma against 6 h for free ethionamide. The Ethionamide was detected in organs (lung, liver, and spleen) for up to 5–7 days in the case of encapsulated ethionamide, whereas free ethionamide was cleared within 12 h. Ethionamide-loaded PLGA nanoparticles exhibited significant improvement in pharmacokinetic parameters, i.e. Cmax, tmax, AUC0–∞, AUMC0–∞, and MRT of encapsulated ethionamide as compared with free ethionamide. Drug in nanoparticles also exhibited a dose proportional increase in the AUC0–∞ values. The pharmacodynamic parameters such as AUC0–24/MIC, Cmax/MIC, and Time > MIC were also improved. PLGA nanoparticles of ethionamide have great potential in reducing dosing frequency of ethionamide in treatment of MDR TB.
Introduction
Ethionamide is one of the most efficacious and widely used second line drugs in treatment of multi-drug resistant tuberculosis (MDR TB). It is available only as conventional release tablets given daily at doses of 0.5–1 g (CitationZhu et al., 2002). Daily dosing of anti-tubercular drug for prolonged periods is known to cause non-compliance and treatment failure which in turn leads to MDR TB and XDR TB (extensively drug resistant tuberculosis). Therefore, there is a need to develop a sustained release formulation of ethionamide to improve compliance by reducing the dosing frequency and to improve therapeutic effectiveness. Furthermore, ethionamide is a poorly tolerated drug and often administered with meals to reduce gastrointestinal intolerance (CitationBass et al., 1994). Ethionamide also undergoes first pass metabolism which reduces its oral bioavailability (CitationAuclair et al., 2001). Enteric-coated ethionamide tablets were developed in an attempt to improve tolerability; however, no significant reduction in gastrointestinal intolerance was found (CitationWeinstein et al., 1962; CitationGronroos & Toivanen, 1964).
Ethionamide encapsulation in nanoparticles can produce sustained release of ethionamide in blood for a longer time period. Ethionamide-loaded nanoparticles may improve gastrointestinal (GI) intolerance due to its release from nanoparticles in blood and reticulo-endothelial system (RES), and very less release in intestine. The nanoparticulate formulations have been known to increase the oral bioavailability of drugs due to their specialized uptake mechanisms and because they bypass hepatic first-pass metabolism (CitationDesai et al., 1996; CitationFlorence, 1997; Citation2005; CitationNorris et al., 1998). Furthermore, ethionamide-loaded nanoparticles may improve the drug efficacy by keeping the drug concentration above minimum inhibitory concentration (MIC) for a longer period of time and enhance the bactericidal effect of drug.
We have previously shown that the encapsulation of anti-tubercular drugs like isoniazid, rifampin, and pyrazinamide in nanoparticles provides sustained release over a period of 6–9 days while maintaining chemotherapeutic efficacy against M. tuberculosis in mice (CitationPandey et al., 2003b). This can lead to simplification of the dosing regimen, thereby improving compliance.
In the present work, we have ascertained the pharmacokinetic benefits of encapsulation of ethionamide in PLGA nanoparticles.
Materials and methods
Materials
Poly (DL-lactide-co-glycolide) (PLGA) (50:50 resomer) was purchased from Birmingham Polymers, Inc (Birmingham, AL). Ethionamide was a gift obtained from Macleods Pharmaceuticals (Mumbai, India). Poly-vinyl alcohol (PVA; Mw 30,000–70,000 Da, 87–89% hydrolyzed) was purchased from Sigma chemicals (St Louis, MO). Acetonitrile (ACN; HPLC grade) and Dichloromethane (DCM) were purchased from Rankem Fine Chemicals (New Delhi, India) and Merck Ltd. (Mumbai, India), respectively.
Animals
Swiss albino mice of either sex weighing 18–22 g were obtained from Central Animal House of our institute. They were provided a pellet diet and water ad libitum. They were kept at 12/12 h light/dark cycle under controlled temperature (20–22°C). The study was approved by the Institutional Animal Ethics Committee.
Preparation of drug-loaded PLGA nanoparticles
Ethionamide-loaded PLGA nanoparticles were prepared by modified emulsion-diffusion-evaporation method (CitationLamprecht et al., 2001). In brief, ethionamide (20 mg) and PLGA (20 mg) were dissolved in methanol (800 µl) and DCM (7 ml), respectively. Subsequently, two solutions were mixed to make a single organic phase. This organic phase was added to 14 ml of 0.5%w/v PVA solution and sonicated for 3 min at 20 kHz (20% amplitude) with the help of a probe sonicator (Misonix, Farmingdale, NY; Model XL 2020). The resulting emulsion was moderately stirred to evaporate the organic solvent. The nanoparticles were then isolated by centrifugation (Sigma 3K30, Germany) at 15,000 rpm for 20 min and washed once with 5% w/v methanol and twice with double-distilled water (DDW). Ethionamide could not be washed off the nanoparticles during the regular DDW washing steps. However, an additional wash with 5% w/v methanol solution rapidly removed the unencapsulated ethionamide without extracting ethionamide from nanoparticles. The suspensions of nanoparticles in DDW were frozen at −20°C and freeze-dried for 48 h under 0.070 mbar vacuum (condenser temperature of −55°C) in a lyophilizer (Christ, Alpha 1-2 LD, Germany) to obtain a fine preparation of nanoparticles.
Characterization of drug-loaded PLGA nanoparticles
The size of drug-loaded nanoparticles was estimated on a Zetasizer Nano ZS (Malvern Instruments, Malvern, UK) after dilution with DDW to a concentration of 0.5 mg/ml. The mean diameter of nanoparticles is based on intensity as given by a dynamic light scattering (DLS) technique. DLS technique is based on the measurement of the Brownian motion of particles. The smaller the particle, the faster will be the Brownian motion. When the incident laser beam reaches the sample, light is scattered, depending on the Brownian motion, and then detected by a photomultiplier positioned at a determined angle (here at 90°). Fluctuations in the intensity of scattered light are converted into output current, which is passed to an auto-correlator. In this way, a correlation function is generated and analyzed by software. The computer then provides the mean size and the distribution width of the nanoparticles in the batch. The instrument performance was routinely checked against 60 nm standard latex particles. The poly-dispersity index (PI), which is a dimensionless number indicating the width of the size distribution, having a value between 0–1 (0 being for monodispersed particles) was also obtained using a Zetasizer. Surface charge of freeze-dried nanoparticles (0.5 mg/ml nanoparticles in DDW) was determined by zeta potential measurement on a Zetasizer Nano ZS (Malvern Instruments, Malvern, UK). Zeta potential was estimated on the basis of electrophoretic mobility of nanoparticles under an electric field. Measurements of the zeta-potential were carried out at 25°C. The instrument was verified routinely by using latex standard which gives a value of −50 mV (± 5 mV). The pH of diluted samples ranged from 6.4–6.8. The viscosity (0.8905 mPas) and refractive index (1.333) of water (diluting medium) were used for data analysis on the Zetasizer.
The percentage of drug incorporated during nanoparticles preparation was determined using both direct and indirect procedures. In the direct method, 10 mg of lyophilized samples were precisely weighed and then suspended in 10 ml of 5% w/v sodium dodecyl sulfate (SDS) in 0.1 M NaOH at 60°C for 10 min to accelerate hydrolysis of PLGA (CitationRojas et al., 1999). The clear solution was assessed for drug content by HPLC. In the indirect method, the amount of drug encapsulated within the nanoparticles was determined by measuring the amount of unencapsulated drug in supernatant recovered after centrifugation and washing of nanoparticles. About 100 µl of supernatant was diluted in the mobile phase. The diluted sample was injected into the HPLC and total amount of drug in supernatant was calculated. The encapsulation efficiency was mean ± SD of three readings from three batches. The results of the indirect and direct assay were compared. Since almost similar results were found with two methods, the direct method was applied for estimation of drug in nanoparticles. The encapsulation efficiency and the percent loading of ethionamide were then calculated as follows (CitationNahar et al., 2008):
Ethionamide-loaded nanoparticles were then stored in 5 ml glass vials sealed with plastic caps and were kept in a refrigerator with a temperature of 4–8°C. The physical stability of drug-loaded nanoparticles was measured before and after 90 days storage.
Estimation of ethionamide
The ethionamide was analyzed using HPLC comprising of a dual-piston reciprocating pump, an online de-gasser, a UV-VIS dual wavelength detector (each of Series 200) and a 600 Series Link Interface for data acquisition/processing, all from Perkin-Elmer Instruments LLC (Shelton, CT). The drug was analyzed on a reversed phase C18 column (Cosmosil 5C18-MS-II from waters; 250 mm × 4.6 mm; 5 µm particle size) by using 0.02 M disodium phosphate buffer: acetonitrile (75:25) as the mobile phase (pH adjusted to 6.8) at a flow rate of 1.5 ml/min, injection volume of 20 μl, retention time of 5.6 min, and detection wavelength (Λmax) of 254 nm (CitationJames & McCarthy, 1991).
Validation of method for drug estimation in mice plasma
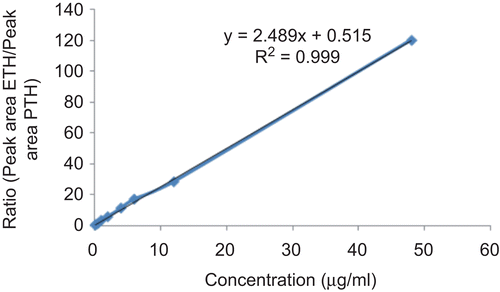
The method was validated by using ICH guidelines (www.fda.gov). The selectivity, lowest limit of detection (LOD), lowest limit of quantification (LOQ), linearity, precision, and accuracy were determined. The selectivity of method was determined as there was no interfering peak at the retention time of ethionamide in blank plasma chromatogram. The LOD of ethionamide was found to be 0.08 µg/ ml. The LOQ was 0.1 µg/ml with accuracy of 85% and coefficient of variation (CV) of 11.76% (). The calibration curve (), defined in three runs based on duplicate assays, was found to be linear in the concentration range of 0.1–48 µg/ml of ethionamide in mice plasma (R2 = 0.99). Pooled blank mice plasma was spiked with drug to give a working range of 0.1–48 µg/ ml. The linearity was defined by the following equation: y = 2.5x + 0.5, where y is the ratio of peak area of ethionamide/peak area of internal standard (prothionamide) and x is concentration (µg/ml) of ethionamide. Inter-day (between-run) and intra-day (within-run) accuracy and precision were measured using three quality control (QC) samples (0.3, 25, and 45 µg/ ml). Accuracy and precision of QC samples are shown in . Recovery was determined by comparing mean area of response at each QC level (0.3, 25, and 45 µg/ml) spiked before extraction vs that spiked after extraction (100% response) as described previously (CitationMatuszewski et al., 2003). The recovery of three QC samples was in the range of 87.5–99.7% ().The stability of ethionamide in plasma stored at three concentrations in triplicate (0.3, 25, and 45 µg/ml) in −20°C after protein precipitation in ACN was also investigated. A comparison of the peak area of the same sample solution at the beginning and after 5 days was determined. All samples were analyzed with use of freshly prepared calibration samples. The analysis of spiked plasma samples before and after storage at −20°C for 5 days showed no significant loss of analyte (p > 0.05, ). Similar results were obtained when this analytical technique was used for estimating the drug levels in tissue homogenates.
Table 1. Accuracy and precision data of ethionamide in spiked mice plasma.
Table 2. Recovery of ethionamide in spiked mice plasma.
Table 3. Stability of ethionamide in spiked mice plasma.
Figure 1. Calibration curve of ethionamide in mice plasma.
In vivo drug disposition studies
For a single dose drug disposition study, ethionamide was used at therapeutic dosage (130 mg/kg as per standard adult human dose on the basis of body surface area) and twice the therapeutic dosage (260 mg/kg). Mice were divided into three groups with 12 animals in each group and dosed as follow: (i) Oral free ethionamide (130 mg/ kg); (ii) Oral ethionamide-loaded PLGA nanoparticles (equivalent to a dose of 130 mg/kg of ethionamide); and (iii) oral ethionamide-loaded PLGA nanoparticles (equivalent to a dose of 260 mg/kg of ethionamide). In each group, mice were further divided into four groups of three animals and blood samples were taken from three animals per time point. The free ethionamide suspension was made by dispersing the ethionamide in 0.5% w/v sodium carboxy methyl cellulose in water. The suspension of ethionamide-loaded nanoparticles was prepared by redispersing them in water. The free ethionamide and ethionamide-loaded PLGA nanoparticles suspensions were vortexed for a few seconds before each dosing and given to the 3–4 h fasted mice by oral gavage tube in a fixed volume of 20 ml/kg. Blood samples (450 µl) were collected into eppendorf tubes (containing 50 µl sodium citrate (anti-coagulant)/450 µl blood) at 0, 0.08, 0.16, 0.25, 0.5, 1, 2, 6, 9, and 12 h in the case of the free ethionamide group and 0, 0.08, 0.16, 0.25, 0.5, 1, 2, 6, 9, 12, and 24 then every 24 h for 6–7 days in the case of the nanoparticle formulation administered groups. Immediately after collection, each blood sample was gently inverted several times to ensure complete mixing with the anti-coagulant. After each sampling, 1 ml of dextrose-normal saline was administered to prevent changes in the central compartment volume and electrolytes. Plasma was separated by centrifuging the blood samples at 10,000 rpm for 30 min at 4°C. Centrifugation of blood at 10,000 rpm for 30 min at 4°C led to settling down of drug-loaded nanoparticles and, since supernatant plasma was used for drug level estimation, we were able to measure only free drug. This is a standard procedure followed by other researchers as well. Plasma protein-free filtrates were then prepared in ACN (plasma:ACN; 1:1 v/v) by mixing vigorously for 40 s for deproteinization and then centrifuged at 10,000 rpm for 15 min. The supernatants were removed, filtered through a 0.2 micron syringe filter, and injected on the HPLC column to estimate the amount of ethionamide.
The blood concentration vs time data was analyzed according to a non-compartmental model. The maximum ethionamide concentration in plasma (Cmax) and time to reach maximum concentration (tmax) were determined by blood concentration vs time data. Elimination rate constant (kel) was calculated from the slope of the terminal phase of blood concentration vs time data after logarithmic transformation of the plasma concentration values and application of linear regression. The last three data points of plasma concentration–time curve were used to calculate the kel. The area under the plasma concentration–time curve from 0 h to infinity (AUC0–∞) was calculated as the sum of AUC0–t and AUCt–∞. The area under the plasma concentration–time curve from 0 to the last measurable time (AUC0–t) was calculated by the trapezoidal rule, and AUCt–∞ was calculated as Clast/kel, where Clast was the last observed plasma concentration after administration of drug and kel was elimination constant. The area under the first moment of the curve (AUMC = [t*Cdt]0∞] and the mean residence time (MRT = AUMC/AUC) were also calculated. The Pharmacokinetic/Pharmacodynamic (PK/PD) ratios such as ratio of peak concentration to MIC (Cmax/MIC), ratio of area under the curve to mice (AUC0–24/ MIC), and time for which drug level is more than MIC (Time > MIC) were also calculated.
Drug distribution in tissues
The animals were sacrificed by intraperitoneal administration of pentobarbital (60 mg/kg) at specified time intervals in the case of ethionamide-loaded PLGA nanoparticles, whereas at 12 h in the case of free drug. The tissues (lung, liver, and spleen) were excised and washed quickly with normal saline to remove surface blood. They were wrapped with foil and stored at −20°C. Thawed tissues were accurately weighed and drug levels were estimated in 20%w/v tissue homogenates prepared in normal saline. Samples preparation was achieved by protein precipitation of tissue homogenates with an equal volume of ACN (1:1). After vigorous vortexing, the samples were centrifuged at 21,000 × g for 10 min. The supernatants were removed, filtered through a 0.2 micron syringe filter, and 20 µl were injected on the HPLC column to estimate the amount of ethionamide in each tissue. The results were expressed as µg/ml of homogenate and µg/g of tissue. In order to validate the analytical technique in tissues, the linearity, accuracy, precision, and recovery were also determined in tissues homogenates from untreated animals.
Statistical analysis
Data was presented as mean ± SD and the percent coefficient of variation (CV%) was calculated as SD/mean × 100%. The linearity of calibration curve of ethionamide was validated using the coefficient of determination R-square (R2). The pharmacokinetic and PK/PD parameters were compared using one way analysis of variance (ANOVA) followed by post-hoc Scheffe test. The stability test values of free ethionamide in ACN and of drug-loaded nanoparticles before and after storage were compared by paired t-test. P < 0.05 was considered significant.
Results
Physicochemical characterization
Mean diameter of ethionamide-loaded nanoparticles was observed to be 286 ± 26 nm. The zeta-potential was −13 ± 2.5 mV (pH range of the preparation was 6.4–6.8) and PI was 0.2 ± 0.01. The encapsulation efficiency was found to be 35.2 ± 3.1% w/w and drug loading capacity was 38.6 ± 2.3% w/w. The encapsulation efficiency and nanoparticle size are known to be influenced by changes in sonication time, %w/v PVA concentration, and drug polymer ratio. We optimized the method of preparation of nanoparticles by altering these parameters (data unpublished) and, after optimization, we were able to obtain maximum encapsulation efficiency of 35.2 ± 3.1% w/w at 0.5% w/v PVA concentration with 3 min of sonication time and were able to obtain a maximum drug loading of ethionamide in nanoparticles of 38.6 ± 2.3% w/w.
There was no significant change in particle size, PI, zeta potential, encapsulation efficiency, and volume used for reconstitution after 90 days storage in a refrigerator (p > 0.05, ).
Table 4. Characterization of formulation before and after 90 days of storage at 4–8°C.
Pharmacokinetic study of free and encapsulated ethionamide
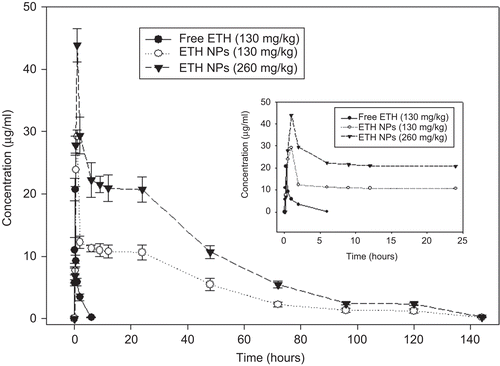
As seen in and , the ethionamide-loaded nanoparticle formulations demonstrated significant differences in pharmacokinetics of ethionamide as compared to free ethionamide following oral administration in mice. Plasma concentrations of ethionamide were obtained to be higher in animals given drug-loaded nanoparticles as compared to those given free drug suspension (). Drug-loaded nanoparticles (equivalent to 130 mg/kg and 260 mg/kg of ethionamide) illustrated a prolonged drug release profile for up to 6 days in comparison to only 6 h for free ethionamide (). The drug levels were also maintained above the MIC (0.6 µg/ ml; CitationZhu et al., 2002) for 5 days in the case of encapsulated ethionamide at both doses as compared to 2 h for free ethionamide. The pharmacokinetic parameters derived from plasma concentration–time profiles are summarized in . The Cmax, tmax, AUC0–∞, and AUMC were also significantly higher for ethionamide-loaded PLGA nanoparticles in comparison to free ethionamide (p < 0.05, ). The Cmax and AUC0–∞ for ethionamide (130 mg/ kg) were 20.71 ± 1.8 µg/ml and 21.89 ± 3.2 (µg/ ml).h, respectively and that for ethionamide-loaded nanoparticles (equivalent to 130 mg/kg of ethionamide) were 29.22 ± 1.0 µg/ ml and 657.45 ± 52.9 (µg/ml).h, respectively (p < 0.05). A significant increase in MRT of ethionamide in the case of drug-loaded nanoparticles was observed as compared to free drug (p < 0.05, ). The MRT value was 1.27 ± 0.2 h for free ethionamide and 36.11 ± 3.9 h for ethionamide-loaded nanoparticles (equivalent to 130 mg/kg of ethionamide). Moreover, doubling the dose of nanoformulation from 130 to 260 mg/kg led to a similar increase in the AUC values.
Table 5. Pharmacokinetic parameters of free ethionamide (ETH) and ethionamide-loaded nanoparticles (ETH NPs) upon oral administration in the mice.
Figure 2. In-vivo plasma concentration–time profile of orally-administered free ethionamide (ETH) and ethionamide-loaded nanoparticles (ETH NPs) equivalent to 130 mg/kg and 260 mg/kg of ethionamide in mice (n = 3–4 mice at each time point). Insert show an expanded view of 0–24 h plasma profile.
Tissues distribution of ethionamide
Ethionamide-loaded PLGA nanoparticles maintained release of drugs over a period of 5–7 days in organs (lung, liver, and spleen, ), while maintaining the organs level above MIC up to 5 days. In the free ethionamide group, ethionamide was not being detected even at 12 h in any of the tissues.
Table 6. Tissues drug levels following single oral administration of ethionamide-loaded PLGA nanoparticles (ETH NPs) at two doses in mice.
Pharmacokinetic/pharmacodynamic (PK/PD) ratios
Time above MIC (Time > MIC) denotes the time when the concentration of the drug needs to remain above the MIC against mycobacterium tuberculosis. It was found to be significantly higher (p < 0.05) for drug-loaded PLGA nanoparticles equivalent to 130 and 260 mg/kg of ethionamide than free ethionamide (120 h vs 2 h) (). The AUC0–24/MIC and Cmax/MIC ratios were 465.50 and 48.7, respectively, with drug-loaded nanoparticles (equivalent to 130 mg/kg of ethionamide) as compared with 36.11 and 34.51, respectively, with free drug (p < 0.05). The drug-loaded nanoparticles (equivalent to 260 mg/kg of ethionamide) led to further increase in these ratios ().
Table 7. Calculated values for AUC above MIC, Cmax above MIC, and time above MIC for free ethionamide (ETH) and ethionamide-loaded nanoparticles (ETH NPs) at a MIC90 (0.6 µg/ml).
Discussion
The success of anti-tubercular therapy relies on the regular intake of multiple anti-tubercular drugs for a long duration, which unfortunately most of the patients do not relish. This results in patient’s non-compliance and is the single most important cause of therapeutic failure. However, if the currently available anti-tubercular drugs could be modified in such a way so as to release the drugs in a slow and sustained manner, it would be possible to reduce the dosing frequency, thereby improving compliance. Undoubtedly, reduction in dosing frequency is a welcome therapeutic strategy. Therefore, in this study, the incorporation of ethionamide into PLGA nanoparticles was explored as a method to produce sustained release and improve the oral bioavailability of ethionamide.
Ethionamide-loaded PLGA nanoparticles were prepared by emulsion-diffusion-evaporation method. It was found that 0.5% w/v PVA and sonication time of 3 min were optimum to get small size nanoparticles with good encapsulation efficiency. After 90 days of storage in a refrigerator, freeze-dried nanoparticles were physically stable without any collapse or shrinkage of dried cake. There was also no change in physical appearance and encapsulation efficiency. The physical stability of a nanoparticles formulation refers to the ability of the particles to retain their size, size distribution, and morphology under certain conditions. In general, physical stability may be defined as the inhibition or prevention of processes such as aggregation. Additionally, microbiological growth, hydrolysis of the polymer, and drug leakage in humid environment are possible. A polymer can absorb some moisture on storage in a humid atmosphere. Absorbed moisture can initiate degradation and change in physiochemical properties, which can, in turn, affect the performance in vivo. Thus, storage conditions may be critical to the shelf-life of polymeric nanoparticle formulations and storage in a refrigerator in tight-capped vials may be important to maintain physiochemical integrity of degradable polymeric nanoparticles.
The profile of free ethionamide in blood was showing a rapid absorption phase within 15 min followed by rapid distribution and slower elimination phase. The blood pharmacokinetic profiles of ethionamide-loaded nanoparticles showed 1 h of absorption phase, followed by a couple of hours of distribution, after which a long plateau of 24 h was observed, to finally get to the elimination phase. The Cmax and AUC0–∞ of ethionamide in ethionamide-loaded nanoparticles, given at dose level of 130 mg/kg, were 1.4- and 30-fold higher relative to 130 mg/kg of free ethionamide, and the MRT was 28-times as long as that of free ethionamide. Moreover, the oral administration of drug-loaded PLGA nanoparticles illustrated a prolonged drug release profile with levels above MIC for 5 days in comparison to only 2 h plasma profile above MIC for free drug suspension. Several reasons may be given for improved bioavailability of ethionamide after administration of ethionamide-loaded nanoparticles. Bioadhesive properties of drug-loaded PLGA nanoparticles that bind them with the mucosa of the gastro-intestinal tract may increase their residence time at the gut epithelial cells. This may enhance the drug absorption due to intimacy of contact with the epithelial cells, reducing variability of absorption and erratic absorption (CitationWeiling et al., 2007). Nanoparticles are preferentially taken up by enterocytes and/or the M cells in the Peyer’s patches of the gut associated lymphoid tissue (GALT) followed by their shuttling into systemic circulation and release the drug in blood. This specialized uptake mechanism can also improve the absorption of drug (CitationItalia et al., 2007). Avoidance of hepatic first pass metabolism may also contribute to improve bioavailability of nanoformulations. The increase in AUC0–∞ of ethionamide in the case of drug-loaded nanoparticles may also be explained by the prolonged release of ethionamide from nanoparticles in the blood as well as decreased clearance of drug from the circulation. Similar results have been reported in mice and guinea pigs following administration of other drug-loaded PLGA nanoparticles (CitationRadwan et al., 1999; CitationPandey et al., 2003a; CitationHariharan et al., 2006; CitationDrummond et al., 2009; CitationKalaria et al., 2009; CitationVeera Reddy et al., 2009).
A significant increase in MRT of ethionamide in the case of drug-loaded nanoparticles (equivalent to 130 mg/kg and 260 mg/kg of ethionamide) as compared to free ethionamide was due to a change in ethionamide absorption and elimination upon its encapsulation in PLGA nanoparticles. This is also because of slow release of ethionamide from nanoparticles due to the higher biodegradation time of the drug-loaded nanoparticles (CitationHariharan et al., 2006). Moreover, the proportionate increase in the AUC values with doubling the dose (equivalent to 130 mg/kg to 260 mg/kg of ethionamide) of nanoparticles suggest that dose adjustment of nanoparticulate formulation is possible.
In this study, the tissues levels of the drug were measured along with plasma concentrations. Due to the localized nature of tuberculosis infection, measuring tissues concentrations of drug are a more meaningful approach rather than plasma drug concentrations to design an appropriate chemotherapeutic schedule. Nanoparticles can modify the tissues distribution profile which can be quite different when a drug (we used pure powder) is given in free form. After oral administration of ethionamide-loaded nanoparticles, ethionamide attained the highest concentration at 72 h in the tissues and concentration was declining thereafter. In these organs, ethionamide from ethionamide-loaded nanoparticles was detected above the MIC up to 5 days. Oral free ethionamide was not detectable in the tissues at 12 h of administration in equivalent dose. The presence in tissue is believed to be the result of uptake of nanoparticles by the RES macrophages (CitationMuller et al., 2001). Therefore, it is likely that the nanoparticles, apart from being in the circulation, were distributed to various tissues from where ethionamide was slowly released as the polymer underwent biodegradation.
The potential of PLGA nanoparticles to serve as a carrier for ethionamide was further supported by PK/PD parameters. The Time > MIC, Cmax/MIC, and AUC24/MIC are known to correlate with the efficacy of the antimicrobial drug. It has been shown that for penicillin treatment of gonorrhoea in men, Time > MIC of 7–10 h is needed for its optimal efficacy (CitationFrimodt-Moller, 2002). It has been noted that the Cmax/MIC ratio of 8–10 is a good efficacy predictor for aminoglycosides (CitationCraig, 1998), in the case of fluoroquinolones, an AUC24/MIC ratio of 100–125 against gram-negative and 25–35 against gram-positive organisms seems to be desirable (CitationSchmidt et al., 2008). Therefore, it is expected that this formulation of ethionamide-loaded PLGA nanoparticles may provide a better antimicrobial effect due to its significantly higher Time > MIC (120 h). In this study, the AUC24/MIC and Cmax/MIC were also found to be significantly higher for encapsulated ethionamide at both doses as compared to free ethionamide. Thus, this formulation may provide a better anti-mycobacterial effect because of its superior PK/PD profile.
Moreover, no adverse effects with respect to behavior, biochemistry, hematology, and pathology were seen in doses used in pharmacokinetic studies of ethionamide-loaded nanopaticles. Detailed toxicity studies were conducted at higher doses and drug-loaded nanoparticles were found to be no more toxic than free ethionaimde.
Conclusion
Encapsulation of ethionamide in nanoparticles led to significant improvement in the pharmacokinetic profile of ethionamide after oral administration to mice. Significantly higher Cmax, tmax, AUC, and MRT were seen for ethionamide-loaded nanoparticles as compared to free ethionamide. Drug-loaded PLGA nanoparticles provided sustained release of ethionamide for up to 6 days in plasma and 5–7 days in tissues while maintaining drug levels above MIC for 5 days. Hence, this formulation may be superior to existing ones because it has the potential for reduction in dosing frequency, which can lead to greater patient’s compliance and thus decrease chances of development of drug resistance. Future studies focusing on the chemotherapeutic potential of ethionamide-loaded nanoparticles against Mycobacterium tuberculosis in animal model and toxicity studies with drug-loaded nanoparticles will help us answer more questions. Targeting delivery to potential sites that includes the alveolar surface and resolving processing/manufacturing issues for large scale production at an affordable cost will be fundamental issues in the immediate future.
Acknowledgements
The authors are grateful to Indian Council of Medical Research (ICMR), Government of India, New Delhi for providing fellowship to GK.
Declaration of interest
The authors have nothing to declare.
References
- Auclair, B., Nix, D.E., Adam, R.D., James, G.T., Peloquin, C.A. (2001). Pharmacokinetics of ethionamide administered under fasting conditions or with orange juice, food, or antacids. Antimicrob Agents Chemother. 45:810–4.
- Bass, J.B., Jr., Farer, L.S., Hopewell, P.C., O’Brien, R., Jacobs, R.F., Ruben, F., Snider, D.E., Jr., Thornton, G. (1994). Treatment of tuberculosis and tuberculosis infection in adults and children. American thoracic society and the centers for disease control and prevention. Am J Crit Care Med. 149:1359–74.
- Craig, W.A. (1998). Pharmacokinetic/pharmacodynamic parameters: rationale for antibacterial dosing of mice and men. Clin Infect Dis. 26:1–12.
- Desai, M.P., Labhasetwar, V., Amidon, G.L., Levy, R.J. (1996). Gastrointestinal uptake of biodegradable microparticles: effect of particle size. Pharm Res. 13:1838–45.
- Drummond, D.C., Noble, C.O., Guo, Z., Hayes, M.E., Park, J.W., Ou, C.-J., Tseng, Y.-L., Hong, K., Kirpotin, D.B. (2009). Improved pharmacokinetics and efficacy of a highly stable nanoliposomal vinorelbine. J Pharm Exp Ther. 328:321–30.
- Florence, A.T. (1997). The oral absorption of micro and nanoparticulates: neither exceptional nor unusual. Pharm Res. 14:259–65.
- Florence, A.T. (2005). Nanoparticle uptake by the oral route: fulfilling its potential? Dr Discov Today: Technologies. 2:75–81.
- Frimodt-Moller, N. (2002). How predictive is PK/PD for antibacterial agents. Int J antimicrob agents. 19:333–9.
- Gronroos, J.A., Toivanen, A. (1964). Blood ethionamide levels after administration of enteric coated and uncoated tablets. Curr Ther Res. 6:105–14.
- Hariharan, S., Bhardwaj, V., Bala, I., Sitterberg, J., Bakowsky, U., Ravi Kumar, M.N.V. (2006). Design of estradiol loaded PLGA nanoparticulate formulations: a potential oral delivery system for hormone therapy. Pharm Res. 23:184–95.
- Italia, J.L., Bhatt, D.K., Bhardwaj, V., Tikoo, K., Kumar, M.N. (2007). PLGA nanoparticles for oral delivery of cyclosporine: nephrotoxicity and pharmacokinetic studies in comparison to Sandimmune Neoral. J Contr Rel. 119:197–206.
- James, G.T., McCarthy, E. (1991). Improved high performance liquid chromatographic assay for the determination of ethionamide in serum. J Chromatography. 563:472–5.
- Kalaria, D.R., Sharma, G., Beniwal, V., Ravi Kumar, M.N.V. (2009). Design of biodegradable nanoparticles for oral delivery of doxorubicin: in vivo pharmacokinetics and toxicity studies in rats. Pharmaceutical research. 26:492–501.
- Lamprecht, A., Ubrich, N., Yamamoto, H., Schafer, U., Takeuchi, H., Maincent, P., Kawashima, Y., Lehr, C.M. (2001). Biodegradable nanoparticles for targeted drug delivery in treatment of inflammatory bowel disease. J Pharmacol Exp Ther. 299:775–81.
- Matuszewski, B.K., Constanzer, M.L., Chavez-Eng, C.M. (2003). Strategies for the assessment of matrix effect in quantitative bioanalytical methods based on HPLC-MS/MS. Anal Chem. 75:3019–30.
- Muller, R.H., Jacobs, C., Kayser, O. (2001). Nanosuspensions as particulate drug formulations in therapy rationale for development and what we can expect for the future. Adv Drug Deliver Rev. 47:3–19.
- Nahar, M., Mishra, D., Dubey, V., Jain, N.K. (2008). Development, characterization, and toxicity evaluation of amphotericin B-loaded gelatin nanoparticles. Nanomedicine. 4:252–61.
- Norris, D.A., Puri, N., Sinko, P.J. (1998). The effect of physical barriers and properties on the oral absorption of particulates. Adv Drug Deliver Rev. 34:135–54.
- Pandey, R., Sharma, A., Ahmad, Z., Sharma, S., Khuller, G.K., Prasad, B. (2003a). Poly (DL-lactide-co-glycolide) nanoparticle-based inhalable sustained drug delivery system for experimental tuberculosis. J Antimicrob Chemother. 52:981–6.
- Pandey, R., Zahoor, A., Sharma, S., Khuller, G.K. (2003b). Nanoparticle encapsulated antitubercular drugs as apotential oral drug delivery system against murine tuberculosis. Tuberculosis. 83:373–8.
- Radwan, M.A., Zaghloul, I.Y., Aly, Z.H. (1999). In vivo performance of parenteral theophylline- loaded polyisobutylcynoacrylate nanoparticles in rats. Eur J Pharm Sci. 8:95–8.
- Rojas, J., Pinto-Alphandary, H., Leo, E., Pecquet, S., Couvreur, P., Fattal, E. (1999). Optimization of the encapsulation and release of beta-lactoglobulin entrapped poly(DL-lactide-co-glycolide) microspheres. Int J Pharm. 183:67–71.
- Schmidt, S., Barbour, A., Sahre, M., Rand, K.H., Derendorf, H. (2008). PK/PD: new insights for antibacterial and antiviral applications. Curr Opin Pharmacol. 8:549–56.
- Veera Reddy, P.R., Vobalaboina, V., Ali, N. (2009). Antileishmanial activity, pharmacokinetics and tissue distribution studies of mannose-grafted amphotericin B lipid nanosphere. J Drug target. 17:140–7.
- www.fda.gov/ CDER/ Guidance for industry/ ICH Q2B document: Validation of analytical procedures: Methodology/ Nov. 1996/ Accessed on: 10/07/2008.
- Weiling, H., Horn, S.W., Hussain, M.D. (2007). Improved bioavailability of orally administered mifepristone from PLGA nanoparticles. Int J Pharm. 34:173–8.
- Weinstein, H.J., Hallett, W.Y., Sarauw, A.S. (1962). The absorption and toxicity of ethionamide. Am Rev Respir Dis. 86:576–8.
- Zhu, M., Namdar, R., Stambaugh, J.J., Starke, J.R., Bulpitt, A.E., Berning, S.E., Peloquin, C.A. (2002). Population pharmacokinetics of ethionamide in patients with tuberculosis. Tuberculosis. 82:91–6.