Abstract
Carvedilol, a widely prescribed cardiovascular drug for hypertension and congestive heart failure, exhibits low and variable bioavailability owing to poor absorption and extensive hepatic first-pass metabolism. The current research work, therefore, entails formulation development of liquid self-nano-emulsifying drug delivery systems (SNEDDS) to enhance the bioavailability of carvedilol by facilitating its transport via lymphatic circulation. The formulation constituents, i.e. lipids, surfactants, and co-surfactants, were selected on the basis of solubility studies. Pseudo-ternary phase diagrams were constructed to embark upon the selection of blend of lipidic (i.e. Capmul PG8) and hydrophilic components (i.e. Cremophor EL as surfactant and Transcutol HP as co-surfactant) for efficient and robust formulation of SNEDDS. The SNEDDS, systematically optimized employing a central composite design (CCD), were evaluated for various response variables viz drug release parameters, emulsification time, emulsion droplet size, and mean dissolution time. In vitro drug release studies depicted that the release from SNEDDS systems followed a non-Fickian kinetic behavior. The TEM imaging of the optimized formulation affirmed the uniform shape and nano size of the system. Accelerated studies of the optimized formulation indicated high stability of the formulation for 6 months. The in situ perfusion studies carried out in wistar rats construed several fold augmentation in the permeability and absorption potential of the optimized formulation vis-à-vis marketed formulation. Thus, the present studies ratified the potential of SNEDDS in augmenting the oral bioavailability of BCS class II drugs.
Introduction
Cardiovascular disorders (CVDs) constitute the most prevalent group of serious diseases, accounting for nearly 30% of all fatalities, the world over (http://www.who.int/topics/cardiovascular_diseases/en/). Despite enormous innovations in novel drug delivery systems (DDS) through alternative routes, oral drug delivery of cardiovascular drugs has unambiguously been the most sought after by the patients and manufacturers alike (CitationGupta et al., 2009). Its status is primarily a consequence of the wide acceptability of this ‘natural’ route, better safety vis-à-vis the parenteral route, low cost of therapy, and improved patient compliance. Accordingly, today more than 80% of the cardiovascular DDS available commercially are the oral ones (http://www.reportlinker.com/p0189377/Innovations-in-Oral-Solid-Drug-Delivery-Advances-in-nanotechnology-controlled-formulations-peptide-delivery.html).
Carvedilol is a popularly employed drug in various CVDs. Not only is it indicated in hypertension, but it has immense potential in myocardial infarction and congestive heart failure too (CitationBogaard et al., 2010; CitationWen et al., 2010). Being a poorly water-soluble and highly permeable drug with log p of 4.115, it can be safely regarded as a BCS class II drug (CitationVCCLAB VCCL, 2005). It also undergoes extensive first-pass metabolism in liver, which leads to the marked reduction in absolute oral bioavailability in humans (~ 20%) and in animals like dogs, rats, etc. (Citationvon Mollendorff et al., 1987; CitationMorgan, 1994; CitationHokama et al., 1999; CitationArsenault et al., 2005). This renders the drug unsuitable for traditional methods of bioavailability enhancement like micronization, solid dispersions using hydrophilic carriers and block-copolymers, complexation with water-soluble carrier(s), etc. (CitationPatel et al., 2008; CitationVogt et al., 2008; CitationYavuz et al., 2010). All these techniques yield limited fruition when the drug exhibits low bioavailability, owing to metabolism by the cytochrome P450 family of enzymes present in the gut enterocytes and liver hepatocytes, instability in gastrointestinal (GI) fluids, restricted intestinal permeability, and/ or P-glycoprotein (P-gp) efflux (Citationde Smidt et al., 2004; CitationSha et al., 2005; CitationKoga et al., 2006; CitationConstantinides & Wasan, 2007; CitationHauss, 2007; CitationSingh et al., 2009a).
Self-emulsifying drug delivery systems (SEDDS), in this regard, have been gaining world-wide acceptance to improve the bioavailability potential of lipophilic drugs by augmenting their dissolution and permeation, and for bypassing hepatic first-pass effect (CitationHumberstone & Charman, 1997; CitationPorter & Charman, 2001; CitationSha et al., 2005; CitationKoga et al., 2006). Also, the SEDDS have been documented to show a prominent role in surmounting the effects of Pgp efflux and intestinal metabolism by Cytochrome P450 isoforms (CitationSha et al., 2005; CitationKoga et al., 2006). The SEDDS, being an isotropic mixtures of lipids, emulsifiers, and co-emulsifiers, typically produce emulsions with a globule size ranging between a few nanometers and several microns (CitationCharman et al., 1992; CitationJoshi et al., 2008; CitationPouton & Porter, 2008; CitationSingh et al., 2009b). The SEDDS formulation normally forms a clear dispersion instantaneously in the GI tract that remains stable on dilution (CitationSpernath & Aserin, 2006). Such dispersions are referred to as either micro- or nanoemulsions, depending upon the globule size of the SEDDS formulation (CitationThi et al., 2009). The SEDDS formulations, which result in the formation of nano-sized globules, are termed self-nanoemulsifying drug delivery systems (SNEDDS).
Design of an impeccable SEDDS formulation requires rational blends of diversely behaving lipids, surfactants, co-surfactants, charge inducers, etc., not achievable using the traditional drug delivery approaches of changing one variable at a time (OVAT). Systematic optimization of such isotropic delivery systems using Design of Experiments (DoE), on the other hand, offers numerous advantages including a high degree of precision and prognosis, and economy in terms of time, effort, and money (CitationSingh et al., 2005a). Also this approach is known to provide a depth of understanding and ability to explore and defend the ranges for varied formulation and processing factors. Central composite design (CCD), in this regard, has been frequently employed for the optimization of the SEDDS formulation (CitationSingh & Ahuja, 2002; CitationSingh et al., 2006). Thus, the present investigation aims at developing SEDDS of carvedilol employing systematic DoE for enhancement of its dissolution and bypassing the first-pass effect, resulting consequently in an increased bioavailability.
Materials
Chemicals and reagents
Carvedilol was provided ex-gratis by M/s Matrix Laboratories Ltd. (Hyderabad, India). Labrafac PG (propylene glycol dicaprylocaprate), Labrafac Lipophilic WL 1349 (medium chain triglycerides), Labrafil M 2125CS (linoleoyl macrogolglycerides), Gelucire 44/14, Transcutol HP (lauroyl macrogolglycerides), and Labrasol (caprylocaproyl macrogolglycerides) were received as gift samples from M/s Gattefosse (Saint-Priest, France). Cremophor EL (polyoxyethylene castor oil) was supplied ex-gratis by M/s BASF GmbH (Minden, Germany). Capmul PG 8 (Propylene glycol monocaprylate) and Captex 200 (propylene glycol dicaprylate/dicaprate) were received as gift samples from M/s Abitec Corp. (WI). All other materials and chemicals procured for the studies were of analytical grade, and were used as such as obtained.
Methods
Initial studies for screening of excipients
Solubility studies
Equilibrium solubility of carvedilol was measured in various lipids viz. Labrafac PG, Labrafac Lipophilic WL 1349, Captex 200, Labrafil M 2125CS, and Capmul PG 8. An excess amount of carvedilol was added to each of the selected vehicles, and the mixture was stirred continuously for 72 h at 37 ± 1°C. After equilibrium was attained, the mixture was centrifuged at 67.2 × g for 10 min, and the obtained supernatant was filtered through a membrane filter having pore size of 0.45µ (M/s mdi Membrane Technologies LLC, California, USA). Spectrophotometric absorbance of the filtrate was measured using a double beam UV/VIS spectrophotometer (UV 3000+, M/s Labindia, Mumbai, India) at a λmax of 285 nm. The content of carvedilol was determined using a previously constructed standard calibration plot, taking ![]() as 365 and molar extinction coefficient as 14,836.3.
as 365 and molar extinction coefficient as 14,836.3.
Selection of surfactants and co-surfactants
Different ratios of oil-to-surfactant were selected, within the range of 1:9–9:1, to properly delineate the boundaries of microemulsion and emulsion phases. Visual observations were made and recorded following addition of every installment (5 mL) of water.
Pseudo-ternary phase diagram construction
A pseudo-ternary phase diagram was constructed using PCP Disso ver 3.0 software (Pune College of Pharmacy, Pune, India) by titrating three components, consisting of mixtures of surfactant and co-surfactant with water at the ambient temperature. The mixture was observed visually following equilibration. The generated sample, which was clear or slightly bluish in appearance, was taken as a microemulsion. A series of pseudo-ternary phase diagrams were also constructed to precisely identify the regions of microemulsion and emulsion (CitationShafiq-un-Nabi et al., 2007).
Preparation of liquid SEDDS as per experimental design
The liquid SEDDS formulations were prepared by the standard admixture method as illustrated earlier by us (CitationSingh et al., 2009b). Drug was dissolved in the lipid at ambient temperature. The blend of surfactant and co-surfactant, in the pre-determined ratio, was added to the lipidic drug solution, while stirring at high speed using a magnetic stirrer (Perfit, Ambala, India) at ambient temperature. On the basis of the formation of maximal microemulsion region in the pseudo-ternary phase diagram, cremophor EL as surfactant (X1) and Transcutol HP as cosurfactant (X2) were selected as the two factors for further formulation optimization work (CitationSingh et al., 2005a; Citationb). Limits for surfactant and co-surfactant were also ascertained for subsequent detailed studies. A CCD with α = 1 was employed, where the amounts of oil and surfactant were studied at three levels each. Overall, a set of 13 experimental runs were studied as per the experimental design matrix, as depicted in . The formulation at the intermediate coded factor levels (i.e. 0,0) was studied in quintuplicate. The response variables considered for current optimization studies encompassed percentage of drug released in 5 min (Q5min), mean dissolution time (MDT), emulsification time, and droplet size.
Table 1. Preparation of SNEDDS as per the experimental design.
Formulation characterization
Determination of droplet size and size distribution
Aliquots (1 mL) of the samples serially diluted 1000-fold with purified water were employed to assess the globule size distribution (CitationCraig et al., 1995). The emulsion droplet size and size distribution were determined by laser diffraction technique using a particle size analyzer (ZS 90, Malvern, Worcestershire, UK) (CitationLaia et al., 1998). Each study was carried out in triplicate to ensure reproducibility.
In vitro dissolution studies
Dissolution studies were carried out for all the formulation combinations in triplicate, employing USP 31 Apparatus 2 (Labindia, DS A/S 8000, Mumbai, India) using 500 mL of simulated gastric fluid (SGF) containing 0.5% w/v SLS at 50 rpm and 37 ± 0.5°C. An aliquot of sample (5 mL) was periodically withdrawn at suitable time intervals, and the volume replaced with an equivalent amount of fresh dissolution medium. The samples, after suitable dilution(s), were analyzed spectrophotometrically at a λmax of 285 nm taking ![]() as 288 and molar extinction coefficient as 11,706.5. Dissolution study is also conducted on pure carvedilol in an analogous manner.
as 288 and molar extinction coefficient as 11,706.5. Dissolution study is also conducted on pure carvedilol in an analogous manner.
Emulsification time
A quantity of 1.0 g of each of the formulations was added to 0.5% w/v SLS solution (500 mL) under continuous stirring (50 rpm) using a USP 31 Apparatus 2 (Labindia, DS 8000, Mumbai, India) at 37 ± 0.5°C. Time required to disperse the system completely and uniformly was determined, and was recorded as the emulsification time.
Data analysis
The raw data obtained from in vitro dissolution were analyzed using an in-house developed software, ZOREL (CitationSingh & Singh, 1998). The software has the in-built provisions for applying the correction factor (CitationSingh et al., 1997) for volume and drug losses during sampling using equation (1), calculating the values of amount of drug dissolved, percentage drug release, rate of drug release, and log fraction released at varied times.
where Cc is the corrected concentration, Ci is the uncorrected concentration, Vs is the volume of sample withdrawn, and Vt is the total volume of dissolution medium.
Using the software, mean dissolution time (MDT) for various formulations was also calculated. The values of time taken for 60%, 70%, and 80% release, described as t60%, t70%, and t80%, respectively, were calculated using Stineman interpolation option of the GRAPH ver 4.3 software (Micromath, MO).
Optimization data analysis and validation of optimization model
The response variables, which were considered for systematic DoE optimization studies, included Q5min, MDT, emulsification time, and emulsion droplet size. For the studied design, the multiple linear regression analysis (MLRA) was applied to a fit full second-order polynomial equation with added interaction terms to correlate the studied responses with the examined variables using Design Expert ver. 6.0.10 software (Stat-Ease, Minneapolis, MN). The polynomial regression results were demonstrated for the studied responses. Finally, the prognosis of optimum formulation was conducted using a two-stage brute force technique using MS-Excel spreadsheet software. Initially, a feasible space was located, and, subsequently, an exhaustive grid search was conducted to predict the possible solutions. Seven formulations were selected as the confirmatory check-points to validate response surface methodology (RSM). The observed and predicted responses were critically compared. Linear correlation plots and the residual graphs between predicted and observed responses were constructed for the chosen check-point formulations. The percent bias (= prediction error) was also calculated with respect to the observed responses.
Drug release comparison with marketed brand
Drug release profiles of the optimized formulations were compared with that of the conventional marketed brand (Carloc™, M/s Cipla Pharma Ltd., Mumbai, India), each containing 12.5 mg of carvedilol.
In situ single pass intestinal perfusion (SPIP) studies
Perfusion studies were performed in male Wistar rats, obtained from the Central Animal House of Panjab University, which were previously made to abstain from solid food at least 24 h prior to the study. The animal studies were carried out after obtaining requisite approval from Institutional Ethics Committee of Panjab University, Chandigarh, India. The SPIP studies were carried out on the optimized liquid formulations, marketed brand, and pure drug, each in triplicate, employing an in-house fabricated assembly (CitationYao et al., 2008). The animals were anesthetized using thiopental sodium (50 mg/kg) intraperitoneally. Following mid-line incision of the abdomen, the proximal part of the jejnum, 2–5 cm below the ligament of Trietz, was cannulated with a glass cannula and connected to a reservoir (CitationHo et al., 2008). The second incision was made 10–15 cm below the first incision and connected with an outflow glass cannula. The intestinal segments were perfused with plain phosphate buffer (37 ± 1°C) until the perfusate was clear. The intestinal segments were subsequently perfused with drug solution maintained at 37 ± 1°C at a perfusion rate of 0.2–0.3 mL/min. Steady state was achieved within 30 min, after which aliquots of 4–5 samples were periodically withdrawn at a regular intervals of 15 min each.
Diethyl ether (4 mL) was added to 1 mL of each perfusate sample, and the mixture was centrifuged at 1680 × g for 15 min. Following centrifugation, 3 mL of the supernatant etheral fraction was collected and evaporated. Finally, 1.5 mL of perfusion solution was added to the ethereal extract and the drug concentration of the mixture was determined spectrophotometrically at a λmax of 285 nm taking ![]() as 145 and molar extinction coefficient as 5893.8.
as 145 and molar extinction coefficient as 5893.8.
Electron microscopic examination
The morphology of the optimized liquid SNEDDS was observed using a transmission electron microscope (TEM, H 7500, Hitachi, Tokyo, Japan) attached with a mega view II digital camera. One part of the SNEDDS formulation was diluted with 200 parts of distilled water and mixed by gentle shaking. One drop of the diluted sample was deposited on a film-coated copper grid, stained with one drop of phosphotungstic acid, and allowed to dry before observation under the TEM. The image was magnified and focused on a layer of photographic film (CitationElnaggar et al., 2009).
Accelerated stability study
The optimized liquid SNEDDS formulations were subjected to accelerated stability studies, carried out at 40 ± 2°C/75% ± 5% RH and 25 ± 2°C/60% ± 5% RH, as per the ICH guidelines, Q1A(R2), for the climatic zone IV (http://www.ich.org/fileadmin/Public_Web_Site/ICH_Products/Guidelines/Quality/Q1A_R2/Step4/Q1A_R2_Guideline.pdf). The formulations were kept in air-tight glass vials and were assayed for drug content and dissolution performance periodically at the time points of 0, 1, 2, 3, 4, and 6 months. Similarity factor (f2) was calculated to investigate the analogy of dissolution profiles during the stability studies (http://www.ich.org/cache/compo/363-272-1.html).
Results
Initial studies for screening of excipients
Solubility studies
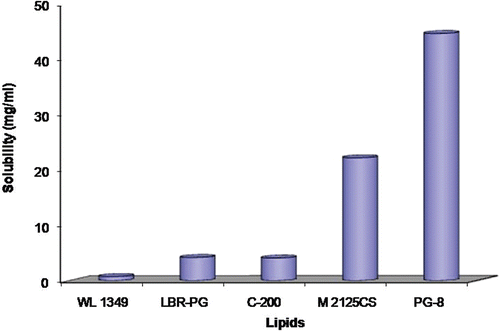
Among various synthetic lipidic solvents investigated for equilibrium solubility studies, viz Labrafac PG, Labrafac Lipophilic WL 1349, Captex 200, Labrafil M 2125CS, and Capmul PG 8, the maximum solubility of carvedilol (44.66 mg/mL) was observed in Capmul PG8. The minimum solubility (0.74 mg/mL), however, was found in Labrafac lipophilic WL1349. depicts the capacity of different oils to solubilize carvedilol.
Pseudo-ternary phase diagram construction
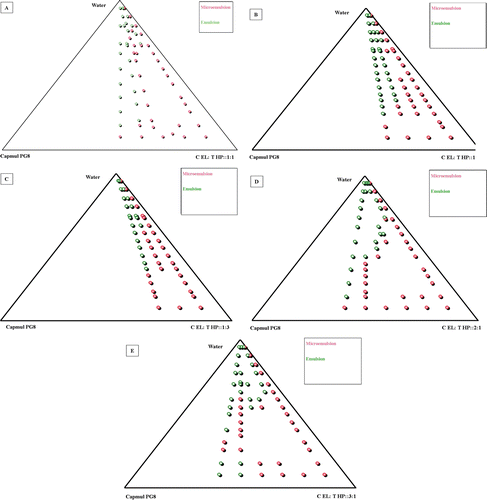
show phase diagrams constructed to identify the area of stable micro/nanoemulsion in the presence of carvedilol. Based on the various combinations, Capmul PG8, Cremophor EL, and Transcutol HP (2:1) was selected for the formulation of optimized liquid SNEDDS.
Determination of droplet size
Globule size of all the 13 SEDDS formulations, prepared as per the experimental design, ranged between 46–475 nm. Remarkable diminution in globule size was observed with the increasing levels of emulgent as well as that of oil.
In vitro dissolution studies
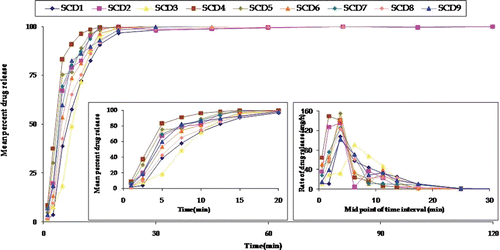
illustrates the drug release profiles (up to 2 h) of all the SEDDS formulations prepared as per CCD. The insets depict the mean per cent carvedilol release up to 20 min, and the rate of drug release for all the formulations, respectively.
Figure 3. Plot between mean percent carvedilol release for all 13 formulations prepared as per 2-factor central composite design where SCD 5 represents the mean of five formulations. The insert shows the release behavior of formulations in 20 min and mean rate of release vs midpoint of time interval.
Response surface analyses
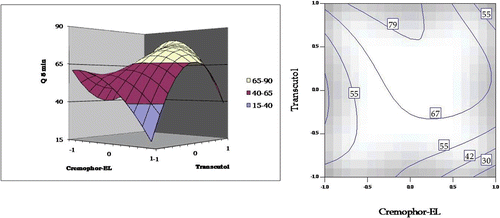
A twisted response surface plot was observed for Q5min. The plot () shows a distinct non-linear increase in Q5min from lower to intermediate values of Transcutol HP, whereafter, a sharp decline was observed at a higher concentration of Cremophor EL. With Cremophor EL, Q5 min showed a non-linear decline from higher to lower levels. However, an interaction, i.e. lack of parallelism, was observed at lower levels of the surfactant and co-surfactant both. The respective 2D-contour plot also corroborates the same.
Figure 4. Response surface plot and the corresponding contour plot showing the influence of Cremophor and Transcutol on Q5min for self-emulsifying formulations of carvedilol.
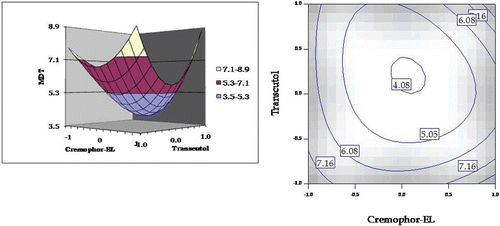
The MDT response plot shows a distended beach-net kind of curve. The plot () depicts a non-linear decrease in MDT from lower to intermediate values of Cremophor EL, followed by a non-linear increase from intermediate to higher levels. Similar response was observed with Transcutol HP. However, in this case, this response was much steeper as compared to the former. The respective 2D-contour plot also depicts a nadir at the intermediate regions of Cremophor EL and Transcutol HP.
Figure 5. Response surface plot and the corresponding contour plot showing the influence of Cremophor and Transcutol on mean dissolution time (MDT) values for self-emulsifying formulations of carvedilol.
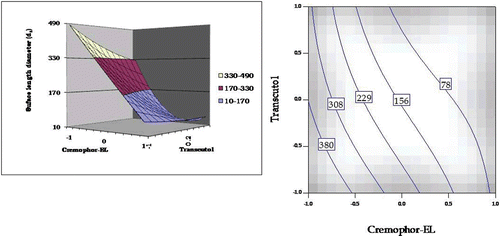
The response surface of emulsion droplet size, i.e. surface length diameter, is shown in . A sharp linear decrease in emulsion droplet size was observed from lower to higher levels of Cremophor EL. On the other hand, varying concentrations of Transcutol HP showed relatively little effect on emulsion droplet size, esp. at the high levels of the surfactant. On increasing the concentration of Transcutol HP from lower level to higher level (at low concentrations of Cremophor EL), however, a linear decline in the size of globules was observed. The corresponding contour plot shows the optimal region at higher concentrations of Cremophor EL, while Transcutol HP relatively played an inert role in determining the droplet size.
Figure 6. Response surface plot and the corresponding contour plot showing the influence of Cremophor and Transcutol on emulsion droplet size (surface length diameter) for self-emulsifying formulations of carvedilol.
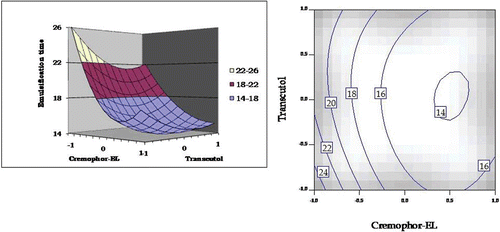
As illustrated in , a curvilinear decrease was observed on increasing the concentrations of Cremophor EL and Transcutol HP. At higher levels of Cremophor-EL and lower levels of Transcutol HP, however, a modest increase in emulsification time was observed, indicating the presence of an interaction between the excipients. The respective 2-D contour plot also ratifies a minimum at the higher levels of Cremophor EL and intermediate levels of Transcutol HP.
DoE validation and selection of optimum formulation
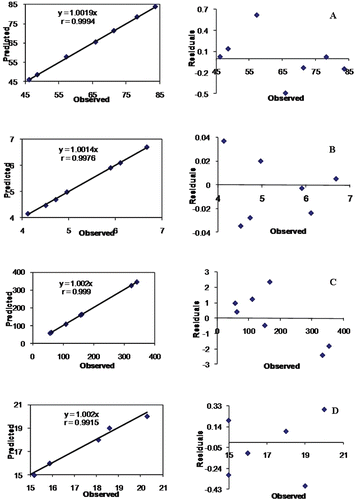
Upon comparison of the observed responses with those of the anticipated ones, the prediction error varied between −2.15% and 1.48% with overall mean ± SD as −0.041 ± 0.969%. Linear correlation plots () drawn between the predicted and observed responses after forcing the line through the origin, also demonstrated high values of r, ranging between 0.9916–0.9999. The corresponding residual plots show nearly uniform and random scatter around the zero axis.
Figure 8. Linear plot and residual plot between the observed and predicted values of (a) Q5min, (b) MDT, (c) droplet size, and (d) emulsification time.
The optimum formulation was selected by ‘trading off’ various response variables and adopting the following criteria: Q5min > 70%; MDT < 5 min; Droplet size < 250 nm; Emulsification time < 20 min. Upon comprehensive evaluation of grid searches, two formulations viz. VAL6 (i.e. C-EL: 272.5 mg and Transcutol HP: 180.0 mg) and VAL7 (i.e. C-EL: 360.0 mg and Transcutol HP: 159.0 mg) were found to fulfill maximal criteria for optimal performance. VAL6 exhibited Q5 min as 83.69%, MDT as 4.99 min, droplet size as 110 nm, emulsification time as 18.1 min and VAL7 exhibited Q5 min as 78.40%, MDT as 4.48 min, droplet size as 62 nm, emulsification time as 15.2 min, respectively. These two formulations, therefore, were chosen for further studies viz. in vitro drug release comparison with marketed formulation and in situ SPIP studies.
In vitro drug release comparison with marketed formulation
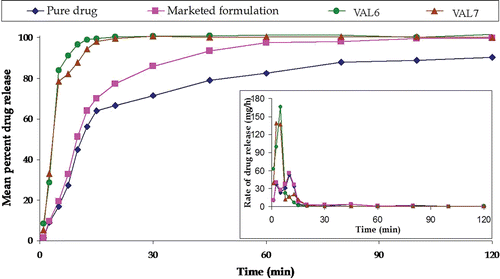
Marked improvement was observed in the release profiles () of formulation VAL6 and VAL7 vis-à-vis the marketed formulation (Carloc™). Drug dissolution was nearly completed within 20 min in the case of the optimized formulation, as compared to that of the pure drug and marketed formulation, where drug release was only 67% and 77%, respectively.
In situ intestinal perfusion studies
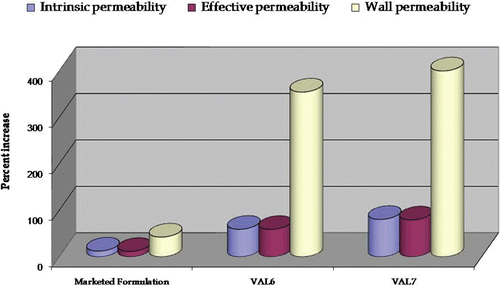
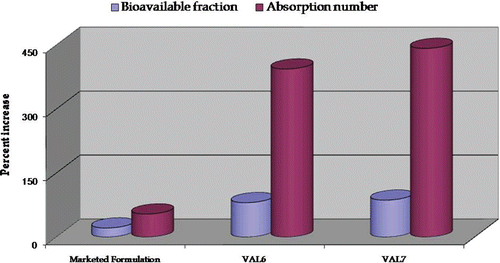
depicts the percent increase in intrinsic permeability, effective permeability, and wall permeability in the case of VAL6 and VAL7 vis-à-vis pure drug and marketed formulation. portrays a plot of percent increase in absorption number and bioavailable fraction in the case of VAL6 and VAL7 vis-à-vis pure drug and marketed formulation. The formulation VAL7 exhibited marked improvement in all the permeation parameters as well as the absorption number and bioavailable fraction vis-à-vis the marketed formulation and VAL6. Hence, based upon SPIP studies and in vitro drug release comparison studies, the formulation VAL7 was selected as the optimized formulation for further studies viz. TEM examination and accelerated stability studies.
Electron microscopic examination
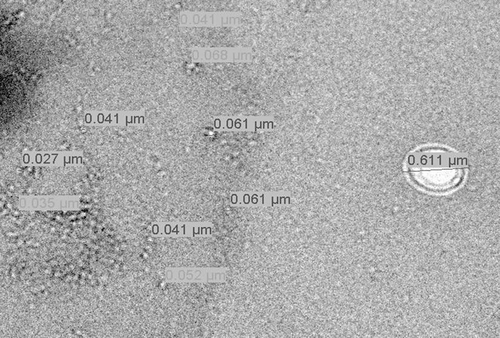
depicts the electron microscopic image of the optimized formulation VAL7. As evident from the figure, all the globules were of uniform shape and most of them possessed globule size of less than 100 nm.
Accelerated stability studies
shows miniscule variation in the formulation parameters during the 6 months of storage at both the stability conditions as mentioned in the methods section. The values of the similarity factor (f2) ranged between 99.56 and 96.29 and 98.16 and 94.10, respectively. All the dissolution profiles tended to be coincident at 15 min.
Table 2. Effect on the parameters during the accelerated stability studies kept at 25°C ± 2°C/60% RH ± 5% RH and 40°C ± 2°C/75% RH ± 5%.
Discussion
The present investigation describes the development of optimized liquid SNEDDS formulations of carvedilol and its systematic optimization employing the benefits of DoE methodology.
Equilibrium solubility studies were carried out in an attempt to find out the maximum soluble fraction of carvedilol in different lipids. As the solubility of carvedilol was found to be minimum in triglycerides and maximum in monoglycerides (), it can be discerned that esterification of glycerides leads to decreased solubility of the drug. Based upon the solubility studies, Labrasol, Gelucire 44/14, and Cremophor EL were selected as the surfactants, out of which Cremophor EL was capable of forming a stable emulsion.
To ensure the spontaneity of SNEDDS to form the nanoemulsion within the GI conditions, the construction of pseudo-ternary plots is considered to be a vital exercise (CitationCui et al., 2009). As indicated in , the stability of nanoemulsion was reduced after increasing the lipid to surfactant–cosurfactant mixture ratio beyond 4:6, which restricted the lowest amount of the surfactant to be added to the formulation. When Cremophor EL was employed alone, only a small amount of oil was able to solubilize the drug, and the major area was indicated by the microemulsion gel region, an undesirable trait for the self-emulsifying formulations. Amount of cosurfactant was restricted, as the excess of cosurfactants usually account for phase separation. The highest nanoemulsion region was observed with Cremophor EL:Transcutol HP ratio of 2:1. Marginal reduction in the nanoemulsion region was noted when the ratio was increased to 3:1. Hence, it could be inferred that Cremophor EL and Transcutol HP should be used as a blend of solvents, but in a ratio greater than 2:1 for higher nanoemulsion region and stability.
All the formulations, prepared as per the experimental design, exhibited nano globule size ranging between 46–475 nm, which is considered ideal for a low emulsification time and enhanced micellar absorption (CitationPorter et al., 2007; CitationNielsen et al., 2008).
Response surface analysis of Q5min () revealed that a reduced release rate was observed at higher concentrations of both Cremophor EL and Transcutol HP. Also, it can be discerned from the plots that higher values of Q5min are observed at low-to-intermediate concentrations of Cremophor EL and high concentrations of Transcutol HP.
The diminution in particle size of SNEDDS on increasing the concentration of Cremophor, as observed in , is in consonance with literature, where an improved emulsion stability construed by a reduction in emulsion droplet size has been observed at higher levels of surfactant (CitationKommuru et al., 2001).
Emulsification time is known to be a vital parameter in describing the self-emulsifying characteristics of SEDDS (CitationWei et al., 2005). As depicted in , a modest increase in emulsification time observed at a higher level of Cremophor EL and lower level of Transcutol HP unequivocally indicates the presence of an interaction between the excipients.
Selection of the optimized formulation was based upon “trading off” of various response variables, i.e. minimization of particle size (necessary for micellar absorption via lymphatic route), MDT (necessary for quick onset of action), emulsification time (for system stability and proper emulsification in the gastric milieu), and maximization of Q5min (necessary to ensure complete drug release). The linearity of the correlation plots between predicted and observed responses, and the nearly uniform and random scatter of the corresponding residual plots, indicate high prognostic ability of the postulated model (p < 0.001).
As portrayed in , there was a marked improvement in the drug release profile in case of formulations, VAL7 and VAL6, as compared to marketed formulation, Carloc™. Complete release of drug was observed within 20 min in the case of VAL7, while only 67% and 77% of the drug was released in the same period in the case of pure drug and marketed formulation, respectively. This significant decrease in dissolution time in VAL7 is quite indicative of higher bioavailability potential of carvedilol, BCS class II drug, exhibiting dissolution-limited absorption.
As shown in , VAL7 showed nearly 80%, 79%, and 400% increase in intrinsic, effective, and wall permeability, respectively, during SPIP studies in rat. Also, the VAL6 formulation exhibited nearly 59%, 59%, and 354% increase in intrinsic, effective, and wall permeability, respectively. This improvement in permeability may be ascribed to the high concentration of surfactant present in the formulations. Similar results on increased intestinal permeability of candesartan cilexetil on increasing the concentration of surfactant have been reported in the literature (Gao et al., 2010). Marked enhancement in the values of absorption number and fraction absorbed was observed in the case of the VAL7 as compared to that of the VAL6, pure drug, and the marketed formulation (. The percent increase in absorption number in the case of VAL7 was significantly higher than that observed with VAL6 (i.e. 393%) and the marketed formulation (i.e. 53%). Increase in the bioavailable fraction in the case of VAL7 was 86% as compared to 80% of VAL6 and 21% of the marketed formulation. The overall results indicated VAL7 to be superior to VAL6 and much better than the marketed formulation in enhancing drug permeability and absorptivity. Thus, the in situ animal studies corroborate the supremacy of VAL7 over the marketed brand in bioavailability enhancement of carvedilol.
The TEM image ( unambiguously reveals that most of the emulsion droplets were below 100 nm in the case of VAL7, indicating the successful formation of SNEDDS. Images of oil droplets clearly portray drug entrapped within oil globules.
No significant change in the values of Q5min, emulsification time, and drug release profile during storage of the optimized formulations under accelerated stability conditions, for 6 months, vouch for the high robustness of the formulations, even under stressful conditions of temperature and humidity.
Conclusions
The present studies aimed at formulating SNEDDS of carvedilol, a highly promising cardiovascular drug, for potential enhancement of its oral bioavailability by improving its dissolution and intestinal permeation. Systematic studies using DoE helped in balancing the diverse response parameters viz particle size, drug release characteristics, metabolism by CYT P450 in enterocytes and hepatocytes, restricted intestinal permeability, and/or P-gp efflux of the formulation using blends of Capmul PG8, Cremophor EL, and Trancutol HP. The choice of experimental design, i.e. a 2-factor CCD was found to be highly appropriate, as it could detect non-linearity in the factor–response relationship with minimal expenditure of developmental effort and time. During SPIP studies, the optimized SNEDDS formulation exhibited 3–4 fold improvement in bioavailable fraction, absorption number and wall permeability of carvedilol as compared to pure drug and marketed formulation. This can be rationally attributed to the successful transport of the drug from the self-emulsifying formulation through the lymphatic pathways. This confirms the successful transport of the drug through the lymphatic pathways on being formulated as SNEDDS. In a nutshell, the studies could be judiciously extrapolated to develop suitable platform technology(ies) for augmenting the oral bioavailability of BCS class II and IV drugs.
Acknowledgments
The authors are thankful to M/s Ranbaxy Research Labs, Gurgaon, India for providing the gift sample of carvedilol. M/s Colorcon Asia Pvt. Ltd., Mumbai, India; M/s Abitec, New Jersey, USA; Nikko Chemicals Co. Ltd., Tokyo, Japan; M/s Gattefosse, San-Priest, France, and M/s Associated Capsules, Mumbai, India are accredited for the ex gratis samples of excipients employed during the current studies.
Declaration of Interest
Financial grants obtained from the All Indian Council of Technical Education (AICTE, New Delhi, India); 8023/BOR/RID/RPS-156/2008-09 are gratefully acknowledged.
References
- Arsenault, W.G., Boothe, D.M., Gordon, S.G., Miller, M.W., Chalkley, J.R., Petrikovics, I. (2005). Pharmacokinetics of carvedilol after intravenous and oral administration in conscious healthy dogs. American J Vet Res. 66:2172–6.
- Bogaard, H.J., Natarajan, R., Mizuno, S., Abbate, A., Chang, P.J., Chau, V.Q., Hoke, N.N., Kraskauskas, D., Kasper, M., Salloum, F.N., Voelkel, N.F. (2010). Adrenergic receptor blockade reverses right heart remodeling and dysfunction in pulmonary hypertensive rats. Am J Respir Crit Care Med. 182:652–60.
- Charman, S.A., Charman, W.N., Rogge, M.C., Wilson, T.D., Dutko, F.J., Pouton, C.W. (1992). Self-emulsifying drug delivery systems: formulation and biopharmaceutic evaluation of an investigational lipophilic compound. Pharm Res. 9:87–93.
- Constantinides, P.P., Wasan, K.M. (2007). Lipid formulation strategies for enhancing intestinal transport and absorption of P-glycoprotein (P-gp) substrate drugs: In vitro/in vivo case studies. J Pharm Sci. 96:235–48.
- Craig, D.Q.M., Barker, S.A., Banning, D., Booth, S.W. (1995). An investigation into the mechanisms of self-emulsification using particle size analysis and low frequency dielectric spectroscopy. Int J Pharm. 114:103–10.
- Cui, S.X., Nie, S.F., Li, L., Wang, C.G., Pan, W.S., Sun, J.P. (2009). Preparation and evaluation of self-microemulsifying drug delivery system containing vinpocetine. Drug Dev Ind Pharm. 35:603–11.
- de Smidt, P.C., Campanero, M.A., Troconiz, I.F. (2004). Intestinal absorption of penclomedine from lipid vehicles in the conscious rat: contribution of emulsification versus digestibility. Int J Pharm. 270:109–18.
- Elnaggar, Y.S., El-Massik, M.A., Abdallah, O.Y. (2009). Self-nanoemulsifying drug delivery systems of tamoxifen citrate: Design and optimization. Int J Pharm. 380:133–41.
- Gao, F., Zhang, Z., Bu, H., Huang, Y., Gao, Z., Shen, J., Zhao, C., Li, Y. (2011). Nanoemulsion improves the oral absorption of candesartan cilexetil in rats: Performance and mechanism. J Control Release. 149:168–74.
- Gupta, H., Bhandari, D., Sharma, A. (2009). Recent trends in oral drug delivery: A review. Recent Pat Drug Deliv Formul. 3:162–73.
- Hauss, D.J. (2007). Oral lipid-based formulations: Enhancing the bioavailability of poorly water-soluble drugs, drugs and the pharmaceutical sciences. 1st ed. Vol 170. New York: Informa Healthcare USA, Inc.
- Ho, Y.F., Lai, M.Y., Yu, H.Y., Huang, D.K., Hsueh, W.C., Tsai, T.H., Lin, C.C. (2008). Application of rat in situ single-pass intestinal perfusion in the evaluation of presystemic extraction of indinavir under different perfusion rates. J Formos Med Assoc. 107:37–45.
- Hokama, N., Hobara, N., Kameya, H., Ohshiro, S., Sakanashi, M. (1999). Rapid and simple micro-determination of carvedilol in rat plasma by high-performance liquid chromatography. J Chromatogr B Biomed Sci Appl. 732:233–8.
- http://www.ich.org/cache/compo/363-272-1.html, accessed 12 December 2010.
- http://www.ich.org/fileadmin/Public_Web_Site/ICH_Products/Guidelines/Quality/Q1A_R2/Step4/Q1A_R2_Guideline.pdf, accessed 25 December 2010.
- http://www.reportlinker.com/p0189377/Innovations-in-Oral-Solid-Drug-Delivery-Advances-in-nanotechnology-controlled-formulations-peptide-delivery.html, accessed 24 December 2010.
- http://www.who.int/topics/cardiovascular_diseases/en/, accessed 20 December 2010.
- Humberstone, A.J., Charman, W.N. (1997). Lipid-based vehicles for the oral delivery of poorly water soluble drugs. Adv Drug Deliv Rev. 25:103–28.
- Joshi, M., Pathak, S., Sharma, S., Patravale, V. (2008). Solid microemulsion preconcentrate (NanOsorb) of artemether for effective treatment of malaria. Int J Pharm. 362:172–8.
- Koga, K., Kusawake, Y., Ito, Y., Sugioka, N., Shibata, N., Takada, K. (2006). Enhancing mechanism of Labrasol on intestinal membrane permeability of the hydrophilic drug gentamicin sulfate. Eur J Pharm Biopharm. 64:82–91.
- Kommuru, T.R., Gurley, B., Khan, M.A., Reddy, I.K. (2001). Self-emulsifying drug delivery systems (SEDDS) of coenzyme Q10: Formulation development and bioavailability assessment. Int J Pharm. 212:233–46.
- Laia, C.A.T., López-Cornejo, P., Costa, S.M.B., d’Oliveira, J., Martinho, J.M.G. (1998). Dynamic light scattering study of AOT microemulsions with nonaqueous polar additives in an oil continuous phase. Langmuir. 14:3531–7.
- Morgan, T. (1994). Clinical pharmacokinetics and pharmacodynamics of carvedilol. Clin Pharmacokinet. 26:335–46.
- Nielsen, F.S., Petersen, K.B., Müllertz, A. (2008). Bioavailability of probucol from lipid and surfactant based formulations in minipigs: influence of droplet size and dietary state. Eur J Pharm Biopharm. 69:553–62.
- Patel, M., Tekade, A., Gattani, S., Surana, S. (2008). Solubility enhancement of lovastatin by modified locust bean gum using solid dispersion techniques. AAPS PharmSciTech. 9:1262–9.
- Porter, C.J., Charman, W.N. (2001). Intestinal lymphatic drug transport: An update. Adv Drug Deliv Rev. 50:61–80.
- Porter, C.J.H., Trevaskis, N.L., Charman, W.N. (2007). Lipids and lipid-based formulations: Optimizing the oral delivery of lipophilic drugs. Nat Rev Drug Discov. 6:231–48.
- Pouton, C.W., Porter, C.J. (2008). Formulation of lipid-based delivery systems for oral administration: materials, methods and strategies. Adv Drug Deliv Rev. 60:625–37.
- Sha, X., Yan, G., Wu, Y., Li, J., Fang, X. (2005). Effect of self-microemulsifying drug delivery systems containing Labrasol on tight junctions in Caco-2 cells. Eur J Pharm Sci. 24:477–86.
- Shafiq-un-Nabi, S., Shakeel, F., Talegaonkar, S., Ali, J., Baboota, S., Ahuja, A., Khar, R.K., Ali, M. (2007). Formulation development and optimization using nanoemulsion technique: A technical note. AAPS PharmSciTech 8:E1–E6
- Singh, B., Ahuja, N. (2002). Development of controlled-release buccoadhesive hydrophilic matrices of diltiazem hydrochloride: Optimization of bioadhesion, dissolution, and diffusion parameters. Drug Dev Ind Pharm. 28:431–42.
- Singh, B., Bandopadhyay, S., Kapil, R., Singh, R., Katare, O. (2009b). Self-emulsifying drug delivery systems (SEDDS): Formulation development, characterization, and applications. Crit Rev Ther Drug Carrier Syst. 26:427–521.
- Singh, B., Bandyopadhyay, S., Katare, O.P. (2009a). Book review on “Oral Lipid-Based Formulations: Enhancing the Bioavailability of Poorly Water-Soluble Drugs”. Drug Deliv. 16:125–6.
- Singh, B., Chakkal, S.K., Ahuja, N. (2006). Formulation and optimization of controlled release mucoadhesive tablets of atenolol using response surface methodology. AAPS PharmSciTech. 7:E3.
- Singh, B., Dahiya, M., Saharan, V., Ahuja, N. (2005b). Optimizing drug delivery systems using systematic “design of experiments.” Part II: Retrospect and prospects. Crit Rev Ther Drug Carrier Syst. 22:215–94.
- Singh, B., Kaur, T., Singh, S. (1997). Correction of raw dissolution data for loss of drug during sampling. Indian J Pharm Sci. 59:196–9.
- Singh, B., Kumar, R., Ahuja, N. (2005a). Optimizing drug delivery systems using systematic “design of experiments.” Part I: Fundamental aspects. Crit Rev Ther Drug Carrier Syst. 22:27–105.
- Singh, B., Singh, S. (1998). A Comprehensive computer program for study of drug release kinetics from compressed matrices. Indian J Pharm Sci. 60:313–6.
- Spernath, A., Aserin, A. (2006). Microemulsions as carriers for drugs and nutraceuticals. Adv Colloid Interface Sci. 128–130, 47–64.
- Thi, T.D., Van Speybroeck, M., Barillaro, V., Martens, J., Annaert, P., Augustijns, P., Van Humbeeck, J., Vermant, J., Van den Mooter, G. (2009). Formulate-ability of ten compounds with different physicochemical profiles in SMEDDS. Eur J Pharm Sci. 38:479–88.
- VCCLAB VCCL. (2005). Available online at: http://www.vcclab.org, accessed 22 December 2010.
- Vogt, M., Kunath, K., Dressman, J.B. (2008). Dissolution enhancement of fenofibrate by micronization, cogrinding and spray-drying: comparison with commercial preparations. Eur J Pharm Biopharm 68:283–8.
- von Mollendorff, E., Reiff, K., Neugebauer, G. (1987). Pharmacokinetics and bioavailability of carvedilol, a vasodilating beta-blocker. Eur J Clin Pharmacol. 33:511–3.
- Wei, L., Sun, P., Nie, S., Pan, W. (2005). Preparation and evaluation of SEDDS and SMEDDS containing carvedilol. Drug Dev Ind Pharm. 31:785–94.
- Wen, H., Jiang, H., Lu, Z., Hu, X., He, B., Tang, Q., Huang, C. (2010). Carvedilol ameliorates sympathetic nerve sprouting and electrical remodeling after myocardial infarction in rats. Biomed Pharmacother. 64:446–50.
- Yao, J., Lu, Y., Zhou, J.P. (2008). Preparation of nobiletin in self-microemulsifying systems and its intestinal permeability in rats. J Pharm Pharm Sci. 11:22–9.
- Yavuz, B., Bilensoy, E., Vural, I., Sumnu, M. (2010). Alternative oral exemestane formulation: improved dissolution and permeation. Int J Pharm. 398:137–45.

