
Abstract
Novel LNCs (lipid nanocrystals) were developed with an aim to improve the solubility, stability and targeting efficiency of the model drug glibenclamide (GLB). PEG 20000, Tween 80 and soybean lecithin were used as polymer, surfactant and complexing agent, respectively. GLB nanocrystals (NCs) were prepared by precipitation process and complexed using hot and cold melt technique. The LNCs were evaluated by drug loading, saturation solubility (SL), optical clarity, in vitro dissolution, solid state characterization, in vivo and stability analysis. LNCs exhibited a threefold increase in SL and a higher dissolution rate than GLB. The percentage dissolution efficiency was found to decrease with increase in PEG 20000. The average particle size was in the range of 155–842 nm and zeta potential values tend to increase after complexation. X-ray powder diffractometry and differential scanning calorimetry results proved the crystallinity prevailed in the samples. Spherical shaped particles (<1000 nm) with a lipid coat on the surface were observed in scanning electron microscopy analysis. Fourier transform infrared results proved the absence of interaction between drug and polymer and stability study findings proved that LNCs were stable. In vivo study findings showed a decrease in drug concentration to pancreas in male Wistar rats. It can be concluded that LNCs are could offer enhanced solubility, dissolution rate and stability for poorly water soluble drugs. The targeting efficiency of LNCs was decreased and further membrane permeability studies ought to be carried out.
Introduction
Type II diabetes is a chronic metabolic disorder that results from defects in both insulin secretion and its action. Its treatment requires the use of drug delivery systems or devices that facilitate improved blood glucose management (Jain & Saraf, Citation2010; Shaik & Bilal, Citation2012; Silke et al., Citation2012). Novel drug delivery systems could be utilized to control or manage such chronic illness, as they might deliver the drug by a different route, prolong the therapeutic effect and provide a unique dosage regimen (Alkermes, Citation2012). This could eventually lead to customize plasma profiles, enhanced bioavailability and improved patient compliance (Kumari et al., Citation2010).
Strategies to achieve improved bioavailability involve enhancing the aqueous solubility, surface property and permeability of active ingredient (Wang et al., Citation2008). Enhanced solubility and permeability results in better absorption of drug in the gastrointestinal (GI) tract reduced dosage-level requirements and improved bioavailability (Melgardt & Porang, Citation2009). Various techniques to improve solubility include particle engineering, salt selection and amorphization of the compound (Gülsün et al., Citation2009). In addition, use of surface-active agents or cosolvents, polymeric stabilizers to achieve supersaturation, solid dispersions and solutions are also possible methods to enhance solubility of a drug (Elkordy et al., Citation2012; Tom & Max, Citation2012).
Among the various strategies, nanocrystals (NCs) have emerged as one of the promising techniques to improve drug solubility and dissolution. They are generally prepared by top down (nanonization or nanosizing) or bottom up approach (precipitation) (Müller et al., Citation2001; Junghanns & Müller, Citation2008). Top-down technology can be applied by homogenization or milling by using pearl, bead or ball mills (Gülsün et al., Citation2009; Salazar et al., Citation2012). In precipitation method, drug is dissolved in a solvent and subsequently added to a non-solvent, leading to precipitation of finely dispersed drug crystals (Gassmann & List, Citation1994; Junghanns & Müller, Citation2008; Gülsün et al., Citation2009).
The above physical modification techniques reduce the particle size and increase the surface area to volume ratio of drugs (Faris & Müller, Citation2002). According to Noyes Whitney and Ostwald-Freundlich principles, particle size reduced to submicron range of NCs can greatly influence the dissolution rate and saturation solubility (SL) due to increase in effective particle surface area, and further enhance bioavailability (Patravale et al., Citation2004; Kesisoglou et al., Citation2007).
NCs are 100% drug with no carriers and possess major limitations like instability (both in vitro and in vivo) and crystal growth (aggregation) on contact with fluids or electrolytes, and loss in its functional properties (Mohanraj & Chen, Citation2008; Dufort et al., Citation2012). A strategy to overcome the limitations is to enhance the surface properties of NCs by attaching ligands to them or by increasing its stealthiness (Chen et al., Citation2011; Zheng et al., Citation2012). This approach could decrease particle aggregation, improve in vivo stability and could provide a more complete and consistent absorption similar to solid lipid nanoparticles (SLN) (Müller et al., Citation2001; Wu et al., Citation2011). Recently, solid lipid NCs (SLNCs) are widely explored to enhance the stability, targetability and bioavailability of a drug (Göppert & Müller, Citation2005). They are colloidal carriers containing crystalline particles with solid lipid coat on the surface (Subedi et al., Citation2009). SLNCs are produced by various techniques and are alternate to polymeric nanoparticles and can be applied by various routes (Uner & Yener, Citation2007).
Glibenclamide (GLB) is a second-generation oral hypoglycemic agent (BCS Class II drug), with high permeability, low aqueous solubility (∼38 μmol L−1 at 37 °C) and poor dissolution rate (Coppack et al., Citation1990; Yu et al., Citation2011). GLB is also a drug of choice for long-term therapy for diabetes mellitus and it requires a rapid GI absorption, to prevent a sudden increase in the blood glucose level after food intake (Dora et al., Citation2010; Manimaran & Damodaran, Citation2010). GLB inhibits ATP-dependant potassium channels in pancreatic beta cells and causes cell membrane depolarization. This opens voltage-dependent calcium channels thereby stimulating insulin release from beta cells (Elbary et al., Citation2011).
The objective of the present study is to formulate GLB NCs by precipitation technique using PEG 20000 and complexed using soybean lecithin (LEC). LNCs were evaluated by drug loading (DL), SL, in vitro dissolution, photon correlation spectroscopy, differential scanning calorimetry (DSC), X-ray powder diffractometry (XRPD), scanning electron microscopy (SEM) and Fourier transform infrared (FT-IR) spectroscopy and stability analysis. Finally, in vivo studies were performed to analyze the drug targeting efficiency of LNCs to pancreas of rat.
Materials and methods
Materials
GLB sample was obtained from S.D Biomed, Malaysia. PEG 20000 and soybean LEC were procured from Sigma Aldrich, Malaysia. Acetone, Tween® 80, sodium dodecyl sulfate (SDS), polysorbate 80, dichloromethane and methanol were purchased from R and M Chemicals, Malaysia. Deionized water was obtained from Millipore, MilliQ-Plus (Billerica, MA). All the other solvents and reagents used were of Anala R grade.
Preparation of GLB-PEG NCs
GLB was dissolved in 10 ml of solvent mixture containing acetone and methanol (2:1). PEG 20000 at different drug-polymer ratio (1:1, 1:2, 1:4, 1:8 and 2:1) was added to the drug solution and stirred using a magnetic stirrer (Erla-EMS H 7000, Selangor, Malaysia) at a temperature not exceeding 60 °C. The drug-polymer solution was injected slowly (1 ml/min) into an aqueous phase containing 60 ml of Tween 80 (3% w/v) with magnetic stirring at 400 rpm to precipitate the NCs. The volume of dispersion was adjusted to 100 ml using double distilled water and stirring was continued for 4 h at room temperature. Then, the solution was heated (65 °C) with magnetic stirring for 45 min to remove the organic solvent. The contents were centrifuged (Heraeus – Labofuge 200, Langenselbold, Germany) at 5000 rpm for 20 min to separate the NCs. The clear supernatant liquid was decanted; the thick viscous dispersion was collected and further redispersed in 15 ml of distilled water and recentrifuged (Hitachi – CT15E, Taiwan) at 20 000 rpm for 10 min to remove the impurities and the residual surfactants. The precipitated NCs were recovered using a vacuum filter (Kontes-Ultraware, Vineland, NJ, USA 0.2 µm) and dried in a hot air oven (Memmert – UF110, Germany) at 35 °C for 20 min. The procedure was repeated with different drugs: polymer ratio to formulate various batches and were coded as F1, F2, F3, F4 and F5.
Complexation of GLB-PEG NCs
Dried NCs (50 mg) were accurately weighed and dispersed in 50 ml of phosphate buffer (pH 7.4) in presence of Tween 80 (0.1% w/v) by gentle stirring for 10 min. Soybean LEC (2% w/v) in chloroform was gradually added (2 ml/min) to the above dispersion. The mixture was continuously stirred (Erla-EMS H 7000) at 250 rpm for 30 min. During the process of stirring, the temperature of the dispersion was maintained above the melting point of soybean LEC (−25 °C). Furthermore, the dispersion was transferred to a shaking incubator (Daiki Scientific – DK-SI 010, Korea) and shaken at 120 rpm for 1 h at 15 °C. Mannitol (5% w/v) as cryoprotectant was added to the dispersion and continued shaking for 10 min prior to lyophilization.
Freeze drying
The milky homogenous dispersion (GLB-PEG-LEC NCs) was subjected to freeze drying in a freeze dryer (Thermo Scientific, Asheville, NC, USA), with an inbuilt Pirani 501 microprocessor. The samples were lyophilized at a slow freezing temperature (shelf temperature −40 °C at 6 Torr and 10−1 m bar pressure) for 10 h. The lyophilized products were stored in borosilicate glass vials and placed in a dessicator at room temperature until further use.
Physicochemical characterization
Drug loading and process yield
Dried LNCs (50 mg) were accurately weighed and dissolved in 10 ml of methanol and vortexed for 5 min in a tube mixer (VTX 3000 L, LMS, China). The solution was filtered using a disc filter (0.45 µm, Titan 2 Nylon, Rockwood, TN, USA) and the absorbances were measured at 221 nm against a blank using UV–visible spectrophotometer (Beckman coulter, DU-800, USA). The procedure was carried in triplicate for all samples (n = 3). The process yield (PY) and percentage DL were calculated using the formula
Saturation solubility
Freeze-dried LNCs (1 g) were added to 10 ml of distilled water and stirred at 125 rpm in an orbital shaker (Erla-ES 203D, Korea) for 24 h at room temperature to ensure saturation. The content of the liquid was filtered using a disc filter (0.45 µm, Titan 2 Nylon, USA) and diluted suitably using phosphate buffer (pH 7.4). The samples were analyzed in a UV–visible spectrophotometer against a blank. The procedure was carried out in triplicate.
Optical clarity
An amount of LNCs equivalent to 5 mg of GLB was dispersed in 100 ml of phosphate buffer (pH 7.4) and mixed well in a measuring cylinder. The samples were withdrawn at periodic time intervals (0–240 min) and absorbance was measured in a UV–Visible spectrophotometer. The procedure was carried out in triplicate.
In vitro dissolution studies
Dissolution studies from GLB and LNCs were determined using a USP XXIII, 8-station rotating paddle apparatus (Electrolab-TDT 067, Mumbai, India) with a speed of 75 rpm (±1) and at a temperature of 37 ± 0.5 °C. Five hundred milliliters of phosphate buffer (pH 7.4) were used as the dissolution medium. NC equivalent to 5 mg of drug were added to the dissolution media. Three milliliters of samples were withdrawn at specified time intervals, replaced with equal volume of fresh phosphate buffer, filtered using disc filter (0.45 µm, Titan 2 Nylon, USA) and then analyzed using UV–visible spectrophotometer (Beckman coulter, DU-800, Brea, CA, USA) against a blank at 221 nm. The content of GLB was calculated from the standard curve [OD = 0.0202 × concentration − 0.008] (r2 = 0.999). The procedure was carried out in triplicate.
Dissolution data treatment (% DE and MDT)
Dissolution parameters such as percentage dissolution efficiency and mean dissolution time (MDT) were used to further characterize the drug release profiles. DE, defined as the area under the dissolution curve up to a certain time “t”, is expressed as percentage of the area of the rectangle arising from 100% dissolution in the same time. The quantity of drug released at different time intervals (Qmin), % DE and MDT were calculated from the equation given below (Wei & Lacan, Citation2006)
where Y is the drug percent dissolved at time t
where j is the sample number, n is the number of dissolution sample times,
is the time at midpoint between tj and tj–1 (calculated with the expression (tj + tj–1)/2) and ΔMj is the additional amount of drug dissolved between tj and ti–1.
Solid state characterization
Photon correlation spectroscopy
The mean particle size and polydispersity index (PDI) were measured using Malvern Zetasizer Nano ZS (Malvern Instruments, Worcestershire, UK). Dried sample (2 mg) was dispersed in 150 ml of deionized water-containing Tween 80 (0.1% w/v) and SDS (0.015% w/v). The dispersion was sonicated in a bath sonicator (Power sonic 410, Lab Tech, Korea) and kept aside for 24 h prior to analysis. Four microliters of each suspension were diluted with 2 ml of deionized water and the samples were pipetted into a disposable polystyrene cuvette. The samples were measured for mean particle size and PDI at a fixed angle of 90° at a temperature of 25 °C after five runs. A refractive index of 1.616 and 1.300 was used for the drug and solvent, respectively.
Zeta potential measurement
The zeta potential (ZP) was measured using Malvern Zetasizer Nano ZS (M3-PALS, Malvern Instruments, UK). Samples were dispersed in deionized water and kept aside for 24 h and injected into a clear disposable zeta cell after suitable dilution. The zeta cell was checked for presence of air bubbles and if present was removed by tapping. The samples were measured for average ZP (mV) after three consecutive scans.
X-ray powder diffractometry
XRPD diffractograms of GLB, polymers, physical mixtures (1:1) and LNCs were recorded in X-ray diffractometer (Bruker AXS D8, Germany) with Anton Paar, TTK 450 temperature attachment, using Si (Li) PSD detector. The samples were placed in a glass sample holder and Cu ka radiation was generated at 30 mA and 40 kV. The samples were scanned from 3° to 70° 2θ with a step size of 0.02°.
Differential scanning calorimetry
DSC analysis of GLB, polymer, physical mixture of drug and polymer (1:1) and LNCs were analyzed in a DSC calorimeter (TA Instruments, Q200, New Castle, DE, USA), equipped with a liquid nitrogen cooling system. About 5 mg of samples were loaded to aluminum pan, crimped, sealed and further examined at a scanning rate of 10 °C/min from 15 °C to 200 °C under nitrogen atmosphere (flow rate 100 ml/min) in room temperature. High purity indium was used to calibrate the heat flow and heat capacity of the instruments.
FTIR analysis
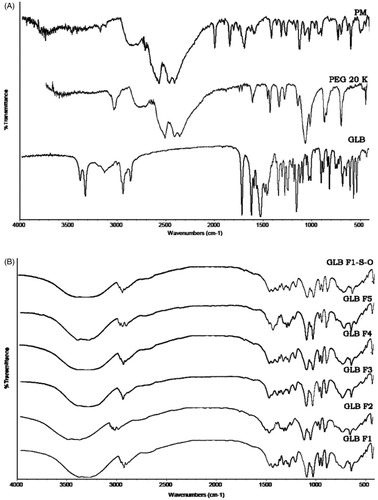
Spectra of GLB, PEG 20000, physical mixture (1:1) and LNCs were recorded in FT-IR spectrophotometer (Thermo Nicolet, Avatar 370, West Palm Beach, FL, USA). The samples were compressed into a pellet using KBr and scanned for 4 s at a resolution of 4 cm−1 from 4000 to 400 cm−1.
Scanning electron microscopy
Morphological evaluation of LNCs was performed using a scanning electron microscope (LEO 1530, Gemini, Germany). The samples were mounted to steel stubs (Jeol – 10 mm Dia × 5 mm) using a double-sided adhesive tape and sputtered with a thin layer of Au at 20 mA, under 1 × 10⁻¹ bar vacuum for 10 min using a sputter coater (EM S550X − Electron microscopy sciences) and was operated at an acceleration voltage of 3 kV.
In vivo studies
The study protocol was evaluated and approved by the Institute ethical committee (1410/C11/CPSCEA). The experiment was carried out as per the recommendations of CPSCEA guidelines, India. The in vivo studies were performed on optimized batch (F1) in order to evaluate the drug targeting efficiency to pancreas. Healthy male adult Wistar rat’s weighing 180–220 g were housed in large cages for 12 h light/12 h dark cycle throughout the experimental period. The animals were provided with rodent pellets and water ad libitum. The animals were divided into three groups, each group consisting of three rats.
LNCs were administered as single oral suspension to rats using oral gavage at a dose of 10 mg/kg. Rat was sacrificed with deep anesthesia and the pancreas was removed 1 h post administration. Pancreas was washed with saline and weighed accurately. Tissue homogenate was prepared at the concentration of 210 mg/ml in 1 × PBS. The homogenate was centrifuged at 3000 rpm for 15 min and the supernatant was collected and stored at −20 °C until analysis. To 1 ml of tissue homogenate, 2 ml of acetonitrile was added, mixed well and allowed to stand for 5 min. The content was centrifuged at 5000 rpm for 10 min and the clear supernatant was collected, stored at 4 °C until analysis. Twenty microliters of supernatant were used for HPLC analysis.
HPLC analysis
The amount of drug reaching the pancreas was quantitatively estimated using HPLC (LC-2010HT, Shimadzu, Japan). The chromatographic system consists of C18 Bonda Pack (5 µm, 150 × 4.6 mm D) column as the stationary phase and 0.1% orthosphosphoric acid:acetonitrile:methanol (20:50:30) as the mobile phase. The flow rate was adjusted to 1 ml/min and the injection volume was 20 μl. The analyte was detected at 210 nm using a UV detector and the retention time (RT) and peak area under curve (AUC) was observed for pure drug and test sample. The drug concentration was determined from the slope Y = 21385 ± 32437 (r2 = 0.989).
Statistical analysis
Statistical significance was analyzed by one-way analysis of variance (ANOVA) for in vitro and in vivo studies. A post hoc Bonferroni test was applied to identify the significance of difference between the subgroups. Student’s t test was also applied to compare means between two groups for expressing the significance and the experimental data, and is expressed as mean ± SD. A value of p ≤ 0.05 as a significant level of difference was considered.
Results
Drug loading and process yield
shows the DL and PY of LNCs. The percentage drug content was in the range of 34–51% and PY was between 61% and 82%. These findings indicated the suitability of the method used for a formulation. The result shows that the DL efficiency was found to decrease with increase in concentration of PEG 20000.
Table 1. DL and PY of LNCs.
Saturation solubility and optical clarity
The SL and optical clarity (OC) of the samples are shown in and in , respectively. The SL was found to increase by threefold in all batches as compared with GLB. The OC was analyzed by measuring the absorbances of samples for a period of 240 min after suitable dilution and could be ranked as F4 > F1 > F5 > F2 > F3. Batches F4 and F1 were found to be less cloudy possessing high clarity () while Batches F2 and F3 were more cloudy due to presence of big crystalline particles which showed higher absorbance values than other samples because of higher scattering of incident light.
Figure 1. OC plot of LNCs.
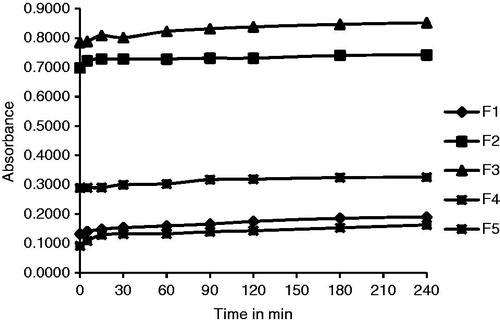
Table 2. SL data of GLB and LNCs.
In vitro dissolution studies
The dissolution profiles of GLB and LNCs are illustrated in . A higher dissolution was observed in LNCs than GLB. The onset of dissolution was identical in all batches. The drug dissolution could be ranked as F1 > F2 > F5 > F3 > F4 > GLB. Batch F1 showed a solubility of 99.89% in phosphate buffer (pH 7.4) at 240 min, while GLB attained only 31.87%. The LNCs showed an initial release (>30%) within 5 min as compared with GLB (<5%) and a stable and steady dissolution upto 240 min (). The dissolution parameters and quantity of drug released at specified time (Qmin) from LNCs are compared in . The amount of drug released at different time intervals (Q5min, Q10min, Q30min and Q60min) was found to be more in all formulations as compared with GLB. The % DE60min for batch F1 (80.39%) was more than GLB (21.09%), while the MDT was more for GLB (46.89 min) and less for batch F1 (11.51 min). Similarly, all the other batches also showed a lower MDT and a higher % DE in comparison with GLB (), and it may be due to effective size reduction of particles. These findings correlate with the in vitro dissolution results and based on these observations batch F1 was chosen as the ideal batch. The statistical result showed that the drug dissolution from LNCs was more effective as compared with GLB and a significant difference of p ≤ 0.05 was observed in all groups.
Figure 2. Dissolution profiles of LNCs compared with GLB. All data points represent the mean value (n = 3).
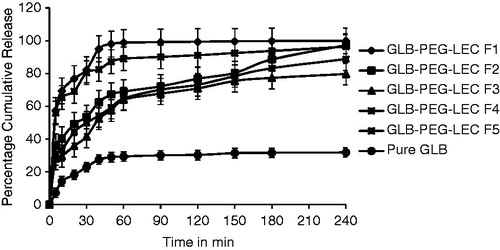
Table 3. Dissolution parameters of GLB and LNCs.
Photon correlation spectroscopy
The particle size analysis data for GLB and LNCs are shown in . The average particle size of GLB was 1551 nm, while that of LNCs were below 1000 nm. The mean particle size in LNCs was in the range of 155–842 nm. On comparing the different batches, F1 was found to have an average particle size of 155 nm, proving that a drug:polymer of 1:1 was optimum to develop LNCs.
Table 4. Particle size analysis data and ZP report of GLB and LNCs.
The PDI of LNCs (batches F1, F2 and F3) was found to be lower in comparison with GLB (0.417) and showed narrow distribution of particles. Batches F4 (0.431) and F5 (0.878) exhibited the highest particle size distribution indicating that the particles were highly polydisperse in nature. Based on these findings, it can be stated that batch F1 was found to be the ideal batch as it possessed small size particles and comparatively a lower PDI value. Also, a drug:polymer of 1:1 was ideal to develop a smaller particle size with a narrow size distribution.
Effect of zeta potential
The average ZP of GLB and LNCs was compared in . A ZP of −38.1 was observed for GLB. A high ZP was observed in all LNCs indicating an increase in stability as compared with GLB.
X-ray powder diffractometry
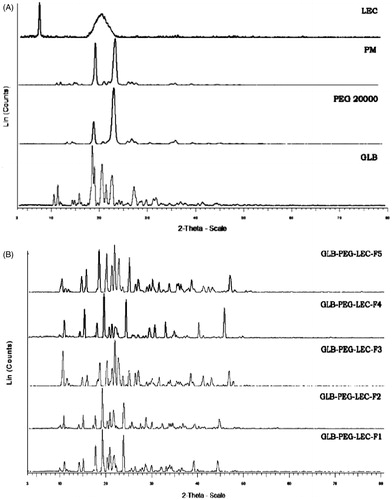
The diffraction spectra of GLB, PM (1:1) and LNCs were illustrated in and , respectively. Numerous sharp and narrow intense peaks at 2θ position 10.85°, 11.65°, 14.696°, 16.09°, 18.82°, 20.84°, 22.92°, 24.42°, 26.19°, 27.52°, 29.11° and 30.08° were observed in GLB spectra proving its high crystallinity. The XRPD spectra of PM showed less intense peaks with decrease in peak area. Numerous low intense, slightly broadened peaks with reduced sharpness and low peak area were observed in the spectra of all LNCs. These spectral changes may be attributed to the changes in crystal size of the samples. The XRPD spectra of all LNCs exhibited similar characteristic pattern as GLB at 11.66°, 20.82° and 30.08° 2θ positions indicating the drug still exist in crystalline form.
Figure 3. (A) X-ray diffraction spectra of GLB, PEG 20000, PM (1:1), and lecithin and (B) LNCs (F1–F5) at 2θ-scale.
Differential scanning calorimetry
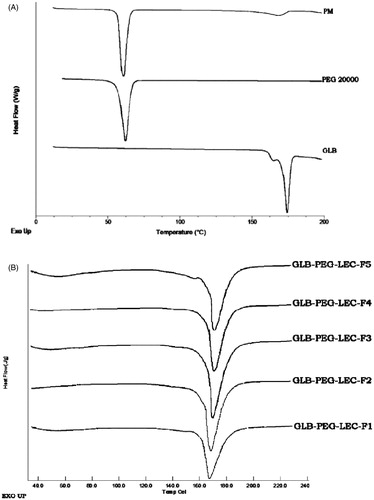
DSC thermograms of GLB, PEG 20000, PM (1:1) and LNCs were compared in and , respectively. A sharp endothermic peak at 173.36 °C (ΔH = 98.34 J/g) in the thermogram of GLB indicated its high crystallinity. An endothermic peak (65.24 °C) in PEG 20000 thermogram revealed its crystalline nature. Two endothermic peaks at 65.68 °C and 164.61 °C were observed in the thermogram of physical mixture (1:1) and it may be related to drug and the polymer (PEG 20000). These findings also prove the compatibility between drug and the polymer used in the formulation. The endothermic peak values of all LNCs were found to be between 166.8 °C and 168.4 °C with decrease in peak values as compared with GLB. The ΔH (J/g) was also found to slightly vary within the batches.
Figure 4. (A) DSC thermograms of GLB, PEG 20000 and PM-1:1 and (B) LNCs.
FT-IR analysis
FT-IR spectra of GLB, PEG 20000, PM (1:1) and LNCs were compared in and , respectively. GLB exhibited characteristic bands at 1715.55 cm−1 (carbonyl stretching), 1155.96 and 1306.29 cm−1 (symmetrical and asymmetrical sulfonyl stretching) and bands at 3315.74 and 3367.82 cm−1 (amide stretching). The presence of characteristic peaks of GLB in all LNCs proved the absence of interaction between drug and the polymer.
Figure 5. FTIR spectra of GLB, PEG 20000 and PM-1:1 (A) and LNCs (F1–F5) and stabilized formulation (GLB-F1-S-O) after three months of storage.
Stability testing
The ideal batch (F1) was subjected to stability analysis and the data were given in . The FT-IR spectra of batch F1 ( GLB F1 S-O) was found to possess the characteristic peaks of GLB and it clearly proves the chemical identity of GLB was preserved in the samples. There was no significant change in organoleptic characters and drug content in batch F1 after three months. All the above findings revealed that the formulation was stable.
Table 5. Stability analysis data of optimized NC (Batch F1).
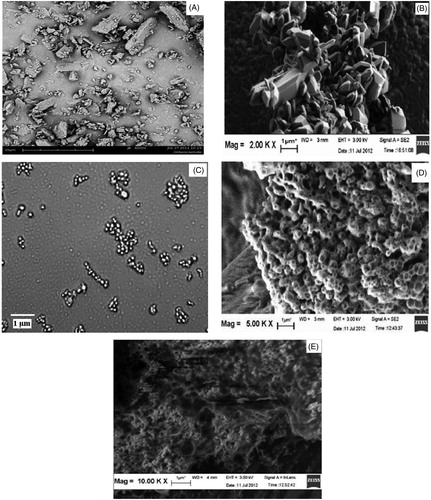
Surface characteristic analysis
The SEM images of GLB () showed numerous irregular-shaped particles of larger in size (>1.5 µm). The precipitated NCs () were polyhedron in shape, and were aggregated before complexation (). SEM images of LEC complexed NCs show numerous spherical-shaped particles below 1000 nm with a lipid coat onto the surface (). shows images of complexed NCs (batch F1) of reduced size after being dispersed in water and then air dried. These observations reveal a distinct difference in surface morphology of GLB and LNCs.
Figure 6. (A) SEM images of raw GLB, (B) non complexed F1 NCs, (C) aggregated NCs before complexation and after microscopical examination, (D) complexed F1 LNCs and (E) complexed F1 LNCs dispersed in water and air dried.
In vivo studies
The targeting efficiency of optimized NCs (F1) was analyzed by estimating the drug concentration in tissue homogenates of pancreas of rat. GLB showed a RT of 2.9 min, while the test sample (F1) was recognized at 2.7 min. There was no endogenous peak in the chromatograms interfering with GLB or with the internal standard. The GLB peaks were well separated from the internal standard. shows the concentration of drug available in pancreas after administration of GLB and the test sample. Analyzing the peak AUC of GLB and test formulation, it was observed that the concentration of drug in pancreas after 1 h was lower (12.6 µg/ml) in comparison with GLB (19.8 µg/ml). The statistical significance was tested by one-way ANOVA followed by student’s t-test and the results show that the targeting efficiency of LNCs was significantly different and lowered as in comparison with GLB.
Table 6. RT and peak area of GLB and test sample.
Discussions
GLB NCs were developed by precipitation technique with an aim to improve the solubility of the drug and complexed using soybean LEC (lipid) so as to enhance the stability, surface properties and targeting efficiency of NCs. This may perhaps facilitate the drug to reach the target site and could assist in secretion of more insulin. But development of NCs with such features is highly challenging as sufficient size reduction and stability (both in vitro and in vivo) ought to be achieved. Moreover, to deliver the drug safely and effectively at the target site (pancreas), the surface properties of the NCs should be enhanced. Such an approach may lead to a complex product and evaluation of its efficiency is quite troublesome. However, selection of excipients and technique in design may facilitate in development of a simple product with the necessary features.
A major problem in the development process was the stabilization of NCs. GLB NCs was found to be agglomerated during the process of milling. This was controlled by the addition of Tween 80 (3%w/v) during the precipitation process. The instability was also observed after dispersion of NCs in aqueous medium. These issues were overcome by complexation approach, i.e. the precipitated NCs were treated with soybean LEC to obtain LNCs. These lipid surfactants form a coat on the surface of NCs and provide a steric barrier between the NC and the dispersion medium thereby preventing its aggregation and increasing its stability (Müller et al., Citation2001). This approach may perhaps improve the therapeutic index and may aid the drugs to target the identified sites with minimum adverse effects by enhancing the circulation time in blood.
The method of preparation of LNCs plays a significant role in altering the surface properties of NCs. In the complexation process, soybean LEC was solubilized in chloroform and was added as hot melt gradually into the dispersion (GLB-PEG) and the mixture was heated below 60 °C with continuous stirring for 30 min. This step causes the expansion of organic phase and the drug tends to move outside from the core. The next stage involves the cooling process. On subsequent cooling at room temperature, the drug enters into the core and the system tends to form spherical particles. On continuous cooling and shaking at 15 °C for 1 h, the lipids get physically adsorbed on to the surface of NCs and get solidified as a thin layer of coat, or the NCs get entrapped within the core (GLB-PEG-LEC). One of the major difficulties encountered in this process was the removal of the organic solvent. The solvent (CHCl3) used in the complexation process was removed by continuous heating at 60 °C. The final formulation tends to be in a bulky form with LEC being adsorbed physically or chemically on the surface. In order to overcome particle growth and drug degradation during long term storage of the NCs, lyophilization was carried out in presence of a cryoprotectant (mannitol).
In the formulation development of LNCs, PEG 20000 was used as a polymer and Tween 80 as surfactant. It was observed that the DL efficiency and PY were found to increase at low polymer concentration. The concentration of Tween 80 (3% w/v) was maintained uniform throughout the batches with an intention to study the effect of PEG 20000 in the size reduction process. A drug:polymer of 1:1 was most suitable in development of stable and smaller size NCs. Increasing the concentration of PEG 20000 led to formation of polymorphic crystals of higher size and different shapes.
In order to evaluate the efficiency of LNCs, SL analysis was carried out. The SL was found to increase by threefold in all batches and this may be due to the creation of high energy surfaces when microparticles were disrupted into nanoparticles (Salazar et al., Citation2012). The SL also depends upon the crystallinity of the particles and exposure of lyophobic inner surfaces of the particles to the aqueous dispersion medium (Subedi et al., Citation2009).
To analyze the dipsersibility of LNCs OC studies were performed. This was to ensure that the processed LNCs remain as fine dispersions and was freely soluble. A low absorbance value should be obtained for clear solution, while higher absorbance values are expected for cloudier solution (Ito et al., Citation2008). Cloudier solutions have possibility to scatter more of incident radiation, resulting in a high absorbance proving the formulation is highly crystalline in nature (Kumari et al., Citation2010). In the study, batches F1 and F4 were less cloudy and crystalline compared with other batches, hence can exhibit high dipsersibility.
The size reduction of coarse particles could produce a higher rate of drug dissolution. Precipitated NCs with smaller size particles tend to get into solution form faster and produce a higher release (>80%) upon contact with medium within a short time. Dissolution studies on LNCs showed an initial release (>50%) within 5 min compared with GLB (7%) and a stable release upto 240 min. A slow dissolution from batches could be attributed to LEC coating and an increase in polymer concentration which would have resulted in a higher diffusional path length. It was observed that the drug dissolution from LNCs never reached completion, because PEG 20000 is a linear polymer and due to a possible complex formation of unknown nature (Tamara, Citation2005). A high dissolution could be attributed to the increased surface area and enhanced SL of LNCs.
In order to study the effectiveness of drug dissolution MDT and % DE was calculated. All the batches experienced a lower MDT and a higher % DE in comparison with GLB due to effective size reduction. The MDT of batch F1 was found to be less probably due to lower particle size.
In our observation complexation process improved the stability of LNCs by controlling its particle size and preventing its re-aggregation. These postulations were well supported from particle size and ZP findings, which indicated that the particle size was reduced and ZP values increased in all LNCs. Stability was attained due to the presence of high negative charge on the surface of NCs. This prevents the particles from aggregation, thus stabilizing the NCs (Müller et al., Citation2001). Soybean LEC was chosen for stabilization since it is a proven dispersant and surfactant, and is widely used in the complexation process (Salazar et al., Citation2012). Strong enthalpic interaction (good solvation) between the solvent and stabilizer induces steric repulsion and this factor would have also prevented the agglomeration (Wu et al., Citation2011).
The particle size and PDI were found to vary with respect to polymer concentration. A higher proportion of polymer led to the formation of higher size particles which leads to plasticization and formation of agglomerates (Kesisoglou et al., Citation2007). On the basis of these comparisons it can be stated that batch F1 was found to be the ideal batch in terms of smaller size particles and with a narrow size distribution. A high ZP was observed in all LNCs indicating an increase in stability as compared with GLB. The increase in stability may be attributed to the repulsive force associated with the LNCs and a reduction in particle agglomeration due to LEC coating (Kesisoglou et al., Citation2007; Uner & Yener, Citation2007).
Solid state characterization studies were performed on LNCs in an attempt to understand the change in drug properties after complexation. This could help in development of a stable formulation with the desired therapeutic effect. XRPD results showed that relative intensity values (d value) decreased initially and became constant in the latter stages proving that the crystallinity was still maintained and complexation. PEG 20000 and soybean LEC have negligible effect in altering the crystallinity of GLB. A shift in diffraction pattern was noticed at a longer end in 2θ scale, signifying a change in crystal size due to PEG 20000. The absence of interaction between drug and polymer was also observed in all LNCs as they exhibited a similar characteristic diffraction pattern as that of GLB at 11.66°, 20.82° and 30.08° 2θ positions (Rao et al., Citation2012).
In DSC analysis, the melting peak was shifted to a lower temperature in all LNCs and this could be attributed to some structural changes that would have occurred during the process of complexation and lyophilization () (Sonke & Albrecht, Citation2013). This observation clearly proves that crystallinity was maintained in all LNCs. The endothermic peak values were found to be between 167.1 °C and 168.4 °C and ΔH values were between 136 and 228 J/g after complexation in all batches. The variation in endothermic peak and ΔH value of LNCs supports the above suggestions. To establish the high solubility of LNCs, the degree of crystallinity was also analyzed. The degree of crystallinity of GLB was 99.7%, whereas that of LNCs was 87% (Bunjes & Unruh, Citation2007). These results demonstrate that LNCs are superior to GLB as they provide higher solubility. It is necessary to evaluate the stability of LNCs after storage in solid state at different temperature conditions. The results show no change in physical appearance and drug content during the period.
In this study, one of the objectives was to investigate the efficacy of LNCs in targeting drugs toward pancreas, as it may target and assist in secretion of more insulin. To achieve this objective, the particle size of coarse GLB was reduced by precipitation and the surface properties were improved by complexation. Complexation or coating could provide a higher circulation of NCs in blood, avoid clearance and facilitate higher cellular uptake of drug (Müller et al., Citation2011; Gao et al., Citation2012). This leads to the enhanced therapeutic effect and the drug can be targeted to the site.
In vivo results on optimized LNCs (F1) show a decrease in the amount of drug in pancreas of rat. The AUC was found to be lower compared with GLB after 1 h (). A decrease in AUC may be related to the in vivo properties of NCs. The in vivo properties strongly depend on particle size, shape, surface charge, dissolution rate and nature, and density of coating (Gao et al., Citation2012; Du et al., Citation2013). Considering the particle size, the optimized batch (F1) possessed an average particle size of 155 nm and a distribution of 0.310. The size intensity report (data not shown) of F1 LNCs shows a bimodal distribution of particles. The two major particle groups in batch F1 were 8 nm (79.5%) and 635 nm (20.5%). Such a wide distribution may have resulted in an unstable behavior in vivo resulting in a decreased uptake of NCs (Sun et al., Citation2012). This was evident in the pharmacokinetic parameters with large standard deviations (). This unusual result indicates that particle size and uniformity is crucial in NCs, because uneven NCs were not only invalid but also showed increased individual differences. Also, particles of size 155 nm are taken up by all cells by endocytosis and they are considered as high risk particles thereby decreasing the concentration of drug in site (Müller et al., Citation2011).
The shape of NCs also plays a significant role in targeting the drug. Cellular uptake is higher for rod shape particles of size larger than 100 nm, followed by spheres, cylinder and cubes (Albanese et al., Citation2012). Surface morphology analysis of LNCs () shows spherical shape particles of size greater than 155 nm. These LNCs possess less circulation in blood and thereby decrease the cellular uptake. The type of coating on the surface of LNCs may also affect cellular uptake and tissue targeting (Sun et al., Citation2012).
Nevertheless, few reports regarding absorption of NCs were published. A single layer of columnar epithelium cells covered the luminal surface and was interspersed with a variety of specialized cells such as enterocytes, goblet cells, endocrine cells and M-cells. The enterocytes and M-cells might play a significant role in the oral absorption of NCs (Fu et al., Citation2013). Further oral absorption mechanism studies have to be carried out to elucidate the unfavorable behavior in LNCs. Less adhesion to gut wall and decreased lipophilicity of NCs could also be a reason for decreased targetability (Gao et al., Citation2012).
Conclusion
LNCs were formulated in an attempt to improve the solubility, stability and targetability of GLB. The parameters that influence the formulation of LNCs was investigated and optimized. The dissolution behavior and stability of LNCs were superior as compared with GLB and it may be due to effective size reduction and complexation. A high SL and dissolution characteristics could significantly improve the bioavailability of the drug. A decrease in drug concentration in pancreas of rat was observed during in vivo studies. Drug targeting efficiency was found to be low after complexation and it may be attributed to non-uniform distribution of NCs. The study findings could lead to significant understanding of the problems associated with nanonization and stabilization. To conclude, the enhanced dissolution rate and SL could be useful in estimating the bioavailability, but these results do not reflect the actual in vivo performance of the drug. Furthermore, membrane permeability studies need to be performed to analyze the complete in vivo behavior of LNCs.
Declaration of interest
The authors report no conflicts of interest.
Acknowledgements
The authors would like to thank Faculty of Pharmacy and Faculty of Applied Sciences, AIMST University, Malaysia and SAIF-STIC, Cochin, India for their laboratory and instrumentation analysis support.
References
- Albanese A, Tang PS, Chan WC. (2012). The effect of nanoparticle size, shape, and surface chemistry on biological systems. Annu Rev Biomed Eng 14:1–16
- Alkermes. (2012). “Nanocrystal Technology” company information. Available from: http://www.alkermes.com/ContractServices/Technologies/Bioavailability-Enhancement_e.pdf [last accessed 13 Feb 2012]
- Bunjes H, Unruh T. (2007). Characterization of lipid nanoparticles by differential scanning calorimetry, X-ray and neutron scattering. Adv Drug Deliv Rev 59:379–402
- Chen H, Khemtong C, Yang X, et al. (2011). Nanonization strategies for poorly water soluble drugs. Drug Discov Today 16:354–60
- Coppack SW, Lant AF, McIntosh CS, et al. (1990). Pharmacokinetc and pharmacodynamic studies of glibenclamide in non-insulin dependent diabetes mellitus. Br J Pharm 29:673–84
- Dora CP, Singh SK, Kumar S, et al. (2010). Development and characterization of nanoparticles of glibencamide by solvent displacement method. Acta Pharma Drug Res 67:283–90
- Du B, Shen G, Wang D, et al. (2013). Development and characterization of glimepiride nanocrystal formulation and evaluation of its pharmacokinetic in rats. Drug Deliv 20:25–33
- Dufort S, Sancey L, Coll JL. (2012). Physico-chemical parameters that govern nanoparticles fate also dictate rules for their molecular evolution. Adv Drug Deliv Rev 64:179–89
- Elbary AA, Salem HF, Maher ME. (2011). In vitro and in vivo evaluation of glibenclamide using surface solid dispersion (SSD) approach. Brit J Pharmacol Toxicol 2:51–62
- Elkordy AA, Jatto A, Essa E. (2012). In situ controlled crystallization as a tool to improve the dissolution of Glibenclamide. Int J Pharm 428:118–20
- Faris NB, Müller RH. (2002). Nanocrystals for poorly soluble drugs for oral administration. Topics of PhD thesis and details on technologies, products, IP. New Drugs 2:20–1
- Fu Q, Sun J, Zhang D, et al. (2013). Nimodipine nanocrystals for oral bioavailability improvement: preparation, characterization and pharmacokinetic studies. Colloids Surf B Biointerfaces 109:161–6
- Gao L, Liu G, Ma J, et al. (2012). Drug nanocrystals: In vivo performances. J Control Release 160:418–30
- Gassmann P, List M. (1994). Hydrosols – alternatives for the parenteral application of poorly water soluble drugs. Eur J Pharm Biopharm 40:64–72
- Göppert TM, Müller RH. (2005). Adsorption kinetics of plasma proteins on solid lipid nanoparticles for drug targeting. Int J Pharm 302:172–86
- Gülsün T, Gürusoy RN, Öner L. (2009). Nanocrystal technology for oral delivery of poorly water soluble drugs. J Pharm Sci 34:55–65
- Ito F, Fujimori H, Honnami H, et al. (2008). Effect of polyethylene glycol on preparation of rifampicin-loaded PLGA microspheres with membrane emulsification technique. Colloids Surf B Biointerfaces 66:65–70
- Jain S, Saraf S. (2010). Type 2 diabetes mellitus – its global prevalence and therapeutic strategies. Diabetes Metab Syndrome: Clin Res Rev 4:48–56
- Junghanns JU, Müller RH. (2008). Nanocrystal technology drug delivery and clinical applications. Int J Nanomed 3:295–309
- Kesisoglou F, Panmai S, Wu Y. (2007). Nanosizing – oral formulation development and biopharmaceutical evaluation. Adv Drug Deliv Rev 59:631–44
- Kumari A, Yadav SK, Yadav SC. (2010). Biodegradable polymeric nanoparticles based drug delivery systems. Colloids Surf B Biointerfaces 75:1–18
- Manimaran V, Damodaran N. (2010). Enhancement of dissolution rate of glibenclamide by solid dispersion technology. Int J Curr Pharm Res 2:14–17
- Melgardt MD, Porang A. (2009). Nanotechnology in drug delivery. New York: AAPS Press/Springer, 581–90
- Mohanraj VJ, Chen Y. (2008). Nanoparticles – a review. Trop J Pharm Res 5:561–73
- Müller RH, Gohla S, Keck CM. (2011). State of the art of nanocrystals – special features, production, nanotoxicology aspects and intracellular delivery. Eur J Pharm Biopharm 78:1–9
- Müller RH, Jacobs C, Kayser O. (2001). Nanosuspensions as particulate drug formulations in therapy, rationale for development and what we can expect for the future. Adv Drug Deliver Rev 47:3–19
- Patravale VB, Date AA, Kulkarni RM. (2004). Nanosuspensions: a promising drug delivery strategy. J Pharm Pharmacol 56:827–40
- Rao S, Song Y, Peddie F, et al. (2012). Particle size reduction to the nanometer range a promising approach to improve buccal absorption of poorly water soluble drugs. Int J Nanomed 6:1245–51
- Salazar J, Ghanem A, Müller RH, et al. (2012). Nanocrystals: comparison of the size reduction effectiveness of a novel combinative method with conventional top-down approaches. Eur J Pharm Biopharm 1:1–9
- Shaik R, Bilal AT. (2012). Nanomedicine current trends in diabetes management. Nanomed Nanotech 3:1–7
- Silke K, Rutledge EB, Piero M. (2012). Nanomedicine for treatment of diabetes in aging population: state of the art and future developments. Nanomed Nanotech Bio Med 8:S69–76
- Sonke R, Albrecht S. (2013). Thermal degradation of amorphous glibenclamide. Eur J Pharm Biopharm 83:76–86
- Subedi RK, Kang KW, Choi HK. (2009). Preparation and characterization of solid lipid nanoparticles loaded with doxorubicin. Eur J Pharm Sci 37:508–13
- Sun J, Wang F, Sui Y, et al. (2012). Effect of particle size on solubility, dissolution rate, and oral bioavailability: evaluation using coenzyme Q10 as naked nanocrystals. Int J Nanomed 7:5733–44
- Tamara M. (2005). Soluble polymer conjugates for drug delivery. Drug Discov Today Tech 2:15–20
- Tom A, Max Z. (2012). Formulation technologies to overcome poor drug like properties. Drug Discov Today 9:e71–2
- Uner M, Yener G. (2007). Importance of solid lipid nanoparticles (SLN) in various administration routes and future perspectives. Int J Nanomed 2:289–300
- Wang AZ, Gu F, Zhang L, et al. (2008). Biofunctionalized targeted nanoparticles for therapeutic applications. Expert Opin Biol Ther 8:1063–70
- Wei H, Lacan RR. (2006). Biorelevant dissolution media as predictive tool for glyburide a class II drug. Eur J Pharm Sci 19:45–62
- Wu L, Zhang J, Watanabe W. (2011). Physical and chemical stability of nanoparticles. Adv Drug Deliv Rev 63:456–69
- Yu L, Li C, Le Y. (2011). Stabilized amorphous glibenclamide nanoparticles by high gravity technique. Mater Chem Phys 13:361–6
- Zheng N, Gao X, Song Q, et al. (2012). Lipid – based liquid crystalline nanoparticles as oral drug delivery vehicles for poorly water – soluble drugs: cellular interaction and in vivo absorption. Int J Nanomed 7:3703–18