
Abstract
The objectives of present studies were to develop the systematically optimized multiple-unit gastroretentive microballoons, i.e. hollow microspheres of itopride hydrochloride (ITH) employing quality by design (QbD)-based approach. Initially, the patient-centric QTPP and CQAs were earmarked, and preliminary studies were conducted to screen the suitable polymer, solvent, solvent ratio, pH and temperature conditions. Microspheres were prepared by non-aqueous solvent evaporation method employing Eudragit S-100. Risk assessment studies carried out by constructing Ishikawa cause-effect fish-bone diagram, and techniques like risk estimation matrix (REM) and failure mode effect analysis (FMEA) facilitated the selection of plausible factors affecting the drug product CQAs, i.e. percent yield, entrapment efficiency (EE) and percent buoyancy. A 33 Box–Behnken design (BBD) was employed for optimizing CMAs and CPPs selected during factor screening studies employing Taguchi design, i.e. drug–polymer ratio (X1), stirring temperature (X2) and stirring speed (X3). The hollow microspheres, as per BBD, were evaluated for EE, particle size and drug release characteristics. The optimum formulation was embarked upon using numerical desirability function yielding excellent floatation characteristics along with adequate drug release control. Drug-excipient compatibility studies employing FT-IR, DSC and powder XRD revealed absence of significant interaction among the formulation excipients. The SEM studies on the optimized formulation showed hollow and spherical nature of the prepared microspheres. In vivo X-ray imaging studies in rabbits confirmed the buoyant nature of the hollow microspheres for 8 h in the upper GI tract. In a nutshell, the current investigations report the successful development of gastroretentive floating microspheres for once-a-day administration of ITH.
Introduction
Since decades, oral intake has been considered as the most preferred route of drug administration owing to its numerous advantages including flexibility in formulation development and improved patient compliance (Gupta et al., Citation2009; Singh et al., Citation2012). Alleviating the chronic ailments, invariably calls for the development of oral controlled release (CR) products, especially for highly soluble and permeable BCS class I drugs. The major hiccups encountered during the development of the conventional CR systems is inability to retain and localize the drug delivery system (DDS) within the desired absorptive region of gastrointestinal (GI) tract, invariably resulting in inadequate extension in therapeutic response and incomplete drug absorption.
Gastroretentive drug delivery systems (GRDDS), in this regard, complement the oral CR formulations by continuously releasing the drug at a controlled rate for a prolonged period through the “drug absorption window” ensuring optimal extent of bioavailability too (Kotreka & Adeyeye, Citation2011; Pahwa et al., Citation2012). Among the numerous approaches used to improve the gastric residence time of DDS, the vital ones include, single and multiple-unit floating systems, bioadhesive systems, swelling and expanding systems, raft forming systems and high-density systems (Murphy et al., Citation2009). With a bulk density less than that of gastric fluids, a floating DDS remains buoyant in the stomach for a prolonged period of time without reducing the gastric emptying rate (Ichikawa et al., Citation1991). While the system floats on the gastric contents, the drug gets released slowly at the desired rate from the system, resulting in an increased gastroretention time and offers better control over the fluctuations in plasma drug levels (Kawashima et al., Citation1991). Multiple-unit floating systems have added advantages over the single-unit systems not only owing to their efficient drug release characteristics for extended periods of time, but also for reduced inter-subject and/or intra-subject variability in GI absorption (Pawar et al., Citation2010). Of late, the hollow microspheres, popularly termed as microballoons, have been increasingly employed for improvement in residence time of drug in the GI tract as well as its oral bioavailability (Sato et al., Citation2004a; Awasthi et al., Citation2012). With size less than 200 µm, these low-density non-effervescent microballoons have demonstrated sufficient buoyancy to retain drug in the gastric contents for prolonged periods of time (Sato et al., Citation2004b,Citationc).
Itopride Hydrochloride (ITH) is a prokinetic agent used for the treatment of functional dyspepsia and other GI disorders like gastric fullness, anorexia, upper abdominal pain, chronic gastritis and non-ulcer dyspepsia. It exhibits shorter half-life (i.e. <6 h) and narrow absorption window in the stomach and upper part of the small intestine, leading to incomplete drug absorption and faster drug elimination, eventually to sub-optimal plasma drug levels (Gupta et al., Citation2004). Owing to the inability of conventional CR formulations to accomplish desired drug release profile within the absorption window, it was planned to develop the GR microballoons of ITH for sustained release profile of drug delivery with improved therapeutic efficacy.
Development of GR systems involves a number of formulation and process variables like, type of polymer, concentration of polymer, selection of apt method of preparation, concentration of crosslinking agent and stirring speed (Singh et al., 2005a; Vora et al., Citation2013). Optimizing the formulation composition and the manufacturing process(es) of such DDS using traditional one-factor-at-a-time (OFAT) is a Herculean task, resulting in just workable solutions with expenditure of a great deal of time, money and effort (Singh et al., 2005b, Citation2013). Systematic optimization of DDS employing Quality by Design (QbD)-based approach of Formulation by Design (FbD), in this regard, has been lately practiced to provide comprehensive understanding of the formulation system by identifying plausible interaction(s) among the product and/or process-related factors to produce “the best” possible formulation under a given set of conditions with minimal experimentation and utilization of resources (Singh et al., Citation2011). FbD methodology involves defining the quality target product profile (QTPP), and critical quality attributes (CQAs), identification of critical material attributes (CMAs) and critical process parameters (CPPs) by screening and risk assessment, data analysis using design of experiments (DoE), modelization and optimum search through response surface methodology (RSM) to embark upon the design space and postulation of control strategy for continuous improvement (Lionberger et al., Citation2008). The FbD paradigm has yielded higher fruition in developing the optimized GRDDS of diverse kinds from our laboratories, including diltiazem (Singh & Ahuja, Citation2002), atenolol (Singh et al., Citation2006), hydralazine (Singh et al., Citation2009), tramadol (Singh et al., Citation2010), lamivudine (Singh et al., Citation2012) and rivastigmine (Kapil et al., Citation2012, Citation2013).
Attempts were, therefore, made to prepare the FbD-optimized GR floating microballoons of ITH using Eudragit S-100 as the release controlling polymer, and their subsequent in vitro evaluation for entrapment efficiency (EE), particle size, buoyancy and drug release characteristics, and in vivo evaluation of GR performance in rabbits through X-ray imaging.
Materials and methods
Materials
ITH was provided ex-gratis by M/s Cadila Pharmaceuticals Ltd, Jammu, India. Eudragit S-100 was received as a gift sample from M/s Evonik, Mumbai, India. High-density liquid paraffin (HLP) and petroleum ether were purchased from M/s Merck, Mumbai, India. All other chemicals, solvents and reagents used were of analytical grade and were used as obtained.
Methods
Defining the QTPP and CQAs
As the first step towards QbD-based product development for GR microballoons of ITH, the patient-centric QTPP was defined encompassing the summary of quality characteristics of the drug product to achieve prolonged release profile of drug delivery. In order to meet the QTPP, various quality attributes (QAs) were identified viz. EE (indicative of drug loading in the hollow microspheres), particle size (imperative for discerning the drug release and absorption potential through GI tract), percent drug release in 18 h (i.e. Q18h) and time required for 60% drug release (i.e. T60%) (marker of drug release from microballoons). Various elements of QTPP for development of GR floating microballoons of ITH have been summarized in , while enlists the respective justification(s) of selecting each CQA.
Table 1. Quality target product profile (QTPP) for GR hollow microballoons of ITH.
Table 2. Critical quality attributes (CQAs) for GR hollow microballoons of ITH and their justifications.
Initial risk assessment studies
The risk assessment studies were carried out to identify the CMAs and/or CPPs for GR microballoons plausibly affecting the CQAs of drug product. Ishikawa fish-bone diagram was constructed to establish the potential cause-effect relationship among the product and process variables employing Minitab 17 software (M/s Minitab Inc., Philadelphia, PA). Prioritization studies were carried out for selecting the CMAs/CPPs with high risk by constructing the Risk Estimation Matrix (REM) for qualitative analysis of risk by assigning low, medium and high-risk(s) levels to the each material attribute (MA) and/or process parameter (PP) (Fahmy et al., Citation2012; Vora et al., Citation2013). Further, the Failure Mode and Effect Analysis (FMEA) was carried out for quantitative estimation of risk(s) and to detect the plausibility of failure modes associated with drug product, if any. Rank order scores, ranging between 1 and 10 each, were assigned to the CMAs for severity, detectability and occurrence of risk(s), to calculate the risk priority number (RPN) as per the formula given in Equation (Equation1(1) ) (Fahmy et al., Citation2012). The factors associated with high RPN were finally subjected to factor screening studies employing Taguchi design.
(1)
Preparation of GR microballoons
The microballoons of ITH were prepared by non-aqueous solvent evaporation method (Phutane et al., Citation2010). Briefly, the drug (20–100 mg) was dissolved in aqueous methanolic solution (1:4) and the polymer, i.e. Eudragit S-100 (0.1 g) was dissolved in acetone (10 mL) to form a clear solution. Both the phases were mixed with each other under stirring condition. Finally, the mixture containing the blend of drug and polymer were poured in 50 mL of HLP, maintained at 28 °C with continuous stirring at 1000 rpm for 2 h to allow complete evaporation of solvents. The microballoons formed were collected by filtration, washed with petroleum ether (40–60 °C), and subsequently dried overnight in oven at 40 °C. Each formulation was prepared in triplicate. The hollow microspheres, thus obtained, were packed in a glass vial and stored in desiccator. During all these trials, the composition of the mixture of organic solvent (i.e. acetone) to aqueous methanol was kept as constant, in the ratio of 20:1 v/v.
Factor screening studies
The seven-factor eight-run Taguchi design was used for factor screening studies to identify the effect of each MAs and/or PPs on the CQAs of GR hollow microspheres of ITH. illustrates the Taguchi design matrix selected for the preparation of GR microballoons along with their respective low and high levels. A total of eight trial formulations were thus prepared as per the screening design, and evaluated for percent yield, EE and percent buoyancy, respectively. Model was fitted using linear polynomial equations, and coefficients for each factors was evaluated corresponding to the CQAs of drug product by obviating the interaction term(s). The Pareto charts were used for quantitatively identifying the effect of each MAs/PPs on the selected CQAs for screening.
Table 3. Formulation and process variables with their respective high and low levels investigated employing Taguchi design.
Optimization of GR microballoons using experimental design
Systematic optimization of GR microballoons was accomplished employing Box-Behnken Design (BBD) using the highly influential CMA/CPPs selected using the factor screening and risk assessment studies. illustrates the design matrix as per BBD containing a total of 17 different formulations prepared employing drug–polymer ratio (X1), temperature (X2) and stirring speed (X3) as the CMA/CPPs at three different levels, i.e. low (−1), intermediate (0) and high (+1) levels, including quintuplicate studies at the center point (0,0,0) formulations. All the prepared formulations were evaluated for various CQAs viz. EE, particle size, Q18h and T60%, respectively.
Table 4. Formulation composition of GR hollow microballoons prepared as per BBD.
Characterization of the GR microballoon formulations
Percent yield
Percent yield was calculated from the weight of dried microballoons recovered from each of the formulations and the sum of initial dry weight of starting materials as stated in Equation (Equation2(2) ).
(2)
Entrapment efficiency
An accurately weighed amount of microballoons, equivalent to 10 mg of drug, was dissolved in 5.0 mL of methanol and the volume was made upto 100 mL with 0.1 N HCl. The solution was macerated to facilitate complete extraction of the drug by evaporating methanol. The solution was filtered through Whattman filter paper, diluted suitably and analyzed spectrophotometrically at 258 nm using UV–Visible Spectrophotometer 3000+ (M/s Labindia Instruments Pvt. Ltd., Mumbai, India) (Gupta et al., Citation2010). Entrapment efficiency (%) was calculated as per the formula mentioned in Equation (Equation3(3) ).
(3)
In vitro buoyancy studies
The floating characteristics of the hollow microspheres were evaluated by in vitro buoyancy studies in simulated gastric fluid (SGF, pH 1.2) without pepsin. An accurately weighed amount of microballoons were filled in size 0 hard gelatin capsules. These capsules were transferred to the dissolution medium (SGF pH 1.2, 900 mL) taken in USP Type II dissolution apparatus kept at 37 ± 0.5 °C and 50 rpm. At specified periodic intervals during 24 h dissolution run, the floating and sedimented portions of the microballoons were collected, dried and weighed separately to calculate the percent buoyancy using Equation (Equation4(4) ).
(4)
In vitro drug release studies
In vitro drug release studies on the GR microballoons were carried out in triplicate using the USP Type II apparatus in 900 mL of SGF (pH 1.2) maintained at 37 ± 0.5 °C and 50 ± 2.0 rpm under sink conditions. Accurately weighed amount of microballoons containing dose equivalent to 100 mg of ITH were filled in size 0 hard gelatin capsules and placed under dissolution conditions. Aliquot of samples (5 mL) were withdrawn periodically at suitable time intervals and replenished with an equivalent volume of plain dissolution medium. Samples were analyzed spectrophotometrically at 258 nm employing a UV–Vis spectrophotometer 3000+ (M/s Labindia Instruments Pvt. Ltd., Mumbai, India). The raw data obtained from in vitro drug release studies were analyzed using ZOREL software. The software has the in-built provisions for applying the correction factor for volume and drug losses during sampling (Equation (Equation5(5) )), and calculating the values of amount of drug dissolved, percent release, rate of drug release and log fraction released at varied times (Singh et al., Citation1997; Singh & Singh, Citation1998).
(5)
where, Ci = corrected absorbance; Ai = absorbance of ith reading; Vs = sample volume; Vt = total volume of dissolution medium. The values of percent of drug released in 18 h (i.e. Q18h) were computed from the drug release profile and the time taken to release 60% of drug (i.e. T60%) for all the formulations was computed using Stineman interpolation option of Minitab 17 software (M/s Minitab Inc., Philadelphia, PA). Drug release data were fitted into Korsemeyer model for non-swellable compressed matrices, as described in Equation (Equation6
(6) ) (Korsmeyer et al., Citation1983).
(6)
where, Mt is amount of drug released at time “t”, M∞ is amount of drug released at an infinite time, K is the kinetic constant and n is the Fickian diffusion coefficient.
Particle size analysis
Accurately weighed quantities (0.1 g) of microballoons were dispersed in 0.1 N HCl containing 0.02 %w/v SLS with stirring and ultrasonication. Average particle size and particle size distribution of microballoons were determined using Mastersizer 2000 (M/s Malvern Instruments Ltd., Worcestershire, UK).
Evaluation of micromeritic properties
The microballoons were characterized for various micromeritic parameters viz. angle of repose, bulk and tapped density, Carr’s Index (CI) and Hausner’s Ratio (H). The angle of repose was measured by funnel method and calculated by using the Equation (Equation7(7) ).
(7)
where, h and d are the height and diameter of the heap of microballoons.
For determining the bulk and tapped density, accurately weighed amount of microballoons were transferred into a 10-mL measuring cylinder, and the volume occupied was noted before and after tapping, with the help of a tapped density apparatus (M/s Electrolab, Mumbai, India). Bulk density was calculated as a ratio of mass of microballoons to bulk volume, whereas tapped density was calculated as a ratio of mass of microballoons to tapped volume for which the cylinder was tapped gently until there was no change in volume.
CI was calculated using the following formula stated in Equation (Equation8(8) ):
(8)
H was calculated as a ratio of bulk density to tapped density.
(9)
where, ρT and ρB represent the values of tapped density and bulk density, respectively.
Optimization data analysis and validation of QbD
The QbD optimization data analysis was carried out after evaluating prepared microsphere formulations for various CQAs like, EE, particle size, Q18h and T60%. Subsequently, mathematical modelling was carried out employing second-order quadratic model to explore the plausibility of significant interaction(s) among the studied CMAs. Only the polynomial coefficients corresponding to each model term, which were found to be significant as per the Student’s t-test was considered during framing the polynomial equation(s). One-way ANOVA was carried out by analyzing the model parameters like model p value, coefficient of correlation (r2) and lack of fit. Response surface analysis was carried out with the help of 3D-plots for thorough understanding of the effect of each CMA and/or CPP on the CQAs. Search for optimum formulation was carried out using numerical optimization procedure of desirability function by “trading-off” of various CQAs as per the selected acceptance criteria, i.e. maximization of EE, Q18h and T60%, and minimization of particle size.
Validation of the QbD methodology was carried out by selecting six confirmatory check-point formulations from the knowledge space region. The validation formulations were evaluated, and the observed and predicted values for each CQA were critically compared. The linear correlation plots were constructed between the observed and predicted responses, forcing the line through the origin. Further, the percent prediction error was also calculated with respect to the observed responses, and residual plots were constructed between the observed responses and percent bias.
Drug release comparison with marketed brand
Drug release profile of the optimized microballoons was compared with the marketed brand, Ganaton® (M/s Abbott Ltd., Mumbai, India) of ITH, as per the previously described method.
Scanning electron microscopy (SEM)
The surface morphology of optimized hollow microspheres was examined by SEM JSM 6100 (M/s JEOL, Tokyo, Japan). The dried microballoons were subjected to gold coating after mounting them on brass stubs using carbon paste and kept in a dessicator for one week. The microballoons were scanned under acceleration voltage of 10 kv and the images depicting the surface topology were obtained.
Drug-excipient compatibility studies
Fourier transform infrared (FT-IR) spectroscopy
The FT-IR spectroscopy was performed to characterize the possible interactions between the drug and excipients, if any. The FT-IR spectra of drug and polymer mixture were recorded in KBr disc over the range 4000–400 cm−1 using an FTIR spectrophotometer (M/s Perkin Elmer, Waltham, MA).
Differential scanning calorimetry (DSC) studies
The DSC studies were carried out to investigate the thermodynamic compatibility between physical mixture of drug and polymer selected for preparation of microballoons based on their melting temperature and glass transition temperature. The drug–polymer physical mixture was prepared by simple mixing with the help of mortar and pestle. Approximately 3–5 mg of each sample was transferred in Aluminium pan and heated at a rate of 10 °C.min−1 up to 300 °C under nitrogen environment at a flow rate 20 mL.min−1. Thermal data analyses of DSC thermograms were conducted using the Q Series Thermal Advantage DSC software (M/s TA Instruments, New Castle, DE).
Powder X-ray diffraction (P-XRD) studies
The P-XRD studies were carried out for solid-state characterization of the drug, polymers and optimized microballoons. The diffraction pattern of samples were recorded by X-ray diffractometer, Philips PW 17291 (M/s Philips Instruments, DA Best, The Netherlands) using Ni-filtered, Cu kV radiation, at a voltage of 40 kV. The XRD spectra, thus obtained, were compared for solid-state characterization of the drug in the prepared microsphere formulations.
In vivo imaging studies
In vivo studies for evaluation of GR potential of the microballoons was performed using X-ray imaging technique as per the protocol approved by the Institutional Ethical Committee, Maharishi Markandeshwar University, Mullana, Ambala, India. Unisex rabbits (weighing 2–2.5 kg) were housed under standard laboratory conditions at 25 ± 2 °C and 55 ± 5% RH with access to standard diet and tap water ad libitum. Prior to initiation of the studies, the animals were kept overnight under fasting condition in order to avoid difficulties during imaging. The X-ray images of empty stomach were taken prior to conduct of experiments. Barium meal (2 mL) was administered to animals to identify the location of gastric tissue. Animals were administered with GR microballoons containing barium sulphate filled in size 4 hard gelatin capsules along with sufficient amount of water. After oral dosing, the animals were placed in the upright position for imaging to locate both control and microballoons formulations in tract using X-ray machine (M/s Siemens 300 MA with fluoroscopy, München, Germany) at different time intervals like 0.5, 1, 1.5, 3, 6 and 8 h, respectively.
Results and discussion
Risk assessment studies
depicts the Ishikawa fish-bone diagram for GR microballoons of ITH portraying the cause–effect relationship among the factors affecting the drug product CQAs. illustrates the REM carried out for qualitative analysis of risk associated with each MA and/or PP. The REM suggested that factors, i.e. drug–polymer ratio, volume of aqueous phase, stirrer type, stirring speed and stirring temperature were found to be high risk, while the factors like type of polymer, volume of methanol, HLP, stabilizer concentration were associated with medium risk. Based on the REM analysis, extensive risk assessment was carried out by assigning ordinal scores to each MA and PP. enlist the details of MAs and PPs employed during FMEA and their calculated RPN scores, which quantitatively describe their effect and plausible consequences on drug product CQAs. A cut-off value of RPN (i.e. 100 or above) was selected for discriminating the high-risk factors against the low-risk factors. High RPN scores (i.e. above 100) were observed for drug–polymer ratio, volume of acetone, volume of aqueous phase: methanol, volume of liquid paraffin, stirrer type, stirring speed and stirring temperature, respectively.
Figure 1. Ishikawa fish-bone diagram depicting the cause-and-effect relationship among the formulation and process variable for formulation of GR hollow microballoons of ITH.
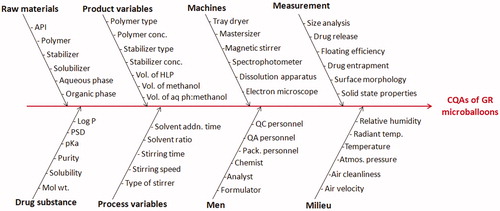
Table 5. REM for initial risk assessment of GR hollow microballoons of ITH.
Table 6. Summary of FMEA analysis illustrating RPN scores for various formulation and process variables affecting the CQAs.
Factor screening studies
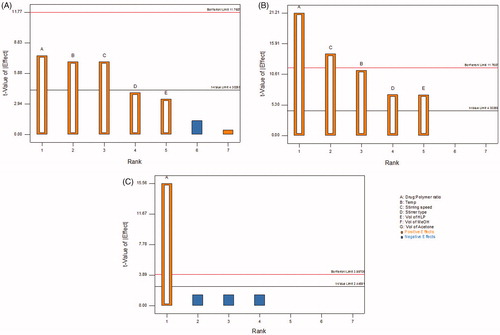
Factor screening studies were further carried out on the input variables short-listed using REM and FMEA analysis to finally embark upon the CMAs employing Taguchi design. The first-order polynomial equations along with their corresponding polynomial coefficients, generated for each of the quality attributes employed during the factor screening studies, indicated the absence of any interaction(s) among the factors. Further, the influence of each factor on the response variables was also evaluated with the help of Pareto charts. Significant influence of all the three factors like drug–polymer ratio, stirring speed and stirring temperature was observed on the percentage yield of the floating microballoons of ITH, as these values were found to be higher in magnitude than the t-value limit of the Pareto chart (). The Pareto charts depicted in corroborate considerable impact of drug–polymer ratio and stirring speed on EE, while illustrates very significant effect of drug–polymer ratio on percent buoyancy as the values crossed the Bonferroni limit. In a nutshell, the factors, i.e. drug–polymer ratio, stirring speed and stirring temperature were selected as the CMAs, while other four variables considered during screening studies were fixed at a constant value owing to their insignificant influence on the CQAs for microballoon formulations.
Figure 2. Pareto charts for screening of influential factors as per Taguchi design using chosen critical quality attributes (CQAs), (A) percent yield, (B) entrapment efficiency, (C) floating time.
Characterization of GR floating microballoons
Percent yield
The formulation composition of the microballoons prepared as per the experimental design exhibited yield ranging widely between 48% and 95%. This clearly vouches that the choice of formulation composition has very significant impact on entrapment of the drug in the polymer matrix for formation of microballoons.
Entrapment efficiency
All the microballoons prepared as per the experimental design showed good entrapment, ranging widely between 73% and 91%, indicating superior drug loading in the microballoons for attaining desired therapeutic action. The largest value of EE, however, was observed at the intermediate levels of the polymer.
In vitro buoyancy studies
In vitro buoyancy studies revealed that 51% to 85% of the hollow microsphere formulations remained under floating condition for 24-h time period. All the prepared microballoons showed instantaneous onset of floating behavior in vitro with zero lag time attributable to the hollow nature of the microspheres leading to buoyant systems. This would help in achieving higher retention time of the microballoons in stomach for prolonged duration of time.
In vitro drug release studies
The drug release profile of the formulations prepared as per the experimental design showed a noticeable initial burst release in the first 2 h, followed by nearly sustained release profile of drug release upto 24 h. The initial burst release effect may be ascribed to the release of drug on the surface of the microballoons, followed by diffusional drug release from the inner core (Obeidat & Price, Citation2006; Chawla et al., Citation2012; Singh et al., Citation2012). The values of Q18h for the prepared hollow microspheres ranged quite widely between 60.2 and 98.7%, portraying a somewhat linear decreasing trend with increase in the concentration of the polymer, i.e. Eudragit S-100. High magnitude of T60%, ranging between 8.4 and 11 h, vouched sustained drug release profile of the formulations. Further, the values of release rate exponent (n), ranging between 0.120 and 0.311, ratified a Fickian or quasi-Fickian mechanism of drug release (Korsmeyer et al., Citation1983). Albeit Eudragit S-100 is known to be a non-swellable polymer tending only to dissolve at pH above 7, the value of “n” showed increasing trend with increase in the concentration of the polymer, plausibly attributed to its diffusional contribution (Lee et al., Citation2000; Jain et al., Citation2006; Ahuja et al., Citation2007).
Response surface analyses
enlists the values of the coefficients of second-order quadratic polynomial equations, as per Equation (Equation10(10) ), for each CQA along with ANOVA parameters like model p value, r2 and predicted error sum of squares (PRESS). The coefficients of the polynomial equation generated using multiple linear regression analysis (MLRA) for all the CQAs, i.e. EE, particle size, Q18h and T60% along with high values of r2 ranging between 0.9421 and 0.9968 (p < 0.005 in each case), and low values of PRESS confirmed goodness of fit of the data.
(10)
Table 7. Coefficient of model terms and statistical parameters obtained for second order quadratic equations for the studied CQAs.
depicts the 3D-response surface plots for EE, particle size, Q18h and T60%. The response surface analyses provide improved understanding of the interaction(s) between the CMAs and their impact on CQAs of the GR microballoons of ITH.
Figure 3. Response surface plots showing the influence of CMAs and CPPs, i.e. amount of polymer, stirring temperature and stirring speed on CQAs, (A) EE, (B) particle size, (C) T60% and (D) Q18h of GR microballoons of ITH.
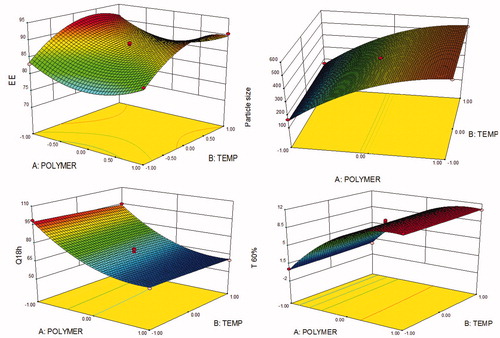
As portrayed in , a twisted response surface plot was observed for the CQA, i.e. EE, where a rise in the levels of polymer showed initial decrease followed by an increasing trend at low levels of stirring temperature. On the other hand, increase in the levels of temperature showed an improving trend followed by a plateau phase. The identical relationship was also observed for response surface plots between polymer concentration versus stirring speed and temperature versus stirring speed, respectively (data not shown). Maximum EE was observed at the low levels of polymer and the higher levels of stirring temperature and stirring speed. The presence of curved lines in response surface confirmed the presence of interaction(s) among the CMAs.
portrays the 3D-response surface plot for the particle size, where increase in the levels of CMA, i.e. polymer concentration, showed an ascending trend at all the levels. The effect of temperature on particle size, on the other hand, was found to be negligible. Likewise, almost a linearly increasing trend was observed with stirring temperature and stirring speed (data not shown). Smallest particle size was observed at low level of polymer and low temperature.
The 3D-response surface plot depicted in reveals that the amount of polymer has linearly descending influence on Q18h. However, the effect of stirring temperature was found to be almost negligible. Likewise, an analogous trend was also observed with polymer concentration and stirring speed (data not shown). portrays the 3D-response surface plot for T60%, where a sharp rise in the values of T60% was observed upon increasing the amount of polymer, ostensibly owing to the sustained release profile of drug release from the microballoons. However, a miniscule influence was observed with stirring temperature and stirring speed on T60% (data not shown).
Particle size analysis
Particle size analysis of the microballoons prepared as per the experimental design was found to range between 240 and 1150 µm, ratifying the micro-structure of the prepared formulations. The variation in mean particle size was ascribed to the variation in drug–polymer ratio along with plausible influence of stirring speed during preparation of microballoons. Increase in the concentration of polymer tended to cause significant augmentation in the particle size, while the factors like stirring speed and stirring temperature reduced the particle size of microballoons noticeably.
Evaluation of micromeritic properties
Evaluation of the micromeritic properties revealing CI between 10.3 and 20%, Hausner’s ratio less than 1.25, and angle of repose (θ) less than 25°, confirm favorable flow characteristics of the prepared microspheres.
Search for optimum formulation and validation of QbD methodology
Selection of the optimized formulation was embarked upon using numerical optimization by desirability function while “trading off” various CQAs to attain the desired goals, i.e. minimization of particle size, and maximization of EE, Q18h and T60% to obtain desirability close to 1. The optimized formulation corresponded to drug–polymer ratio of 1:3.31, stirring temperature of 28 °C and stirring speed of 1000 rpm, exhibiting EE of 85%, particle size of 400 µm, percent buoyancy of 87%, Q18h as 75.3% and T60% ∼8 h, respectively.
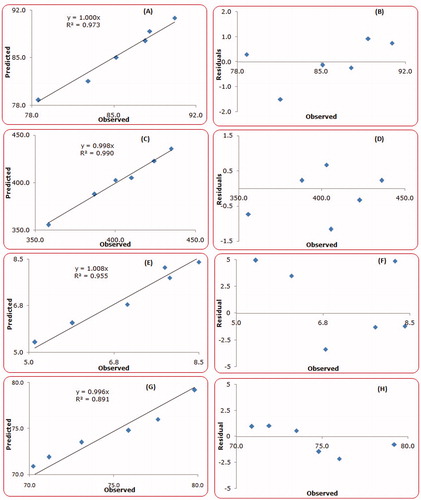
Validation of the QbD methodology was accomplished by preparing six check-point formulations and comparing their observed responses with those predicted ones. The prediction error (i.e. bias) for the CQAs varied between −3.95 and 5.22% with overall mean ± SD as −0.98% ± 0.22. illustrates the linear correlation plots drawn between the predicted and observed responses demonstrating high values of “r”, ranging between 0.886 and 0.932, thus ratifying the excellent goodness of fit (p < 0.05 in each case). The corresponding residual plots were also quite regulated with a relatively narrow, uniform and random scatter around zero axes, indicating high degree of prognostic ability of the QbD approach.
Figure 4. Linear correlation plots and residual plots between the observed and predicted values of various CQAs, (A–B) entrapment efficiency, (C–D) particle size, (E–F) T60% and (G–H) Q18h.
Drug release comparison with marketed brand
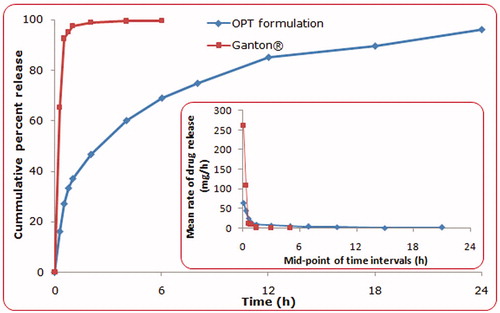
portrays the comparative drug release profile for ITH from the conventional marketed tablet (Ganaton) and the optimum formulation of GR hollow microspheres. Strikingly different drug release profiles were observed for both the formulations. The marketed tablet showed almost complete drug release in less than 1 h owing to its immediate release nature, while the microballoons showed complete drug release in 24 h ratifying its extended release nature. The value of diffusional release exponent (n) of 0.458 for optimized microballoon formulation indicated non-Fickian, i.e. anomalous behavior, while a value of 0.136 for the marketed formulation construed distinct diffusion based mechanism (Korsmeyer et al., Citation1983; Singh & Singh, Citation1998; Costa & Lobo, Citation2001). The inset depicts the mean rate of drug release versus mid-point of time intervals for optimized hollow microspheres vis-à-vis the marketed formulation, which corroborates markedly superior sustained release characteristics from the hollow microspheres.
Figure 5. Dissolution profiles of optimized GR microballoon formulation of ITH and marketed tablet (Ganton). The inset depicts mean rate of drug release versus mid-point of time intervals from optimized microballoons vis-à-vis the marketed tablet.
Scanning electron microscopy
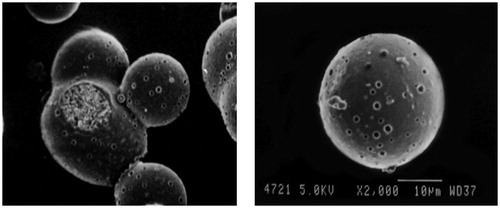
portrays the SEM image of optimized microballoons, which were found to be hollow and spherical in shape with presence of pores on the surface. Also, the surface of microballoons was smooth in appearance, indicating complete entrapment of drug within their hollow cavity.
Figure 6. Scanning electron microscopy images of the optimized GR hollow microspheres.
Drug-excipient compatibility studies
FTIR spectroscopy
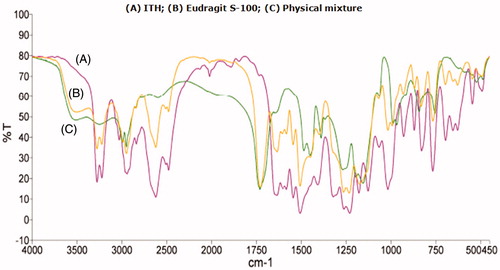
The FT-IR spectra of pure drug, physical mixture of drug-with polymers and optimized microballoons are shown in , showing lack of any significant shift in the wave number (cm−1) or functional groups of the drug in physical mixture with polymer and in the microballoons vis-à-vis the pure drug. This corroborates absence of any physiochemical interaction(s) and incompatibility between the drug and polymer.
Figure 7. FTIR spectra of pure drug, Eudragit S-100, physical mixture of drug and polymer, and optimized microballoon formulation.
Differential scanning calorimetry studies
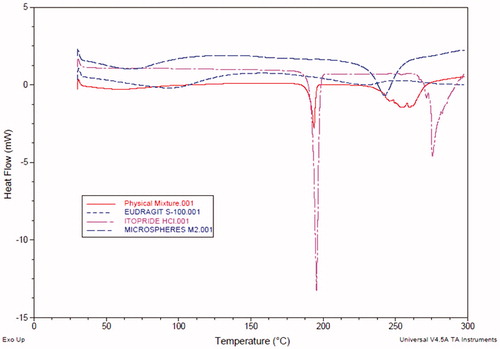
The DSC thermograms of pure drug, physical mixture of drug with Eudragit S-100 and prepared microballoons are shown in . DSC thermogram of ITH showed endothermic peak at 195.49 °C indicating its melting point in the range of 191–195 °C. Comparison of the DSC thermograms of pure drug with physical mixture and microballoons ratified the absence of any physiochemical incompatibility between the drug and polymer. However, the characteristic shift in peak of drug in microballoons at around 242.66 °C corroborates change in physical nature of the drug in microballoons from the erstwhile crystalline to amorphous state. This could be further explained by XRD analysis data wherein no crystalline peak of ITH was observed.
Figure 8. DSC thermograms of pure drug, Eudragit S-100, physical mixture of drug and polymer, and optimized GR microballoons.
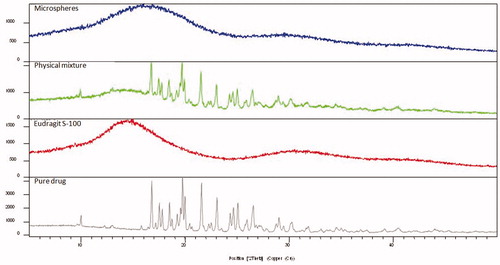
Powder X-ray diffraction (P-XRD) studies
depicts the XRD patterns of pure drug, physical mixture and microballoons. X-ray diffractogram of pure drug exhibited crystalline characteristics with diffraction angle (2θ) and d spacing at 16.78°, 19.74°, 21.57°, 23.05° and 5.28°, 4.49°, 4.12°, 3.86°, respectively. Similarly, the X-ray diffractogram of physical mixture of drug and polymer also showed identical diffraction patterns (2θ) and d spacing at 16.74°, 19.69°, 21.5°, 23° and 5.29°, 4.51°, 4.13°, 3.86°, respectively. However, X-ray diffractograms of the microballoons showed diffused spectra without any characteristic peak(s) of the drug, ostensibly owing to the complete encapsulation of drug within the microballoons.
Figure 9. PXRD patterns of pure drug, Eudragit S-100, physical mixture of drug and polymer, and optimized GR microballoons.
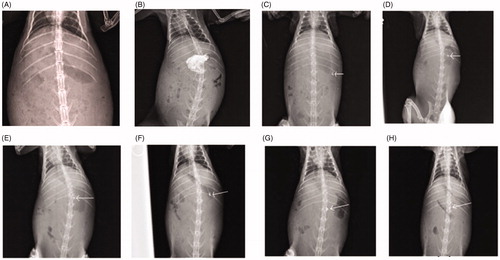
In vivo imaging studies
) refer to the X-ray images of empty stomach of rabbit before and after administration of Barium meal, respectively, whereas ) reveal that the QbD optimized microballoons were retained in the gastric region of the rabbit indicating prolonged residence time of the microballoons even after 8 h of administration, ostensibly owing to their floating characteristics for extended period of time.
Figure 10. X-ray images of the rabbit stomach, (A) without microballoons, (B) with barium meal, (C) after 30 min administration of microballoons, (D) after 2 h administration of microballoons, (E) after at 3 h administration of microballoons, (F) after 4 h administration of microballoons, (G) after 6 h administration of microballoons, (H) after at 8 h administration of microballoons.
Conclusions
The present studies successfully vouch the use of rational QbD approach in the systematic development of optimized GR systems employing simple, effectual and cost-effectual floating microballoons for improving gastric residence time and site-specific drug delivery of ITH. Implementation of QbD-based strategies helped in selecting apt formulation and/or process variables for formulation of multiple-unit floating hollow microspheres, and subsequently arriving at the optimum delivery system with desired floatational and drug release characteristics. Thus, the in vitro and in vivo studies ratify the successful CR and GR propensities of the proposed optimized formulation for once-in-a day administration, leading eventually to effective, safe and patient-compliant outcomes. Further pharmacokinetic and/or pharmacodynamic studies would be useful to corroborate its extended duration of action and enhancement in bioavailable fraction. The promising results and the technical know-how from the current work can also be extrapolated for accomplishing the GR characteristics of other BCS class I drugs too.
Acknowledgements
The authors are thankful to M/s Cadila Pharmaceuticals Ltd, Jammu, India, and M/s Evonik, Mumbai, India, for providing the gift samples of ITH and Eudragit S-100, respectively. Vital software support for QbD data analysis using Design Expert® 9.0.1 from M/s Stat-Ease, Minneapolis, MN, and Minitab® 17 from M/s Minitab Inc., Philadelphia, PA, is deeply acknowledged. Valuable support from the Punjab University, Chandigarh, India, for providing instrumentation facilities to carry out the XRD, DSC and FTIR studies, and to the Department of Radiology, Maharishi Markandeshwar University, Mullana, Ambala, India, for the conduct of X-ray imaging studies is deeply appreciated. Vital support from Dr. Sumit Gupta, Maharishi Markandeshwar University, Mullana, Ambala, India, during the conduct of animal studies is also gratefully acknowledged.
Declaration of interest
The authors declare no conflict(s) of interest in this work. The research work has been carried by funding of University Grant Commission, New Delhi, India.
References
- Ahuja N, Katare OP, Singh B. (2007). Studies on dissolution enhancement and mathematical modeling of drug release of a poorly water-soluble drug using water-soluble carriers. Eur J Pharm Biopharm 65:26–38
- Awasthi R, Kulkarni GT, Pawar VK, Garg G. (2012). Optimization studies on gastroretentive floating system using response surface methodology. AAPS PharmSciTech 13:85–93
- Chawla A, Sharma P, Pawar P. (2012). Eudragit S-100 coated sodium alginate microspheres of naproxen sodium: formulation, optimization and in vitro evaluation. Acta Pharma 62:529–45
- Costa P, Lobo JMS. (2001). Modeling and comparison of dissolution profiles. Eur J Pharm Sci 13:123–33
- Fahmy R, Kona R, Dandu R, et al. (2012). Quality by design I: application of failure mode effect analysis (FMEA) and Plackett-Burman design of experiments in the identification of “main factors” in the formulation and process design space for roller-compacted ciprofloxacin hydrochloride immediate-release tablets. AAPS PharmSciTech 13:1243–54
- Gupta H, Bhandari D, Sharma A. (2009). Recent trends in oral drug delivery: a review. Recent Pat Drug Deliv Formul 3:162–73
- Gupta KR, Joshi RR, Chawla RB, Wadodkar SG. (2010). UV-Spectrophotometric method for the estimation of itopride HCl in pharmaceutical formulation. e-J Chem 7:S49–54
- Gupta S, Kapoor V, Kapoor B. (2004). Itopride: a novel prokinetic agent. Drug Rev 6:106–8
- Ichikawa M, Kato T, Kawahara M, et al. (1991). A new multiple-unit oral floating dosage system. II. In vivo evaluation of floating and sustained-release characteristics with p-aminobenzoic acid and isosorbide dinitrate as model drugs. J Pharm Sci 80:1153–6
- Jain SK, Aggarwal GP, Jain NK. (2006). Evaluation of porous carrier-based floating orlistat microspheres for gastric delivery. AAPS PharmSciTech 7:E54–E62
- Kapil R, Dhawan S, Beg S, Singh B. (2013). Buccoadhesive films for once-a-day administration of rivastigmine: systematic formulation development and pharmacokinetic evaluation. Drug Dev Ind Pharm 39:466–80
- Kapil R, Dhawan S, Singh B, et al. (2012). Systematic formulation development of once-a-day gastroretentive controlled release tablets of rivastigmine using optimized polymer blends. J Drug Del Sci Tech 22:511–21
- Kawashima Y, Niwa T, Takeuchi H, et al. (1991). Prepration of multiple-unit hollow microspheres (microballoons) with acrylic resin containing traniplast and their drug release characteristics (in vitro) and floating behaviour (in vivo). J Contr Rel 16:279–90
- Korsmeyer RW, Gurny R, Doelker EM, et al. (1983). Mechanism of solute release from porous hydrophilic polymers. Int J Pharm 15:25–35
- Kotreka UK, Adeyeye MC. (2011). Gastroretentive floating drug-delivery systems: a critical review. Crit Rev Ther Drug Carrier Syst 28:47–99
- Lee J, Park TG, Choi H. (2000). Effect of formulation and processing variables on the characteristics of microspheres for water-soluble drugs prepared by w/o/o double emulsion solvent diffusion method. Int J Pharm 196:75–83
- Lionberger RA, Lee SL, Lee L, et al. (2008). Quality by design: concepts for ANDAs. AAPS J 10:268–76
- Murphy CS, Pillay V, Choonara YE, du Toit LC. (2009). Gastroretentive drug delivery systems: current developments in novel system design and evaluation. Curr Drug Deliv 6:451–60
- Obeidat WM, Price JC. (2006). Preparation and evaluation of Eudragit S 100 microspheres as pH-sensitive release preparations for piroxicam and theophylline using the emulsion-solvent evaporation method. J Microencapsul 23:195–202
- Pahwa R, Singh M, Kumar V, Kohli K. (2012). Recent advances and patent perspectives in gastroretentive technology. Recent Pat Drug Deliv Formul 6:278–90
- Pawar VK, Kansal S, Garg G, et al. (2010). Gastroretentive dosage forms: a review with special emphasis on floating drug delivery systems. Drug 18:97–110
- Phutane P, Shidhaye S, Lotlikar V, et al. (2010). In vitro evaluation of novel sustained release microspheres of glipizide prepared by the emulsion solvent diffusion-evaporation method. J Young Pharm 2:35–41
- Sato Y, Kawashima Y, Takeuchi H, Yamamoto H. (2004a). In vitro and in vivo evaluation of riboflavin-containing microballoons for a floating controlled drug delivery system in healthy humans. Int J Pharm 275:97–107
- Sato Y, Kawashima Y, Takeuchi H, Yamamoto H. (2004b). In vitro evaluation of floating and drug releasing behaviors of hollow microspheres (microballoons) prepared by the emulsion solvent diffusion method. Eur J Pharm Biopharm 57:235–43
- Sato Y, Kawashima Y, Takeuchi H, et al. (2004c). Pharmacoscintigraphic evaluation of riboflavin-containing microballoons for a floating controlled drug delivery system in healthy humans. J Contr Rel 98:75–85
- Singh B, Ahuja N. (2002). Development of controlled-release buccoadhesive hydrophilic matrices of diltiazem hydrochloride: optimization of bioadhesion, dissolution, and diffusion parameters. Drug Dev Ind Pharm 28:431–42
- Singh B, Chakkal SK, Ahuja N. (2006). Formulation and optimization of controlled release mucoadhesive tablets of atenolol using response surface methodology. AAPS PharmSciTech 7:E19–E28
- Singh B, Dahiya M, Saharan V, Ahuja N. (2005a). Optimizing drug delivery systems using systematic “design of experiments”. Part II: retrospect and prospects. Crit Rev Ther Drug Carrier Syst 22:215–94
- Singh B, Garg B, Chaturvedi SC, et al. (2012). Formulation development of gastroretentive tablets of lamivudine using the floating-bioadhesive potential of optimized polymer blends. J Pharm Pharmacol 64:654–69
- Singh B, Kapil R, Nandi M, Ahuja N. (2011). Developing oral drug delivery systems using formulation by design: vital precepts, retrospect and prospects. Expert Opin Drug Deliv 8:1341–60
- Singh B, Kaur T, Singh S. (1997). Correction of raw dissolution data for loss of drug during sampling. Indian J Pharm Sci 59:196–9
- Singh B, Kumar R, Ahuja N. (2005b). Optimizing drug delivery systems using systematic “design of experiments.” Part I: fundamental aspects. Crit Rev Ther Drug Carrier Syst 22:27–105
- Singh B, Pahuja S, Kapil R, Ahuja N. (2009). Formulation development of oral controlled release tablets of hydralazine: optimization of drug release and bioadhesive characteristics. Acta Pharm 59:1–13
- Singh B, Rani A, Garg B, et al. (2010). Formulation optimization of hydrodynamically balanced oral controlled release bioadhesive tablets of tramadol hydrochloride. Sci Pharm 78:303–23
- Singh B, Raza K, Beg S. (2013). Developing “optimized” drug products employing “Designed” experiments. Chem Ind Digest 6:70–76
- Singh B, Singh S. (1998). A comprehensive computer program for study of drug release kinetics from compressed matrices. Indian J Pharm Sci 60:313–16
- Vora C, Patadia R, Mittal K, Mashru R. (2013). Risk based approach for design and optimization of stomach specific delivery of rifampicin. Int J Pharm 455:169–81