
 ?Mathematical formulae have been encoded as MathML and are displayed in this HTML version using MathJax in order to improve their display. Uncheck the box to turn MathJax off. This feature requires Javascript. Click on a formula to zoom.
Abstract
Glycyrrhizin or glycyrrhizic acid (GA) – triterpene glycoside extracted from licorice root – has been intensively studied over the past decade and is considered to be a potential drug delivery system. Glycyrrhizin was found to enhance the therapeutic effect of various drugs; however the detailed mechanism of these effects is still unknown and attracts the attention of researchers. In this work, we have made an attempt to clarify the mechanism of Glycyrrhizin activity on molecular and cellular level. The influence of GA on the functional properties of biomembranes was investigated via NMR spectroscopy and atomic force microscopy (AFM) using human erythrocytes as a model system. GA was shown to increase the permeability (about 60%) and to decrease elasticity modulus of cell membranes (by an order of magnitude) even in micromolar concentrations. Changes on the erythrocyte surface were also detected by AFM. These results could provide a new insight on the mechanism of bioavailability enhancement of some drugs in the presence of glycyrrhizin, as well as the mechanism of its own biological activity. The role of cholesterol–glycyrrhizin binding in the observed effects is also discussed.
Introduction
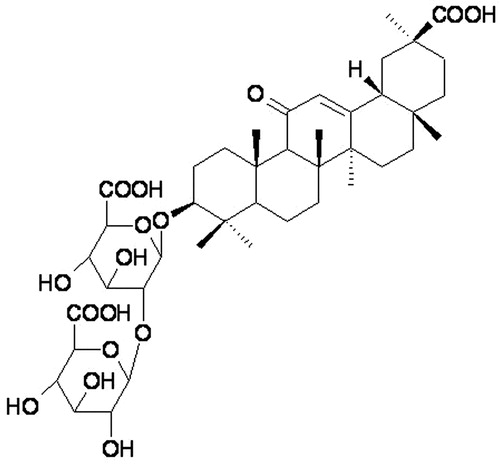
During the past decade, there has been a significant growth of publications devoted to the physicochemical studies of drugs supramolecular complexes (Jain, Citation2008). Some novel drug carriers or drug delivery systems (DDSs) enhance drug solubility and moreover improve its therapeutic activity. One example of such a compound is glycyrrhizin (or glycyrrhizic acid; GA; ) – a triterpenoid saponin extracted from licorice root. GA has a wide range of biological activity and is widely used for prevention and treatment of different diseases: influenza, stomach and duodenal ulcers, liver disease, eczema, dermatitis, asthma, etc. (Pompei et al., Citation1983; Utsunomiya et al., Citation1997; Saeedi et al., Citation2003; Asl & Hosseinzadeh., Citation2008). According to recent studies, GA also induces apoptosis of cancer cells and inhibits cancer genesis and the growth of tumors (Hibasami et al., Citation2006; Nafisi et al., Citation2012). Moreover, there are various examples of GA's influence on cholesterol biosynthesis and triglyceride levels (Novikov et al., Citation1992; Maurya & Srivastava, Citation2011).
Figure 1. The structure of glycyrrhizic acid.
In addition to its own biological activity, there are lots of experimental data on GA's ability to enhance the bioavailability of other drugs (Tolstikova et al., Citation2009; Polyakov & Leshina, Citation2011). Along with the increased solubility of many hydrophobic pharmaceutical compounds in the presence of GA, there is a significant enhancement of their therapeutic action, and in some cases, even changing of the mechanism of their activity (Ragino et al., Citation2008; Vavilin et al., Citation2008; Tolstikova et al., Citation2009; Polyakov & Leshina, Citation2011; Polyakov et al., Citation2013). However, the molecular mechanism of GA's biological activity and the enhancement of various drugs bioavailability in the presence of GA are still under debate. In order to clarify the contribution of GA to drug activity, different physicochemical studies of the GA solutions properties have been made during past decade. First, GA was found to be able to form stable complexes with organic molecules (Kornievskaya et al., Citation2007a, Kornievskaya et al., Citation2007b; Polyakov & Leshina, Citation2011). In addition, due to its amphiphilic character (), glycyrrhizin exhibits properties typical for micelle-forming substances (James & Stanford, Citation1962; Gilbert & James, Citation1964; Azaz & Segal, Citation1980; Romanenko & Murinov, Citation2001; Kornievskaya et al., Citation2007a, Kornievskaya et al., Citation2007b; Yakovishin et al., Citation2012). The structure of glycyrrhizin self-associates is dependent on its concentration and the acidity of the solution. At low concentrations (10−5–10−3 M), GA mainly forms a dimer, whereas at high concentrations (greater than 10−3 M), it forms large micelle-like aggregates (Kornievskaya et al., Citation2007a, Kornievskaya et al., Citation2007b) .
The increase in drugs bioavailability in the presence of GA is suggested to be caused by the inclusion complexes formation of these compounds with GA aggregates. To determine the contribution of complex formation with GA to the therapeutic effect of different compounds, physicochemical and pharmaceutical studies of such complexes were conducted (Vavilin et al., Citation2008; Tolstikova et al., Citation2009; Polyakov & Leshina, Citation2011). The formation of “host–guest” type inclusion complexes of GA dimers and micelles with a number of drugs was confirmed by various physical methods, in particular, optical and magnetic resonance spectroscopy (Polyakov & Leshina, Citation2011) and mass-spectroscopy (Borisenko et al., Citation2013). The stability constants of GA complexes (104–105 M−1) are one or two orders of magnitude higher than the corresponding typical values for inclusion complexes of cyclodextrins (102–103 M−1) (Loftsson & Duchene, Citation2007). This allows one to use a much lower carrier concentration for drug delivery. Several animal studies have shown, in particular, that the complexes of phenibutum – nootropic and tranquilizing drug – with GA shows a similar effect at a dose reduced by 16 times (Tolstikova et al., Citation2009). In addition, this complex enhances mnemonic ability of animals and reduces the side effects of phenibutum, namely drowsiness and allergic reactions. At the same time, the toxicity of the drug decreases by a factor of 1.7, and the therapeutic index increases by a factor of 17 (Tolstikova et al., Citation2009). Similar effects were observed for GA complexes with other classes of drugs (Nafisi et al., Citation2012).
However, these facts do not allow us to establish the mechanism of GA action in vivo at the molecular and cellular level. To answer the main question of how it works, we are going to fill the gap between model physicochemical studies in solution and pharmacological studies in vivo. Earlier, we have suggested that the mechanism of GA activity might be partially related to the glycyrrhizin influence on the properties of cell membranes (Gluschenko et al., Citation2011), in particular, via extraction of membrane cholesterol. Cholesterol is a natural lipophilic alcohol, component of cell membranes, which affects their fluidity. In that study, the fact of GA–cholesterol complex formation was established (Gluschenko et al., Citation2011). Therefore, the aim of this work was the study of the effects of GA on the functional and mechanical properties of cell membranes. Human erythrocytes were chosen as the model for this study, since these cells are most accessible and relatively resistant to external influences. In particular, we have investigated the effect of GA on the erythrocyte membrane elasticity, the structure of cell surfaces, as well as on the penetration rate of a model molecule (sodium formate) across the membrane.
Methods
Atomic force microscopy
The red blood cells (RBCs) surface study could be made both on air and in liquid. The observation of RBC surface in the liquid by atomic force microscopy (AFM) is possible, but fraught with technical difficulties. When membrane elasticity is measured by AFM, there is only vertical force between RBCs surface and AFM-tip. This force is weak and RBCs are not removed from the glass surface. In the case of RBCs surface visualization, there are lateral forces and RBCs are removed from the glass surface. Drying the erythrocytes does not alter the structure of their membranes (Zhang et al., Citation1995; Takeuchi et al., Citation1998). Possible changes of erythrocyte shape do not affect the results of the experiment, as we study the effect of GA on the surface structure. Moreover, the reproducibility of the results indicates that the observed changes in the surface structure are not drying effects. Furthermore, a study of the dry sample results in higher resolution than scanning in the liquid (Zhang et al., Citation1995; Takeuchi et al., Citation1998). Therefore, in this work, the surfaces of RBCs were investigated in air, while elasticity measurements were carried out in liquid.
Blood samples were prepared in phosphate-buffered saline with pH ∼ 7.3, containing 0.137 M NaCl and 0.0027 M KCl produced by “Biolot”. Samples were then centrifuged three times (3000 g, 5 min) with the serum substitution by buffer solution (Himmelreich et al., Citation1999). Extracted RBCs were placed in the same buffer solution with different GA concentrations and kept there for an hour. Then they were centrifuged again, and the smear of sediment erythrocytes was applied to a glass slide to study the membrane structure.
The measurements of membrane elasticity were carried out in liquid. Blood samples for these experiments were prepared in the manner described above, cells were immobilized on glass coated with poly-l-lysine (Thermo, Dreieich, Germany) for 10 min and placed in a buffer solution with various GA concentrations, where the samples were incubated for 20–30 min. Binding a cell to a surface with polylysine is often used in elasticity measurements by AFM (Maciaszek et al., Citation2011). All measurements were performed using an atomic force microscope Solver P47 Bio (Zelenograd, Russia), manufactured by NT-MDT. We applied the contact AFM probes with a tip radius of about 20 nm and a force constant 0.003–0.13 N/m. The same AFM probe was used in each experiment.
NMR relaxation experiments
Sodium formate was used as the perfect model compound for studying the exchange rate through the membrane by 1H NMR spectroscopy, due to its appearance in the spectrum as a single-line well separated from the signals of other cellular compounds. All measurements were performed using standard software for NMR spectrometer, Bruker DPX-200 (Bruker BioSpin GmbH, Germany). The measurements were performed in a buffer solution (D2O, 5 mM HEPES, 150 mM NaCl, KOD added to pH ∼ 7.4). In contrast with AFM measurements, which were carried out in phosphate buffer, NMR experiments revealed that the MnSO4 is not soluble in this buffer. Therefore, subsequent NMR experiments were conducted in HEPES buffer, recommended in Himmelreich et al. (Citation1999).
RBCs were centrifuged (3000 g, 5 min, three times) according to Himmelreich et al., (Citation1999). The suspension was then prepared with a volume fraction of RBCs ∼ 50% in the buffer. Sodium formate (5 mM) was added to this suspension for exchange rate measurements. Albumin was used for the experiment with the addition of 2 mM of MnCl2 (binding Mn2+ ions to avoid penetration through the membrane into the RBCs). For these samples, the dependence of T1 relaxation time of sodium formate protons versus GA concentration was measured.
Exchange rate measurements technique (NMR)
The cell membrane forms the boundary between the external environment and the intracellular water. This boundary is permeable for water and drug molecules. To study the membrane permeability, an NMR relaxation method in the presence of paramagnetic ions Mn2+ was developed (Colon & Outhred, Citation1972; Himmelreich et al., Citation1999). Due to the presence of these ions, the relaxation rate of the outside protons will be much higher than the corresponding value of the protons inside the cell. This allows one to separate the internal and external water environment by addition of paramagnetic ions into the external part of the suspension. Thus, by measuring the relaxation time of protons, one can study the process of molecules diffusion through the membrane.
To measure the exchange rate, the longitudinal relaxation time T1 can be used if the T1 value of the investigated nuclei inside the cell is higher than the compound penetration time through the membrane, and the relaxation time of molecules outside the cell is much shorter than the penetration time. The second condition was just done by addition of paramagnetic ions Mn2+ to the buffer solution in which the cells are suspended (Colon & Outhred, Citation1972).
The measurement of the exchange time by the NMR technique is based on the fact that the external environment and the intracellular components are magnetically labeled by π-pulse (180 °), but in a few milliseconds, the external mark completely disappears due to rapid relaxation owing to the presence of Mn2+ ions. But the intracellular molecular ensemble loses its magnetic label only after leaving the cell and making contact with the external environment. Thus, the observed relaxation time T1 is determined by the lifetime of the molecules within the cell:
(1)
(1)
where, T1 is the observed relaxation time, Tex is the time of the molecule penetration through the membrane and Tin is the relaxation time of protons inside the cell (in the absence of ions Mn2+), and the membrane permeability coefficient can be calculated using the following equation:
(2)
(2)
where V is the cell volume and S is its surface square (Himmelreich et al., Citation1999).
Elasticity measurements technique (AFM)
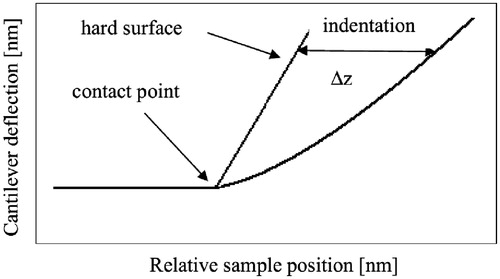
Force spectroscopy is widely used for interaction and adhesion forces measurements (Butt et al., 2005). Data analysis from this work were based on the Sneddon model (Bogachek et al., 2008; Vileno et al., Citation2007), assuming a conical shape of AFM probe. The cell is considered as an elastic and isotropic material. In this model, the force applied to the tip by the cell can be written as:
(3)
(3)
where Ecell is Young modulus of the cell, ηcell is the Poisson's ratio of the cell, α is the half-angle of the tip (Baklanova et al., Citation2008). For each sample, an array of curves was recorded: (1) area with size 100 × 100 µm was selected on the surface covered with a monolayer of erythrocytes; and (2) this area was covered by a grid of 10 × 10 points, and the power curve was recorded at each point. Thus, the array of 100 curves was obtained. The operation was repeated five times to increase the confidence interval.
MathCAD software (PTC, Needham, MA) was used for processing of all power curves. Processing algorithm was based on the determination of the second derivative maximum of each curve at the characteristic point (). The curves that obviously belonged to glass (solid surface) were not considered. Then the dependence of the cantilever deviation on Δz was approximated by parabolic function. All measurements were conducted with the same tip, therefore α was constant. As for ηcell, it is the negative ratio of transverse to axial strain. This ratio depends only on the nature of the material from which the sample is made; therefore, it assumed to be constant for cells of the same type. In order to avoid discrepancies related to the definition of the parameters of the tip and the cells (α and ηcell), whole factor was analyzed. This allows one to determine the change in the cell elastic modulus relative to control sample. For each curve, the parameter ξ has been calculated, and the distribution of this parameter was plotted.
Figure 2. Scheme of elasticity measurements.
Results
NMR experiments
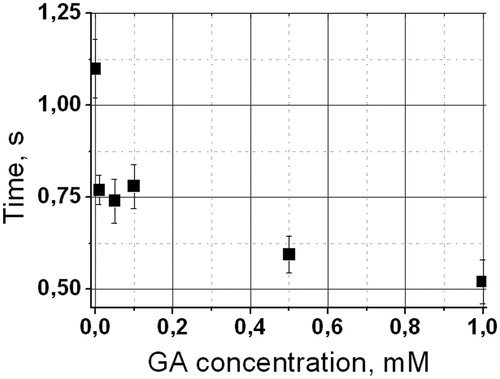
Relaxation time measurements of sodium formate protons were carried out in the presence of different GA concentrations: 0, 0.01 mM, 0.05 mM, 0.1 mM, 0.5 mM and 1 mM. Based on this data, the exchange time of formate molecules through erythrocyte membrane was calculated according to Equation (1). The dependence of exchange time on the GA concentration is shown in . Dots represent mean ± SD, exchange rate measurements were repeated five times. It is notable that the most significant decrease in exchange time (60%) corresponds to very low GA concentration, 0.01 mM, and the maximum decrease of exchange time is more than 2-fold. Decrease in exchange time according to Equation (2) corresponds to increase in permeability.
Figure 3. Dependence of exchange time of sodium formate through the membrane on GA concentration.
AFM experiments
shows the typical examples of the erythrocytes surface maps obtained using AFM. White points are visible on the treated erythrocyte surface (). These points are small nanoscale aggregates, which become more noticeable at magnification (). It should be noted that at identical scale, there are no such nanoscale aggregates on the non-treated sample surface ().
Figure 4. Erythrocyte surface at different magnifications measured by AFM. (a) Control untreated sample, (b) control untreated sample, (c) sample treated by 0.05 mM and (d) sample treated by 0.05 mM of GA.
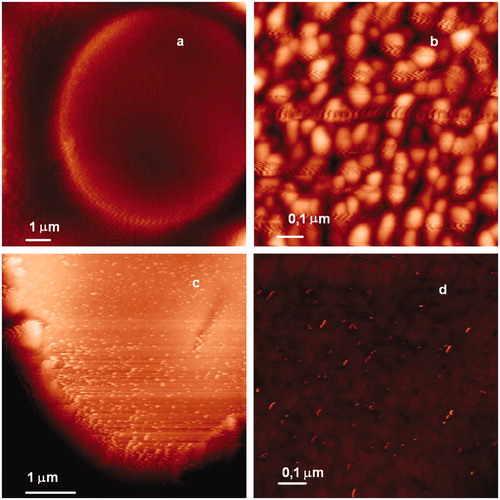
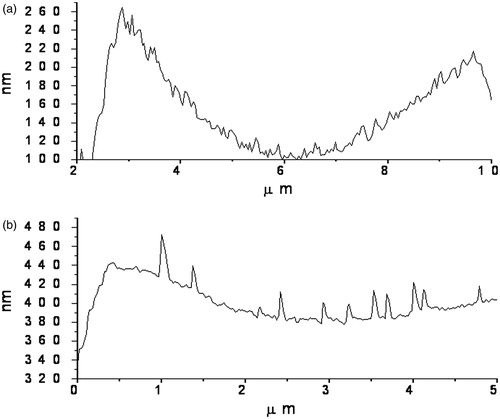
The difference is even more distinguishable on , which shows the profiles of the erythrocyte surface in the absence and in the presence of 0.05 mM GA. One can see the appearance of 20–40 nm aggregates on the erythrocyte surface, which are not observed on samples not treated by GA. The possible nature of this effect will be discussed later.
Figure 5. Profiles of the erythrocyte surface measured by AFM. (а) Control untreated sample and (b) sample treated by 0.05 mM of GA.
Distributions of parameter ξ (see “Methods” section) at different concentrations of GA are shown in . A broad ξ distribution observed for natural untreated erythrocytes might be connected with remarkable difference in elasticity between the cells of different ages. It is seen that average value of ξ decreases with increasing GA concentration from 3 × 10⁻⁶ for the control sample () to 9 × 10⁻⁷ for 0.05 mM GA (), and to 4 × 10⁻⁷ for 0.5 mM GA (). Distribution half-width were 1.5 × 10⁻⁶, 10−6 and 4 × 10⁻⁷, accordingly.
Figure 6. Distribution of parameter ξ (see “Methods” section). (a) control untreated sample and (b) sample treated by 0.05 mM of GA and (c) sample treated by 0.5 mM of GA.
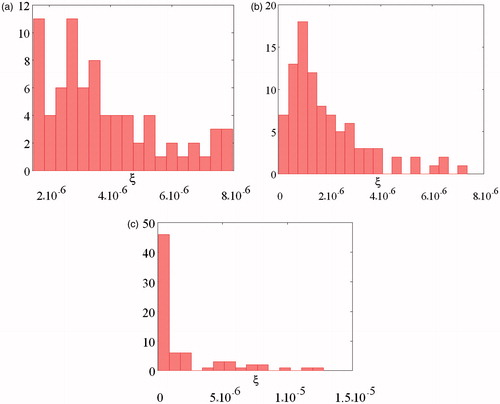
These results point to the relative decrease of the membrane elasticity modulus the in the presence of GA as compared with untreated membrane. Decrease of the elasticity modulus means that cells become less resistance to the elastic deformation. In addition, the distribution of elasticity modulus becomes narrower in the presence of GA. Concentration of 5 × 10⁻⁵ M is the minimum concentration of GA at which the effect was observed. The experiments at concentrations above 0.5–1 mM GA are complicated due to low absorbance of RBCs by glass surface treated with polylysine.
Discussion
Summarizing the results, we can say that all of the observed effects have dose-dependent characteristics, which correlates with the available data obtained by physicochemical studies of the GA solutions properties (James & Stanford, Citation1962; Kornievskaya et al., Citation2007a, Kornievskaya et al., Citation2007b; Ragino et al., Citation2008; Vavilin et al., Citation2008; Polyakov & Leshina, Citation2011). The minimum concentration of GA, at which the effect of increasing the membrane permeability was observed, is 10−5 M. This concentration corresponds to the published data on the formation of GA pre-micellar states (Romanenko & Murinov, Citation2001; Francis et al., Citation2002; Polyakov et al., Citation2006). It is notable that the most significant increase in permeability occurs at this concentration. The further increase in penetration rate of sodium formate through the membrane (up to 60%) was detected at a GA concentration near 10−3 M, which corresponds to the micelle-formation concentration (Romanenko & Murinov, Citation2001; Kornievskaya et al., Citation2007a, Kornievskaya et al., Citation2007b). Similar non monotonic dependences on GA concentration were earlier observed for changes in canthaxanthin fluorescence and nifedipine solubility (Polyakov et al., Citation2006; Polyakov et al., Citation2008).
It was also found that incubation of erythrocytes in a GA solution for 20–30 min resulted in a decrease in the elasticity modulus of the erythrocyte membrane by an order of magnitude, as well as a decrease in the distribution width of the membrane elasticity modulus. This means that cells become less resistant to the elastic deformation. The membrane flexibility is an important property of erythrocytes. Normal RBCs are able to easily change shape under the influence of external forces. This ability allows cells to pass through the capillaries, whose inner diameter is smaller than the diameter of erythrocyte. Certain hereditary diseases cause erythrocytes to become more rigid, which restricts the circulation. Increasing the erythrocyte membranes elasticity in the presence of GA may have a beneficial effect on blood circulation.
The permeability of cell membranes, in particular erythrocyte, for various molecules is a necessary condition for normal functioning cells. Transport of substances through the membrane occurs in different ways: hydrodynamically (by diffusion), when the substances pass through the membrane pores filled with water, or by penetration through lipid areas, if the substance is fat soluble. Some substances can easily enter into reversible binding with built-in membrane molecules, vectors and then either passively (or as a result of so-called active transport) pass through the membrane. However, the rate of such a passive diffusion, for example, transition of a substance through a membrane from a region of higher concentration to an area with low concentration, may differ for different molecules. The diffusion rate of substances through the membrane depends mainly on the size of the molecules, the electric charge (polarity) and the relative fat solubility. The membrane fluidity, permeability and stiffness might be considered as indicators of the membrane transport capacity. These parameters may vary with different lipid disorders, including changes in the concentration of free cholesterol in the membranes.
Taking into account these considerations, we suppose two different mechanisms of the observed effects, which can work separately or simultaneously in a dose-dependent manner. The first mechanism is incorporation of glycyrrhizin molecules into the lipid membrane. The second mechanism is the extraction of membrane cholesterol from the lipid bilayer. By incorporating into the membrane, GA may affect the location and ordering of lipids and increase the permeability of membranes, thus facilitating the drug penetration into the cell. This might be the reason for a number of published observations of the reduction of the therapeutic dose of some drugs in the presence of GA (Novikov et al., Citation1992; Tolstikova et al., Citation2009; Maurya & Srivastava, Citation2011; Polyakov & Leshina, Citation2011). Enhancement in cell membrane permeability in the presence of GA could partially determine its effect on drug bioavailability.
Similar effect on the properties of cell membrane can be achieved by changing the concentration of free cholesterol in the membranes. It is well known that cholesterol is the component of cell membranes, which affects their fluidity. It is important to note that the aging of cell membranes, in particular erythrocyte membrane, is mainly due to the accumulation of cholesterol. This is why such a broad distribution of elasticity modulus was observed for untreated erythrocytes (). From this point of view, a more narrow distribution of elasticity modulus for erythrocytes treated with GA is an argument in favor of the latter mechanism. Another contribution to the broad distribution of elasticity modulus might be the presence of lipid rafts – micro domains with enhanced cholesterol concentration – in the membrane. The heterogeneity of cell membranes is undisputed (for example, ), but the role of intramembrane rafting in their functional and mechanical properties promotes vigorous debate (Hancock, Citation2006). It was shown, for example, that particular extraction of membrane cholesterol by cyclodextrin results in destruction of lipid rafts (Chubinskiy-Nadezhdin et al., Citation2011). We suppose that the observed effects of increasing membrane elasticity and the narrowing distribution of elasticity modulus in the presence of GA might be due to extraction of membrane cholesterol. This can result in particular destruction of the lipid rafts and possibly causes cell rejuvenation.
The unusual finding is the formation of nanosized aggregates (20–40 nm) on the surface of RBCs in the presence of GA in solution. Taking into account that the size of these aggregates is much higher than the diameter of GA micelles, we can suggest that these formations are the insoluble cholesterol–glycyrrhizin complexes. The formation of such water-insoluble aggregates was investigated earlier in methanol solution by NMR relaxation techniques (Gluschenko et al., Citation2011). It should be noted that there is also some data on the effect of saponins – a class of compounds consisting of a sugar fragment and a hydrophobic aglycone – on the permeability of erythrocyte membranes. Various representatives of saponins have an affinity to cholesterol and can form insoluble complexes with it, integrate with the membrane and extract cholesterol, thus increasing their fluidity and permeability (Glauert et al., Citation1962; Gogelein & Huby, Citation1984; Hu et al., Citation1996; Francis et al., Citation2002). Taking into account our own observation of GA complexes with cholesterol and the increasing in the permeability of erythrocyte membranes in the presence of GA, we can assume that GA molecules extract membrane cholesterol resulting in the change of the properties of the membranes (Loftsson & Duchene, 2007). In addition, hydrophobic aglycone fragments of glycyrrhizin could also intercalate also into the hydrophobic interior of the membrane. Both these effects may contribute to the alteration of the lipid environment around membrane proteins, including ion channels, transporters and receptors, which play an important role in their functions.
Conclusions
The ability of GA to change the properties of cell membranes, even at micromolar concentrations, has been established in this work. The increase in permeability (about 60%) and decrease in elasticity modulus (by order of magnitude) of cell membranes can provide new insight into the mechanism of enhancement of drugs bioavailability in the presence of GA, as well as into the mechanism of its own biological activity. GA can be considered as an effective drug carrier, which enhances the solubility of low soluble drugs, as well as enhances their penetration through cell membranes. The cholesterol-lowering effect of glycyrrhizin and increase of erythrocyte elasticity are also very important features and can find wide practical application. A number of drug formulations, which contain saponins (diosponin and polisponin) are already known (Francis et al., Citation2002). They are quite effective, especially in the early stages of atherosclerosis, but the mechanism of their anti-atherosclerotic action is poorly understood. We suppose that these results will stimulate the further discussion on the mechanisms of biological activity of a new generation of DDSs.
Declaration of interest
This publication is supported by a grant 12-03-31183 from the Russian Foundation for Basic Research, and a grant RUC-7067-NO-12 from the U.S. Civilian Research & Development Foundation (CRDF Global) with funding from the United States Department of State.
References
- Asl MN, Hosseinzadeh H. (2008). Review of pharmacological effects of glycyrrhiza sp, and its bioactive compounds. Phytother Res 22:709–24
- Azaz E, Segal R. (1980). Glycyrrizin as gelling agent. Pharm Acta Helv 55:83–186
- Baklanova NI, Zaitsev BN, Titov AT, Zima TM. (2008). The chemistry, morphology, topography of titanium carbide modified carbon fibers. Carbon 46:261–71
- Bogachek MV, Protopopova EV, Loktev VB, et al. (2008). Immunochemical and single molecule force spectroscopy studies of specific interaction between the laminin binding protein and the West Nile virus surface glycoprotein E domain II. J Mol Recognit 21:55–62
- Borisenko SN, Lekar AV, Milov AA, et al. (2013). Mass-spectrometry and quantum-chemical study of self-association processes of glycyrrhizinic acid molecules. Chem Plant Mater 2:85–92
- Butt HJ, Cappella B, Kappl M. (2005). Force measurements with the atomic force microscope technique, interpretation and applications. Surf Sci Rep 5:91–152
- Chubinskiy-Nadezhdin VI, Negulyaev YA, Morachevskaya EA. (2011). Cholesterol depletion-induced inhibition of stretch-activated channels is mediated via actin rearrangement. Biochem Biophys Res Commun 412:80–5
- Colon T, Outhred R. (1972). Water diffusion permeability of erythrocytes using an NMR technique. Biochim Biophys Acta 288:354–61
- Francis G, Kerem Z, Makkar HPS, Becker K. (2002). The biological action of saponins in animal systems a review. Brit J Nutr 88:587–605
- Gilbert RJ, James KC. (1964). Purification of glycyrrhizates through the lead salt. J Pharm Pharmacol 16:394–9
- Glauert AM, Dingle JT, Lucy JA. (1962). Action of saponin on biological cell membranes. Nature 196:953–5
- Gluschenko OY, Polyakov NE, Leshina TV. (2011). NMR relaxation study of cholesterol binding with plant metabolites. Appl Magn Res 41:283–94
- Gogelein H, Huby A. (1984). Interaction of saponin and digitonin with black lipid membranes and lipid monolayers. Biochim Biophys Acta 773:32–8
- Hancock JF. (2006). Lipid rafts contentious only from simplistic standpoints. Nat Rev Mol Cell Biol 7:456–62
- Hibasami H, Iwase H, Yoshioka K, Takahashi H. (2006). Glycyrrhetic acid (a metabolic substance and aglycon of glycyrrhizin) induces apoptosis in human hepatoma, promyelotic leukemia and stomach cancer cells. Int J Mol Med 17:215–9
- Himmelreich U, Chapman BE, Kuchel PW. (1999). Membrane permeability of formate in human erythrocytes NMR measurements. Eur Biophys J 28:158–65
- Hu M, Konoki K, Tachibana K. (1996). Cholesterol-independent membrane disruption caused by triterpenoid saponins. Biochim Biophys Acta 1299:252–8
- Jain KK. (2008). Drug delivery systems. : Humana Press
- James KC, Stanford JB. (1962). The solubilising properties of liquorice. J Pharm Pharmacol 5:445–50
- Kornievskaya VS, Kruppa AI, Polyakov NE, Leshina TV. (2007a). Effect of glycyrrhizic acid on lappaconitine phototransformation. J Phys Chem 111:11447–52
- Kornievskaya VS, Kruppa AI, Leshina TV. (2007b). NMR and photo-CIDNP investigations of the glycyrrhizinic acid micelles influence on solubilized molecules. J Incl Phenom Macrocycl Chem 60:123–30
- Loftsson T, Duchene D. (2007). Сyclodextrins and their pharmaceutical applications. Int J Pharm 329:1–11
- Maciaszek JL, Andemariam B, Lykotrafitis G. Microelasticity of red blood cells in sickle cell disease. 2011. J Strain Anal Eng Des 46:368–79
- Maurya SK, Srivastava AK. (2011). Glycyrrhizic acid attenuates the expression of HMG-CoA reductase mRNA in high fructose diet induced dyslipidemic hamsters. Prague Med Rep 112:29–37
- Nafisi S, Manouchehri F, Bonsaii M. (2012). Study on the interaction of glycyrrhizin and glycyrrhetinic acid with RNA. J Photochem Photobiol 111:27–34
- Novikov DK, Mukhamedova NA, Lakeev IV, et al. (1992). Effect of mevinolin and glycyrrhizinic acid on cholesterol and bile acid metabolism in cultured rabbit hepatocytes. Biokhimiia 57:897–903
- Polyakov NE, Leshina TV. (2011). Glycyrrhizic acid as a novel drug delivery vector. Synergy of drug transport and efficacy. Open Conf Proc J 2:64–72
- Polyakov NE, Leshina TV, Salakhutdinov NF, Kispert LD. (2006). Host-guest complexes of carotenoids with β-glycyrrhizic acid. J Phys Chem B 110:6991–8
- Polyakov NE, Khan VK, Taraban MB, Leshina TV. (2008). Complex of calcium receptor blocker nifedipine with glycyrrhizic acid. J Phys Chem B 112:4435–40
- Polyakov NE, Magyar A, Kispert LD. (2013). Photochemical and optical properties of water-soluble xanthophyll antioxidants: aggregation versus complexation. J Phys Chem B 117:10173–82
- Pompei R, Paghi L, Ingianni A, Uccheddu P. (1983). Glycyrrhizic acid inhibits influenza virus growth in embryonated eggs. Microbiologica 6:247–50
- Ragino YI, Vavilin VA, Salakhutdinov NF, et al. (2008). Antioxidant and endothelium-stabilizing effects of simvaglyzin on rabbits with experimental hypercholesterolemia. Bull Exp Biol Med 145:285–7
- Romanenko TV, Murinov YI. (2001). Some features of the flow of dilute solutions of glycyrrhizic acid. J Phys Chem 75:1601–4
- Saeedi M, Morteza-Semnani K, Ghoreishi MR. (2003). The treatment of atopic dermatitis with licorice gel. J Dermatolog Treat 14:153–7
- Takeuchi M, Miyamoto H, Sako Y, et al. (1998). Structure of the erythrocyte membrane skeleton as observed by atomic force microscopy. Biophys J 74:2171–83
- Tolstikova TG, Khvostov MV, Bryzgalov AO. (2009). The complexes of drugs with carbohydrate-containing plant metabolites as pharmacologically promising agents. Mini Rev Med Chem 9:1317–28
- Utsunomiya T, Kobayashi M, Pollard RB, Suzuki F. (1997). Glycyrrhizin, an active component of licorice roots, reduces morbidity and mortality of mice infected with lethal doses of influenza virus. Antimicrob Agents Chemother 41:551–6
- Vavilin VA, Salakhutdinov NF, Ragino YI, et al. (2008). Hypocholesteremic properties of complex compound of simvastatin with glycerrhizic acid (simvaglizin) in experimental models. Biomed Chem 54:301–13
- Vileno B, Lekka M, Sienkiewicz A, et al. (2007). Stiffness alterations of single cells induced by UV in the presence of nanoTiO2. Environ Sci Technol 41:5149–53
- Yakovishin LA, Lekar AV, Vetrova EV, et al. (2012). Molecular complexes of the triterpene glycosides with L-tyrosine and their biological activity. Biopolymers Cell 28:62–7 (translated from Russian)
- Zhang PC, Bai C, Huang YM, et al. (1995). Atomic force microscopy study of fine structures of the entire surface of red blood cells. Scanning Microsc 9:981–9