
Abstract
Purpose: The purpose of the present study was to formulate and evaluate nanosuspension of Valsartan (VAL), a poorly water soluble and low bioavailable drug (solubility of 0.18 mg mL−1; 23% of oral bioavailability) with the aim of improving the aqueous solubility thus the bioavailability and consequently better anti-hypertensive activity.
Methods: Valsartan nanosuspension (VAL-NS) was prepared using high-pressure homogenization followed by lyophilisation. The screening of homogenization factors influencing nanosuspension was done by 3-factorial, 3-level Box-Behnken statistical design. Model suggested the influential role of homogenization pressure and cycles on drug nanosizing. The optimized formulation containing Poloxamer−188 (PXM 188) was homogenized for 2 cycles at 500 and 1000 bar, followed by 5 cycles at 1500 bars.
Results: The size analysis and transmission electron microscopy showed nanometric size range and uniform shape of the nanosuspension. The in vitro dissolution showed an enhanced release of VAL from nanosuspension (VAL-NS) compared to physical mixture with PXM 188. Pharmacodynamic results showed that, oral administration of VAL-NS significantly lowered (p ≤ 0.001) blood pressure in comparison to non-homogenized VAL (VAL-Susp) in Wistar rat. The level of VAL in rat plasma treated with VAL-NS showed significant difference (p ≤ 0.005) in Cmax (1627.47 ± 112.05 ng mL−1), Tmax (2.00 h) and AUC0→24 (13279.2 ± 589.426 ng h mL−1) compared to VAL-Susp that was found to be 1384.73 ± 98.76 ng mL−1, 3.00 h and 9416.24 ± 218.48 ng h mL−1 respectively. The lower Tmax value, proved the enhanced dissolution rate of VAL.
Conclusion: The overall results proved that newly developed VAL-NS increased the plasma bioavailability and pharmacodyanamic potential over the reference formulation containing crude VAL.
Introduction
Nowadays nanotechnology is present in all aspects of life. From the field of biotechnology, pharmaceuticals to cosmetics, medical and food industry, the power of nanosizing is very much evident. Around 40% of new chemical entities (NCEs) in the developmental pipeline are facing the challenges of poor aqueous solubility (Speiser, Citation1998). Poorly soluble drugs face the problem of low oral bioavailability and erratic absorption due to their low-dissolution velocity and saturation-solubility (Zhang et al., Citation2007). In order to overcome this problem, numerous approaches have been developed. Among them, formulation approach is considered a better avenue, as it does not bring any changes in the chemical structure of the molecules and hence there is no any alteration in pharmacological activity. However, the success of formulation approach is also limited, as it requires the drugs to have specific properties as incase of complexation (Ahuja et al., Citation2011). For solubility and bioavailability enhancement, nanoformulations and drug nanonization happens to be a universal formulation approach to overcome these problems (Zhang et al., Citation2007). Nanocrystals enhances absorption rate and oral bioavailability of hydrophobic drug molecules in the biological system (Liversidge & Conzentino, Citation1995). Nanosuspensions obtained after drug nanosizing results in an increase of dissolution profile and saturation solubility of hydrophobic molecules. It acts by decreasing particle size and solvation energy of the hydrophobic molecules. They are a carrier free submicron colloidal drug delivery system containing surface-active agents or polymeric stabilizers (Zhang et al., Citation2007). Nanosizing technique does not require any specific characteristics of therapeutic molecules. Therefore this technique can be used for hydrophobic drug molecules to increase their solubility (Moschwitzer & Muller, Citation2007). The high-pressure homogenization method used for drug nanosizing is simple, fast, cost effective, reproducible (Keck and Muller, Citation2006; Grau et al., Citation2000) and can help in reducing the desired dose, thereby decreasing the side effects Pawar et al. (Citation2014).
Valsartan (VAL) is a poorly soluble drug having a low aqueous solubility of 0.18 mgmL−1 with only 23% of oral bioavailability (Moffat, Citation2011). Extensive patent and research work review has revealed that various formulation approaches like polymorphism (Rukhman et al., Citation2006), self-emulsifying drug-delivery systems (Mahajan et al., Citation20110; Dixit et al., Citation2010); complexation (Nalawade et al., Citation2009) and solid dispersions (Park et al., Citation2010; Sharma & Jain, Citation2010; Verma et al., Citation2009) has been prepared to overcome the problem of low-solubility and bioavailability issue of VAL. Recently, a work on VAL nanosizing for increasing the oral bioavailability has been reported (Ma et al., Citation2013). In this study, VAL-NS was prepared by high speed dispersing and anti-solvent precipitation method and converted into powders through spray drying. After 6 months of storage at room temperature, recrystallization was observed. Therefore, present study was design to prepare nanosuspension formulation of VAL using poloxamer-188 as stabilizer and mannitol as a cryoprotectant by high-pressure homogenization followed by lyophilization for improving the aqueous solubility and bioavailability. Poloxamer is water-soluble triblock copolymer composed of hydrophilic polyethylene oxide (PEO) and hydrophobic polypropylene oxide (PPO) blocks linked together. Several members of this poloxamer family (such as poloxamer 188 and 407) are known to be biocompatible and non-toxic to mammalian cells and tissues, making them useful for biomedical applications. These excipients are surface acting agents and usually incorporate themselves onto the cell membrane thus reducing protein adsorption and cell adhesion (Adam & Rodeheaver, Citation2010). This may lead to longer systemic circulation time. In this study, mannitol was used as a cryoprotectant to prevent the recrystalization process as encounter in earlier research work (Ma et al., Citation2013). Mannitol is freely water soluble excipient which provides stability to solid dispersions by virtue of its very high chemical inertia and lack of water absorption property.
Experimental
Chemicals
Gift sample of valsartan was provided by Jubilant Life Sciences Ltd. (Noida, India) and poloxamer 188 was obtained as a gift sample form BASF (Mumbai, India). Mannitol, potassium dihydrogen phosphate and sodium acetate were purchased from S.D. Fine Chemicals Ltd. (Mumbai, India). Similarly, HPLC grade water was obtained from Milli-Q water purification system (Millipore, Billerica, MA). All other chemicals used were of pharmaceutical grade.
Analytical methodology
All the in vivo data was analyzed using validated RP-HPLC method (Zarghi et al., Citation2008). The chromatographic system consisted of Shimadzu HPLC system (Tokyo, Japan) equipped with LC-10 AD pump and UV detector. The chromatographic separation was achieved on Lichrocart® (Buffalo, NY) C18 reversed-phase analytical column (250 mm × 4.6 mm, particle size 5 μm) and a C18 precolumn of the same packing (10 mm × 4.6 mm). The mobile phase consisted of acetonitrile and phosphate buffer (15 mM, pH 3) used in the ratio of 45:55 v/v. All samples were analyzed under isocratic elution at a flow rate of 1 mL/min with the column temperature maintained at 25 °C ± 2 °C and a total run time of 11 min. UV-detection of VAL was performed at 225 nm. For in vivo sample analysis, the reported method was validated after spiking and extracting the VAL from plasma using liquid-liquid extraction technique. The extract were collected and stored in deep freezer for analysis.
Formulation and optimization of valsartan nanosuspension
Nanosuspension was prepared after dispersing the drug in water containing stabilizer PXM 188. This suspension of insoluble drug along with stabilizer was further subjected to particle size reduction using high-energy input device. The preparation of VAL-NS was carried out by high-pressure homogenization (Stansted Fluid Power Ltd., Harlow, UK) followed by lyophilisation (Heto Dry winner, Waltham, MA). Poloxamer 188 was dissolved in 100 ml of water and 1 gm of VAL was added slowly with continuous stirring at 200 rpm for 45 minutes. The coarse suspension obtained was pre-homogenized for 2 cycles at 500 bar pressure, followed by 2 cycles at 1000 bar pressure. Finally, the resultant suspension was homogenized again for 5 cycles at 1500 bar. After high pressure homogenization step, the resultant suspension was lyophilized using mannitol (1–4% w/v) as cryoprotectant to obtain VAL nanosuspensions.
Design-expert supported optimization
Preliminary experiments showed that, concentration of stabilizer was an important formulation variable significantly affecting the formation of stable nanosuspension. Similarly, in homogenization process, both the homogenization pressure and number of homogenization cycles affected particle size reduction. Therefore, systematic approach was used to see the effect of various formulation and process variables on the formation and stability of nanosuspension. A three factors, three levels Box-Behnken design was used in this study to construct a second order polynomial model for the optimization process. The three independent variables followed by two levels were stabilizer concentration (60% to 20%), homogenization pressure (1500 bar to 500 bar) and number of homogenization cycles (5 to 1) and the dependent variable studied was particle size as shown in . The design selected was suitable for exploring quadratic response surfaces. This design provides an empirical mathematical model to describe the effect of process variables on the product characteristics. The experimental design was created using Design-Expert® software (version 8.0.7.1, Stat-Ease Inc., Minneapolis, MN) as shown in .
Table 1. Independent variables and their matching levels for nanosuspension preparation.
Table 2. Twenty-three full factorial design consisting of experiments for the study of three experimental factors with experimental and predicted values.
To optimize the number of homogenization cycles required to achieve the mean particle size of 100–500 nm at 1500 bar pressure, one factor at a time (OFAT) model was applied. In this, the above method was employed to obtain a pre-homogenized suspension and after that 1–5 homogenization cycles were applied at 1500 bar and the optimized formulation was selected on the basis of particle size and size distribution analysis.
Screening of cryoprotectant
Nanosuspension was prepared in aqueous environment using HPH. The thermodynamic driven tendency of aqueous phase to lower interfacial tension by increasing the surface area increases the chances of aggregation. Lyophilization increases the stability and the shelf life of the finished product by preserving it in a relatively more stable dry state as lyophilized cake needs to be reconstituted with water prior to administration. Nano-suspensions integrity on freeze drying in presence of properly selected cryoprotectants is an important factor for governing the efficiency of freeze drying process. For the present study, mannitol was tried as a cryoprotectant in different concentration ranging from 1 to 4% (w/v).
Characterization of valsartan nanosuspension
Particle size and size distribution analysis
The average size and polydispersity index of the nanosuspension was determined by photon correlation spectroscopy (Nano ZS90, Malvern Instrument, Worcestershire, UK) which is based on the principle of dynamic light scattering. In DLS, the sample is illuminated with a laser beam and the intensity of the resulting scattered light produced by the particles fluctuates at a rate that is dependent upon the size of the particles. Analysis of these intensity fluctuations yields the diffusion coefficient of the particles and hence the particle size. The measurements were performed using a He-Ne laser at 633 nm by using Avalanche photo diode detector. The cell used was standard and small volume disposable polystyrene cuvette. All measurement was carried out at 25 °C.
Transmission electron microscopy
Transmission Electron Microscope (TEM) was employed for the microscopic evaluation of optimized formulations using TEM CM-10 (Philips, Eindhoven, Netherlands). For evaluation a drop of nanosuspension was applied on carbon coated grid with 2% phospho-tungestic acid and it was left for 30 sec. The dried coated grid was taken to a slide and after placing the cover slip, the sample was air dried in a vacuum dryer and observed under TEM operated at 60–80 KV using different magnifications (1550 × , 2150x, 4600×, 21 500× and 44 000×).
In vitro drug release
In vitro release of VAL from pure drug, physical mixture and optimized formulation were studied in basket type dissolution apparatus. Two milliliter of sample that is equivalent to 20 mg drug was placed in treated dialysis bag (MWCO 12 000 gm/mole, Sigma, St. Louis, MO) and put inside the basket. The dialysis bag was dipped into the dissolution basket containing phosphate buffer (pH 6.8), and continuously stirred at 50 rpm maintained at 37 °C ± 0.5 °C. At predetermined time intervals (5, 10, 15, 20, 25, 30, 35, 40, 45 min), five ml sample was withdrawn and was replaced immediately with the same volume of fresh media. The samples were analyzed for the drug content spectrophotometrically at 250 nm. Furthermore, in vitro release data was plotted against the sampling time to describe the mathematical release kinetics models of the VAL such as zero-order, first-order, Higuchi model and Peppas model. The criterion for selecting the most appropriate model was based on the goodness of fit test.
Saturation solubility
The saturation solubility of VAL–PXM 188 physical mixture and optimized VAL-NS formulation was carried out in phosphate buffer (pH 6.8). An excess amount of the sample was dispersed into this medium and shaken on a water-bath for 48 h maintained at 37 °C ± 0.5 °C. The obtained dispersion was further centrifuged at 5000 rpm for 20 min. The supernatant was separated out and filtered with syringe filter. Filtered samples were diluted appropriately and concentration was determined spectrophotometrically at 250 nm.
Pharmacokinetic study
The wistar rats (n = 6) were kept under standard laboratory conditions at 25 °C ± 0.2 °C and relative humidity of 55% ± 5%. The animals were housed in polypropylene cages, six per cage, with free access to standard laboratory diet (Lipton feed, Mumbai, India) and water ad libitum. The formulations were given orally using oral feeding needle with the calculated dose of 2.88 mg/day. The rats were anesthetized using ether and blood samples (250 µl per time point) were withdrawn from the tail vein of rat at 0 (pre-dose), 0.5, 1, 2, 3, 4, 8, 10 and 24 h in pre-coated EDTA tubes. For each sampling time point, 6 animals were used. The blood collected was mixed properly with anticoagulant (EDTA) and centrifuged at 5000 rpm for 20 min. The plasma was separated and stored at −21 °C until drug analysis was carried out using RP-HPLC method.
The obtained data were used for the calculations of different pharmacokinetics parameters. Plasma concentration–time profiles of VAL after oral delivery of VAL-Susp and VAL-NS were evaluated by pharmacokinetic software (PK Functions for Microsoft Excel, Pharsight Corporation, Mountain view, CA). The statistical significance of pharmacokinetic parameter differences among the treatment groups were analyzed by Student’s t-test and statistical significance were defined by P ≤ 0.05. The maximum plasma concentration of VAL (Cmax) and the time required to reach the maximum concentration (tmax) were obtained directly from the actual plasma profiles. The area under the curve between 0 to 24 h, AUC, AUMC0-t, KElim (elimination rate constant) and T1/2 (half life) were calculated using the PK software.
Pharmacodynamic study
Approval to carry out the in vivo studies was obtained from the Institutional Animal Ethics Committee of Jamia Hamdard, protocol no. 884 (Reg. No.: 173/CPCSEA, Jamia Hamdard, New Delhi) and their guidelines were followed for the studies. The preclinical assessment of antihypertensive activity of the developed formulation was performed on hypertensive rats.
Sixteen Wistar albino rats weighing around 200–250 g were procured from the central animal facility of Jamia Hamdard, New Delhi. The rats were immediately weighed on procurement and marked distinctly with picric acid solution for easy identification. They were kept in the rat cages in the well controlled environment in faculty animal house. The rats were acclimatized for at least 3 weeks before experimentation, fed with standard diet, and allowed water ad libitum. All animal experiments were evaluated and approved by the Animal Ethics Committee of Jamia Hamdard, New Delhi.
Protocol for antihypertensive study
The restrainer (animal holder) was an unfamiliar environment for the rats, so they had to be trained for their stay in a calm and non-aggressive manner to reduce the fluctuation in the BP reading. The rats were made to undergo a stay in the restrainer twice daily for 15 min for three weeks, which made them habitual to the above environment. The BP of all the rats was recorded using non-invasive BP measuring instrument (NIBP 200A, BIOPAC System Inc, Goleta, CA). The rats were bracketed in four groups i.e. non-hypertensive treated with saline (Group I), the hypertensive group treated with saline (Group II), the hypertensive group treated with a non-homogenized drug suspension (Group III) and the hypertensive group treated with VAL-NS (Group IV) each carrying four animals. Hypertension was induced by methyl Prednisolone acetate (MPA, Depo-Medrol; Pfizer, Mumbai, India) with a dose of 20 mg/kg/week administered subcutaneously for 2 weeks (Ahad et al., Citation2011). Group II rats served as hypertensive control and received no further treatment. After MPA treatment group III received an oral suspension of VAL (2.88 mg/day). Group IV was treated with VAL-NS. The tail of the rat was gently passed through the cylindrical transducer until the central portion of the tail came in contact with the transducer membrane. The transducer was connected to the main BP recording device with a digital display showing average systolic BP. Once the pulse level ready signal showed up on the display, the BP recording button was pressed & the systolic BP was recorded. The BP of rats was recorded at 0, 1, 2, 4, 8, 12, 24 h and mean BP was compared with that of Group I. A graph was plotted showing the comparative mean systolic BP of rats of control and test groups versus time. The obtained data were statistically analyzed using paired t-test and p value of 0.05 was considered significant.
Physical and chemical stability
Three packs of the optimized formulation were subjected to stability studies. The samples were subjected to 30 ± 2 °C and 4 ± 0.5 °C for 90 days. At the end of specified time interval (0, 30, 60 and 90 days), samples were investigated for particle size and VAL content.
Results and discussion
Formulation and optimization of valsartan nanosuspension
High energy input is often required in the production of nanosuspension. Therefore, a high-pressure homogenization using Stansted homogenizer (Stansted®, UK) was employed to obtain nanosized drug particles. Homogenization pressure was a key variable that was expected to have a prominent effect on resultant particle size in drug nanosizing. For the present study, two pressure levels used were 500 bar and 1500 bar. In homogenization, with an increase of 100 bar pressure, there was ≥4 °C temperature rise of the system. In this study, a starting pressure of 500 bar was used and thereafter 1500 bar. It was observed that there was a tremendous increase in temperature of the reaction mixture which could have adversely affected the formulation. Therefore, homogenization was followed with the immediate cooling under ice-bath. After the high-pressure homogenization, stabilizers are the most important factor in maintaining the stability of nanosuspensions. PXM 188 was used as the stabilizer as it is already approved for use in Diovan® oral solution (VAL oral solution), hence suggesting that no compatibility issue exists with VAL. Based on patents study (Liversidge et al., Citation1992; Cunningham & Liversidge, Citation2005), 20% concentration was selected as the lowest limit and 60% was the upper most limit for drug nanosizing. Sixty percent concentration range is the maximum safe concentration of PXM 188 that can be used in an oral suspension suggested by FDA. With increasing number of homogenization cycles, the probability of larger particles to pass the zone of higher power density in the middle of the gap increases, thus the particle size is expected to be diminuted. Therefore number of homogenization cycles (0–5 cycles) was selected as the third variable. In conclusion, VAL-NS was prepared after dissolving PXM 188 in 100 ml of water. To it 1 gm of VAL was added slowly with continuous stirring at 200 rpm for 45 minutes. The coarse suspension obtained was pre-homogenized for 2 cycles at 500 bar pressure, followed by 2 cycles at 1000 bar pressure. Finally, the resultant suspension was then homogenized for 0–5 cycles at 1500 bar. After high-pressure homogenization step, the resultant solution was lyophilized using 3% w/v mannitol as cryoprotectant which was later reconstituted to obtain nanosuspension.
Design-expert supported factors optimization
Design expert (DOE) is a software tool to help with the design and interpretation of multi-factor experiments so that valid and objective conclusions can be obtained. DOE is a methodology for systematically applying statistics to experimentation. Interactions between various input variables can be detected and quantified by a well implemented DOE (Mujtaba et al., Citation2014). The purpose of this study was to evaluate the effect of three variables, i.e. stabilizer concentration, homogenization pressure and number of homogenization cycles for the preparation of nanosuspensions. Each of the factors had two levels. Hence, 2k factorial design (k = number of factors = 3) was selected. Hence, a total of 23 (= 8) effects which involved the main factors and their interactions – both second order and third order were considered. The nanosuspension formulations were made as per the runs given by Design Expert and the results are shown in ).
The percentage contribution of each independent variable and their interactions on the dependent variable is show in . Coefficients with higher order terms or more than one factor term in the regression equation represent quadratic relationships or interaction terms, respectively. It also shows that the relationship between responses and factors is not always linear. Used at different levels in a formulation or when more than one factors are changed simultaneously, a factor can produce different degree of response. The insignificant terms were taken out of the model and the ANOVA table was obtained from “Design Expert” package. It was found that the p values of the factors like homogenization cycles (B), homogenization pressure (C) and their combined effect (BC) on particle size was found to be highly significant, i.e. P ≤ 0.0016, ≤ 0.0001 and ≤ 0.0022 respectively. These were less than 0.05 which proved statistical significance. Also, the p value of the model was found to be ≤0.0001, which suggested that the model was highly significant. Similarly, the model F-value (172.74) also implies that the model is significant. The “Predicted R-Squared” value of 0.9694 was in reasonable agreement with the “Adjusted R Squared” value of 0.9866. In case where both these values are not close to each other it may indicate a large block effect or a possible problem with the model/or data. Therefore, the selected model can be used to navigate the design space.
Table 3. Percent contribution of each independent variable and their interaction on dependent variable.
Response surface graphs
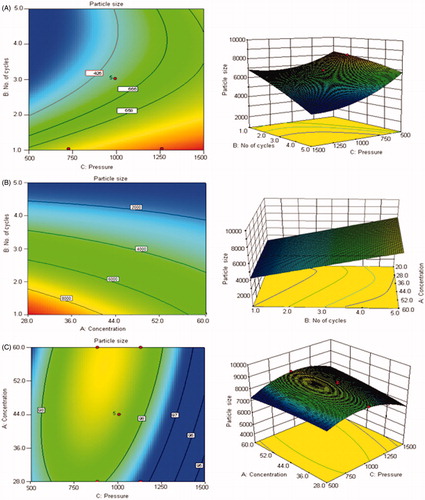
The outcome of two-dimensional contour plots and three-dimensional response surface plots of the selected model is presented in . These types of plots show the effects of two factors on the response at a time. The three-dimensional (3D) response surface graphs and contour plots for identifying the significant variables on the evaluated parameters in terms of particle size is shown in ). The model was significant but could not be applied for achieving the goal of 200–400 nm particle size range (). But the preliminary study gave an understanding of the factors and their contribution in achieving the goal. As seen from the model that concentration of the stabilizer did not have any great impact on the particle size but as found from the previous reports (Liversidge et al., Citation1992; Cunningham & Liversidge, Citation2005) influenced the long-term physical stability, hence upper limit of PXM 188 concentration, i.e. 60% of the drug content was selected. Secondly, it was observed that homogenization pressure was the factor which predominantly controlled the particle size. Hence, 1500 bar was selected as the optimized homogenization pressure. After selecting the stabilizer (Poloxamer 188) concentration and homogenization pressure, further processing was done to obtain nanosuspension in the range of 200–400 nm. To optimize the number of homogenizing cycles OFAT model was used.
Figure 1. Contour plots and three-dimensional (3D) response surface plots showing the effect of number of homogenization cycles and homogenization pressure (A), concentration of stabilizer and number of homogenization cycles (B) and concentration of stabilizer and homogenization pressure on the resultant particle size (C).
One factor (OFAT) model
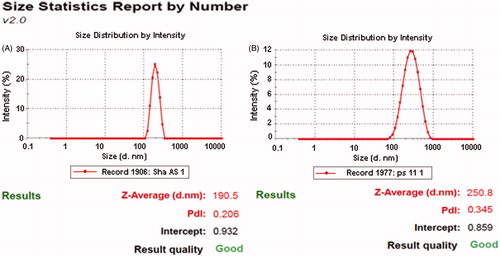
The above method was employed to obtain a pre-homogenized suspension and after that different homogenization cycles (1–5 cycles) were applied at 1500 bar. The optimized formulation was selected on the basis of particle size and size distribution analysis. Poor pre-homogenization cycles lead to considerable affect on particle wettability, inducing poor powder dispersion and severe agglomeration of nanosuspensions. This poor dispersion systematically caused blocking of the homogenizing valve, which interfered with the process. Hence pre-homogenization at lower homogenization pressure was done to avoid that problem. The pre-milling low pressure cycles adopted were 2 cycles at 500 bar followed by 2 cycles at 1000 bar. The pre-homogenized suspension was optimized for number of cycles using the OFAT model. In this the homogenization pressure was kept constant at 1500 bars and the number of homogenization cycles were varied from 1 to 5 and changes in particle size and polydispersity index were measured (). It was found that homogenizing at 1500 bars for 5 cycles gave the smallest particle size of 190.5 nm with a polydispersity index of 0.206.
Table 4. Impact of Homogenization cycles and concentration of cryoprotectant on particle size and PDI of formulations obtained by OFAT model.
Screening of cryoprotectant
The cryoprotectants counter the destabilization of colloidal dispersion of nanosuspensions that is generated by stress during lyophilization because of freezing and dehydration. Mannitol was selected as cryoprotectant as it decreases the osmotic activity of water and crystallization and favors the glassy state of the frozen sample, thus preventing aggregation (Hinrichs et al., Citation2006). Therefore, mannitol was selected as a cryoprotectant and its different concentrations ranging from 1 to 4% (w/v) were tried for optimization. The particle size and polydispersity index of reconstituted lyophilized nanosuspensions with distilled water and the time required for re-dispersion was observed. The results showed that the mean particle size decreased with increasing amounts of mannitol (). It may be attributed to the prevention of aggregation of the lyophilized nanosuspensions. Formulation with 3% (w/v) mannitol resulted in the smallest mean particle size of 250.8 nm, with a monomodal size distribution where as use of ≥3% (w/v) mannitol lead to a linear increase in the size of nanosuspension. Thus, the optimum concentration of 3% (w/v) of mannitol was selected based on the particle size and polydispersity index. The addition of cryoprotectors is necessary to obtain a better redispersion of the dry product. However, when dispersions are dried without a cryoprotectant, the obtained nanosuspensions become concentrated and result in aggregation, i.e. the particles become compact and are difficult to reconstitute as compared to fluffy cakes which are reconstituted easily and quickly when using cryoprotectants. The particle isolation hypothesis refers to the formation of a sugar matrix that acts as a physical barrier between the particles. Both the physical barrier and lack of translational movement prevent aggregation (Hinrichs et al., Citation2005).
Characterization
Particle size and size distribution
The particle size of the VAL-NS was determined before and after lyophilization to study the effect of lyophilization on particle size. Particle size of NS before lyophilization was 190.8 nm with a polydispersity index of 0.206 whereas after redistribution of lyophilized nanosuspensions, the PCS and PI obtained was 250.8 nm and 0.145 respectively suggesting that lyophilization with mannitol led to an increase in particle size as anticipated ().
Figure 2. Particle size and PDI of optimized Valsartan nanosuspensions before (A) and after (B) freeze drying.
Transmission electron microscopy
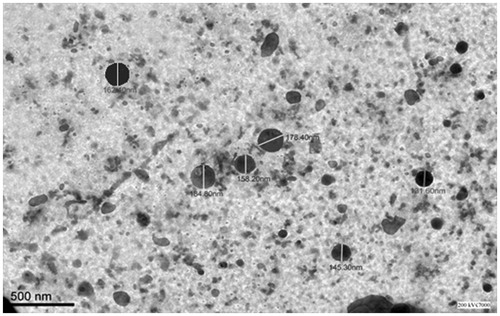
The TEM micrograph of VAL-NS is shown in . The particle size of optimized VAL-NS formulation was found to be less than 200 nm by TEM. TEM results were in good correlation with the results obtained by Zetasizer (Malvern Instruments Ltd, Worcestershire, England) which was found to be 190.5 nm. The TEM micrographs revealed that nanosuspensions were spherical in shape with size below 185 nm (131.60–184.80 nm) in diameter. Due to spherical shape and nano-size particles, the permeation of VAL is expected to be high with lower inter-subject variability (). The differences in particle size can be attributed to the differences in sample preparation and principle of analysis between the two methods (Gao et al., Citation2007).
Figure 3. TEM photograph of optimized VAL-NS formulation.
Saturation solubility
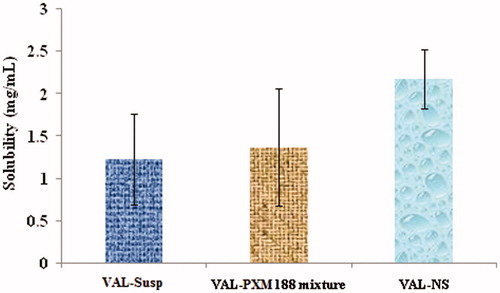
Besides the obvious drug dissolution enhancement characteristics and particle morphology of VAL-NS, the optimized formulations also showed a great extent of increased saturation solubility when compared to the non-homogenized drug and physical mixture (). The saturation solubility of plain drug, physical mixture and nanosuspension formulation in phosphate buffer (pH 6.8) was determined and it was found that the enhancement in solubility was greatly due to decrease in the particle size rather than due to the presence of PXM 188, which was added as a stabilizer and as a surface active agent to the formulation (). The increase in saturation solubility might have been due to an increase in particle-surface curvature that was due to particle-size reduction. Similarly, converting micron into nanosized particles also increased the chances of forming defects in the original crystals habits. These crystal defects lead to various changes like dislocations and crystal lattice energy. The changes in crystal lattice energy give rise to increased surface energy leading to increased saturation solubility (Muller & Peters, Citation1998).
Figure 4. Comparison of saturation solubility of different formulations (p ≤ 0.005**).
In vitro release studies
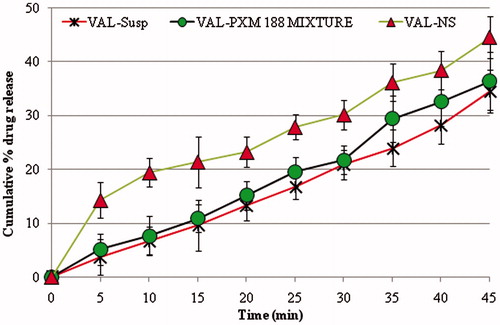
Dissolution studies were performed to compare the release of VAL from VAL-Susp, drug-stabilizer physical mixture and optimized VAL-NS. The nanosuspension showed enhanced release because of reduction in particle size, and eventually higher surface area, which allowed for faster rate of drug release. The in vitro results of plain VAL and VAL-Poloxamer physical mixture showed that addition of a surfactant played a role in enhancement of overall dissolution profile but the result was statistically insignificant (). The significantly higher (p ≤ 0.005) VAL release profile from VAL-NS proved the role of increased in saturation solubility of drug nanosuspension compared to the drug powder. The in vitro release study of VAL-NS showed highest coefficient of correlation for first order release model (r2 = 0.975) compared to the zero order (r2 = 0.946), Peppas order (r2 = 0.909) and Higuchi release model (r2 = 0.969).
Figure 5. Comparative dissolution profile of valsartan from different formulations.
Pharmacokinetic study
The plasma concentration–time profiles of different VAL formulation in the rat at different time interval is shown in . Different PK parameters of VAL were calculated after the oral administration of the VAL-NS and the VAL-Susp formulation in Wistar rats as shown in . Comparative study of the AUC0→24 values showed that, the exposure of simply milled VAL-Susp was significantly low than VAL-NS (). The nanosuspension formulation thus provided higher exposure to the drug as compared to the conventional suspension. The rate and extent of absorption of VAL was higher in group treated with nanosuspension. The plasma concentration–time profiles showed an immediate absorption and point to point maximum absorption of VAL in 24 h sampling profile of nanosuspension (2–24 h) than the conventional suspension (VAL-Susp group). The drug may have dissolved rapidly from the nanosuspension in comparison to the drug suspension and this may have increased the absorption. The plasma concentration of VAL was maintained at a higher level even after 24 h in the group treated with VAL-NS (), although the numbers are not statistically significant (p = 0.076). In terms of Cmax, the maximum concentrations of the oral VAL micronized suspension, i.e. 1384.73 ± 98.76 ng mL−1 were significantly lower as compared to the nanosuspension that was found to be 1627.47 ± 112.05 ng mL−1. With respect to tmax, the values were significantly lower for the VAL-NS (tmax 2.00 hrs) when compared with the formulation containing micronized VAL (tmax 3.00 hrs). There was 1.2-fold increase in Cmax, and 1.4-fold increase in AUC0→24 which significantly proved the potential of drug nanosizing. Similarly, there were significant differences for elimination rate constant (KElim), AUMC0→24 and T1/2 between the formulations with VAL-NS versus VAL-Susp, indicating more rapid absorption of the drug from the colloidal drug delivery systems. In summary, the newly developed nanosuspension showed increased bioavailability over the reference formulation containing micronized VAL.
Figure 6. Plasma concentrations after oral administration of micronized VAL (non-homogenized VAL) and VAL nanosuspension (VAL-NS). Here: *p ≥ 0.05 (significant), **p ≥ 0.005 (very significant), ***p ≥ 0.001 (Extremely significant).
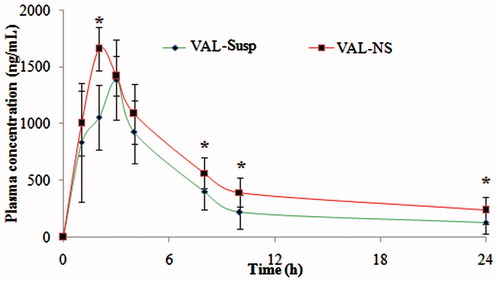
Table 5. Comparative pharmacokinetic parameters of valsartan formulations.
Pharmacodynamic studies
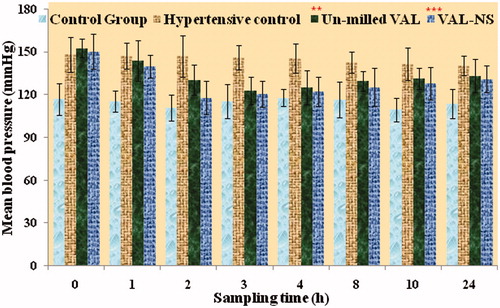
The mean systolic blood pressure of rats prior to inducing hypertension and after induction with methyl prednisolone acetate was recorded. After induction with methyl prednisolone acetate, the groups were treated with different formulations. The BP of rats was recorded at 0, 1, 2, 3, 4, 8, 10 and 24 h after administration of different VAL formulations (suspension and VAL-NS) and was compared with hypertensive control (). The BP recorded for control group ranged between 117.87 to 109.36 mmHg where as BP of hypertension-induced group treated with water was found between 140.41 to 148 mmHg. Similarly, blood pressure of hypertensive group treated with VAL-Susp ranged between 152.5 to 122.54 mmHg where as in VAL-NS treated group, it was in the range of 146.25 to 117.87 mmHg. After comparing the BP of different treatment groups, it was concluded that the blood pressure at each time point in VAL-NS treatment group were found to be significantly low (p ≤ 0.005; ). The maximum lowering of BP in VAL-NS treatment group (117.87 mmHg) was achieved at 2 h post-treatment where as in group treated with VAL-Susp (122.54 mmHg), it was achieved at 3 h. VAL-NS substantially decreased the systolic blood pressure compared to the hypertensive control group treated with vehicle and VAL-Susp. The decrease in blood pressure after oral administration of VAL-NS was also found to be faster and significantly (p < 0.001) high compared to oral administration of VAL-Susp. The fastest action of VAL-NS compared to other formulation proved the significant role of drug nanosizing and hence fastest absorption.
Figure 7. Comparative BP of control, hypertensive control, non-homogenized valsartan suspension and valsartan nanosuspension (VAL-NS) treated groups at different time intervals. Here: *p ≥ 0.05 (significant), **p ≥ 0.005 (very significant), ***p ≥ 0.001 (Extremely significant).
Stability studies
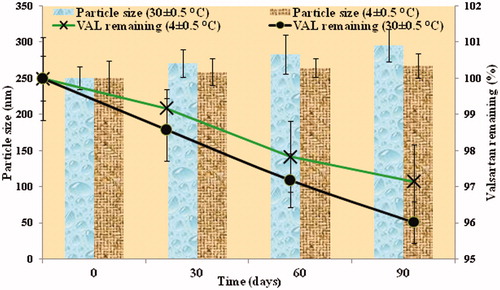
Optimized nanosuspension was stored at different temperatures (room temperature and refrigerated temperature) for 3 months. Particle size of nanosuspension formulation was measured after 30, 60 and 90 days. The results are shown in ). For nanosuspensions, particle size increased from 250.8 nm to 296.3 nm in 90 days stored at room temperature (RT), while at refrigerated condition (RF) it increased from 250.8 nm to 267.5 nm. The crystal growth could be explained due to Ostwald ripening. Thus, it is recommended to store the nanosuspensions under refrigerator condition to minimize increase in particle growth during storage. Assay results of VAL in nanosuspension formulation after 30, 60 and 90 days stored at room temperature (RT) and refrigerated conditions (RF) are shown in ). The amount of VAL remaining in the formulation was dependent on the storage condition. The chemical stability observed was satisfactory in both conditions for 3 months and VAL content was more than 95% in all storage conditions. But, the degradation of the drug was more at room temperature as compared to that at the refrigerated condition (). Thus it was concluded that storage at refrigerated condition was more appropriate for VAL-NS. It can also be concluded that the chemical stability of VAL was not affected due to homogenization and the formulation was found stable even after 3 months. Further studies are needed to prove long term stability of the nasosuspensions and its effectiveness.
Figure 8. Particle size distribution showing physical stability (A) whereas drug assay showing the chemical stability (B) of the optimized formulation (VAL-NS).
Conclusion
The data obtained in this research work confirm the applicability of high-pressure homogenization method using PXM 188 as a stabilizer for the preparation of VAL-NS. The physicochemical characterization of the optimized VAL-NS was found to be uniform in particle size distribution, smooth shape, increased saturation solubility and enhanced dissolution profile in comparison to the non-homogenized VAL. The optimized method was shown to be simple and easy showing long-term physical and chemical stability. The physical stability study proved that mannitol was efficient in preventing the aggregation of VAL-NS. The nanosuspension exhibited a significantly increase plasma Cmax of VAL, higher plasma half-life due to increased in overall circulation time, and significantly high AUC0→∞ compared with the non-homogenized VAL solution. The methyl prednisolone acetate induced hypertensive rat model showed significant lowering of BP in nanosuspension treated group. The overall results proved that newly developed VAL-NS increased the plasma bioavailability and pharmacodyanamic potential over the reference formulation containing crude VAL.
Acknowledgements
The authors are also thankful to Jubilant Life Sciences Ltd. (Noida, India) for providing Valsartan and BASF (Mumbai, India) for Poloxamer 188 as a gift sample.
Declaration of interest
Authors have no financial and competing interests. The authors have no financial involvement with any organization or entity with financial interests in or financial conflict with the subject matter or material discussed in the manuscript. No writing assistance was utilized in the production of this manuscript. Authors are thankful to All India Council for Technical Education (AICTE), Govt. of INDIA, New Delhi for providing fellowship.
References
- Adam JK, Rodeheaver TG. (2010). Topical poloxamer formulations for enhancing microvascular flow: compositions and uses thereof. US Patent 20100183519
- Ahad A, Aqil M, Kohli K, et al. (2011). Role of novel terpenes in transcutaneous permeation of valsartan: effectiveness and mechanism of action. Drug Dev Ind Pharm 37:583–96
- Ahuja A, Baboota S, Ali J, Mustafa G. (2011). Cyclodextrins as Potential Excipients in Pharmaceutical Formulations: Solubilizing and Stabilizing Effects. In: Erem Bilensoy, ed. Cyclodextrins in pharmaceutics, cosmetics, and biomedicine: current and future industrial applications. CH 2, 12-26; JOHN WILEY & SONS, Inc. DOI: 10.1002/9780470926819
- Cunningham J, Liversidge EM. (2005). Nanoparticulate compositions having a peptide as a surface stabilizer. US Patent 0238725
- Dixit A, Rajput S, Patel S. (2010). Preparation and Bioavailability Assessment of SMEDDS Containing Valsartan. AAPS Pharm Sci Tech 11:314–21
- Gao L, Zhang D, Chen M, et al. (2007). Preparation and characterization of an oridonin nanosuspension for solubility and dissolution velocity enhancement. Drug Dev Ind Pharm 33:1332–9
- Grau MJ, Kayser O, Muller RH. (2000). Nanosuspensions of poorly soluble drugs – reproducibility of small scale production. Int J Pharm 196:155–7
- Hinrichs WL, Sanders NN, DeSmedt SC, et al. (2005). Inulin is a promising cryo- and lyoprotectant for PEGylated lipoplexes. J Control Rel 103:465–79
- Hinrichs WL, Mancenido FA, Sanders NN, et al. (2006). The choice of a suitable oligosaccharide to prevent aggregation of PEGylated nanoparticles during freeze thawing and freeze drying. Int J Pharm 311:237–44
- Keck CM, Muller RH. (2006). Drug Nanocrystals of Poorly Soluble Drugs Produced by High Pressure Homogenisation. Eur J Pharm Biopharm, 62:3–16
- Liversidge GG, Conzentino P. (1995). Drug particle size reduction for decreasing gastric irritancy and enhancing absorption of naproxen in rats. Int J Pharm 125:309–13
- Liversidge GG, Cundy KC, Bishop JF, Czekai DA. (1992). Surface modified drug nanoparticles. United States Patent 5145684
- Ma Q, Sun H, Che E, et al. (2013). Uniform nano-sized valsartan for dissolution and bioavailability enhancement: influence of particle size and crystalline state. Int J Pharm 441:75–81
- Mahajan P, Mahajan SC, Mishra DK. (2011). Valsartan release from sustained release matrix tablet and effect of cellulose derivatives. Int J Pharm Life Sci 2:521–30
- Moffat AC. (2011). Clark’s analysis of drugs and poisons. London: London Pharmaceutical Press
- Moschwitzer J, Muller R. (2007). Drug nanocrystals-the universal formulations approach for poorly soluble drugs. In: Thassu D, Deleers M, Pathak Y, eds. Nanoparticulate Drug Delivery System. Informa Healthcare. New York, 71–88
- Mujtaba A, Ali M, Kohli K. (2014). Statistical optimization and characterization of pH-independent extended-release drug delivery of cefpodoxime proxetil using Box–Behnken design. Chem Eng Res Des 92:156–65
- Muller RH, Peters K. (1998). Nanosuspensions for the formulation of poorly soluble drugs. I. Preparation by a size-reduction technique. Int J Pharm 160:229–37
- Nalawade P, Aware B, Dand N, et al. (2009). Solid state characterization of the inclusion complex of valsartan with methyl β-cyclodextrin. J Incl Phenomena Macro Chem 65:377–83
- Park YJ, Lee HK, Im YB, et al. (2010). Improved pH-independent dissolution and oral absorption of valsartan via the preparation of solid dispersion. Arch Pharm Res 33:1235–40
- Pawar VK, Singh Y, Meher JG, et al. (2014). Engineered nanocrystal technology: In-vivo fate, targeting and applications in drug delivery. J Control Release 23:51–66
- Rukhman I, Flyaks E, Koltai T, Aronhime J. (2006). Polymorphs of valsartan. US Patent 20067105557
- Sharma A, Jain CP. (2010). Preparation and characterization of solid dispersions of Valsartan with Poloxamer 188. Der Pharmacia Lettre 2:54–63
- Speiser PP. (1998). Poorly soluble drugs: a challenge in drug delivery, In: Muller RH, Benita S, Bohm B, eds. Emulsions and nanosuspensions for the formulation of poorly soluble drugs. Stuttgart, Germany: Medpharm Scientific Publishers, 15–28
- Verma S, Lan Y, Gokhale R, Burgess DJ. (2009). Quality by design approach to understand the process of nanosuspension preparation. Int J Pharm 377:185–98
- Zarghi A, Shafaati A, Foroutan SM, et al. (2008). Rapid quantification of valsartan in human plasma by HPLC using monolithic column. Pharm Sci 76:439–50
- Zhang D, Tan T, Gao L, et al. (2007). Preparation of azithromycin nanosuspensions by high pressure homogenization and its physicochemical characteristics studies. Drug Dev Ind Pharm 33:569–75