
 ?Mathematical formulae have been encoded as MathML and are displayed in this HTML version using MathJax in order to improve their display. Uncheck the box to turn MathJax off. This feature requires Javascript. Click on a formula to zoom.
Abstract
Topical delivery of local anesthetics has been an area of interest for researchers considering the barrier properties of skin and unfavorable physicochemical properties of drugs. In the present study, efforts have been made to modify the in vivo efficacy of eutectic mixture of lidocaine and prilocaine by exploiting the phospholipid modified microemulsion based delivery systems. The strategic QbD (D-optimal mixture design) enabled systematic optimization approach, after having obtained the isotropic area of interest by ternary phase diagram, has resulted into the system with most desirable attributes. Latter include nano-scale, globular structures with an average size of 40.6 nm, as characterized by TEM and DLS. The optimized microemulsion systems in gel dosage forms revealed the better permeability over commercial cream (CC) through abdominal rat skin. Enhancement in the flux from MOPT-NMP gel was 3.22-folds for prilocaine and 4.94-folds for lidocaine, in comparison to that of CC. This enhanced skin permeability is very well reflected in the in vivo studies, wherein intensity and duration of action was augmented significantly. The skin compliance of the optimized formulation was revealed in histopathological studies. The overall benefit relating to efficacy and safety-compliance could be correlated to the uniqueness of the carriers, composed of phospholipids and other components. Hence, the developed phospholipid-microemulsion based gel formulation has been proposed as more useful alternative for the topical delivery of lidocaine and prilocaine.
Introduction
Topical anesthetics have always been of considerable clinical benefit in ameliorating cutaneous pain associated with various medical procedures. Of late, several attempts have been made to provide efficient anesthesia of the intact skin, though various studies indicated the limited efficiency of available formulations (Tadicherla & Berman, Citation2006). For most currently available formulations for local anesthetics (e.g. EMLA™ cream, Astra, Swedan), there is a long delay between application and anesthetic effect and thus, have slow onset of topical anesthesia (Russell & Doyle, Citation1997). The horny layer barrier (i.e. stratum corneum) is the main hurdle and the rate-limiting step for the percutaneous absorption of local anesthetic drugs. As the sensory nerve endings responsible for pain sensation are present mainly in the dermis, the local anesthetics should be targeted to this layer while administering through topical route (Sobanko et al,. Citation2012).
Several methods and strategies to improve the dermal flux of local anesthetic drugs and shorten the onset of topical anesthesia are available such as iontophoresis and skin pretreatment with laser or ultrasound (Naik et al., Citation2000; Kearns et al., Citation2003). However, these methods are costlier, requiring special devices and qualified staff for their application (DeCou et al., Citation1999). An alternative delivery strategy used to increase penetration of topical anesthetics is incorporation of the drug into innovative colloidal carrier delivery systems such as microemulsions. A microemulsion is a system which contains water and/or oil nano-domains coexisting in thermodynamic equilibrium due to the presence of a surfactant film at the oil/water interface. Compared to conventional vehicles like emulsions, microemulsions have revealed larger drug-solubility owing to coexistence of hydrophilic and lipophilic solubilization sites, and larger oil/water interfacial area (Kreilgaard, Citation2002). It has been reported that the transdermal flux of lidocaine from the microemulsion was up to four times higher than that from an emulsion (Kreilgaard et al., Citation2000). Lidocaine in combination with prilocaine hydrochloride when formulated into the microemulsion, the transdermal flux of both the drugs was dependent upon the solubility of drugs in the microemulsion system. However, the study succeeded to enhance the transdermal flux remarkably, but concentration of lidocaine was much higher than the same combination drugs of commercial formulation. In one another study, increased release rate of lidocaine and prilocaine was revealed from thermosetting microemulsion systems based on two block copolymers (Lutrol® F127 and Lutrol® F68), nevertheless, this system was meant for periodontal anesthesia (Scherlund et al., Citation2000).
In the last decade, studies suggested that phospholipid microemulsions produce enhanced transdermal flux for oil-soluble drugs (Dreher et al., Citation1997; Paolino et al., Citation2002; Peltola et al., Citation2003). However, the potential of phospholipid-based microemulsion have never been explored in cutaneous delivery of local anesthetics. Thus, the goal of present research work was to design and develop the phospholipid-based microemulsions (MEs) of eutectic mixture of lidocaine and prilocaine (EMLP) in order to assess its usefulness in improving the delivery including permeation for the better pharmacodynamic action. The key approach employed during these investigations have been to nano-encapsulate lidocaine and prilocaine in the MEs comprising of lipids Labrasol®/Lauroglycol 90® and phospholipids Phospholipon 90G® in association with other polar and nonpolar components.
Systematic development of drug products employing the newer paradigm of Formulation by Design (FbD), which is based on the principles of Design of Experiment (DoE) and Quality by Design (QbD) provides holistic understanding of product and processes to yield the best solution (Singh et al., Citation2011). The current studies, accordingly, embark upon investigating the various ME-specific attributes for topical application employing the QbD methodology. Such approach facilitates identifying the “vital few” factors systematically and simultaneously through risk-assessment and screening studies, followed by their optimization using D-optimal mixture design. The work also embraces the in vivo pharmacodynamic evaluation in the Wistar rats.
Materials
Lidocaine (Lido) and prilocaine (Prilo) were obtained ex gratis from M/s Ipca Labs Ltd., Ratlam, India, and Phospholipon 90G® from M/s Phospholipid GmbH, Nattermannallee, Germany. Labrasol® and Lauroglycol 90® were procured from M/s Gattefosse, Hauptstrasse, Germany and Carbopol 934® from M/s Lubrizol, Mumbai, India as the gift samples. Isopropyl myristate (IPM), Tween 80 and n-methyl pyrrolidone (NMP) were purchased from M/s LobaChemie, Mumbai, India, while absolute ethanol from M/s Bengal Chemicals Ltd., Kolkata, India. All other chemicals employed in various studies were of analytical grade, and were used as such. Ultrapure water (Milli-Q® Integral system; M/s Merck Millipore, Billerica, MA) was used throughout the study. The commercial cream (CC), i.e. Prilox™ containing lidocaine (2.5% w/w) and prilocaine (2.5% w/w), was procured from a local drug house.
Methods
Defining the QTPP & CQAs
Initially, as per the QbD paradigm, quality target product profile (QTPP) was defined encompassing the summary of quality characteristics for developing MEs of EMLP for accomplishing the maximal therapeutic efficacy. In order to meet the QTPP, various patient-centric critical quality attributes (CQAs) were identified, such as physical attributes of the drug product viz. ME globule size (imperative for discerning maximal drug-release), flux (indicator of the drug permeation through skin), skin retention (essential for attaining therapeutic effects for prolonged periods of time), and amount permeated (indicative of availability of the drug for after specific time intervals for desired therapeutic action). illustrates the nuances of various elements of QTPP envisioned for the development of EMLP loaded ME (s) in an explicit manner. Similarly, enlists the key CQAs of the product/process affecting the performance of EMLP loaded ME (s) along with apt justification (s) for each of them.
Table 1. Quality Target Product Profile (QTPP) for EMLP-loaded MEs.
Table 2. Critical Quality Attributes (CQAs) for EMPL-loaded ME and their justifications.
Risk assessment studies
Ishikawa fish-bone diagram was constructed employing Minitab 16 software (M/s Minitab Inc., Philadelphia, PA) to postulate a cause-effect relationship among the probable material attributes affecting the CQAs of the formulations (Lionberger et al., Citation2008). pictorially presents the resultant fish-bone diagram depicting the effect of key material attributes and/or process parameters for the development of EMLP-loaded MEs. Further, the Prioritization for selecting the high risk factors was carried out by constructing the risk estimation matrix (REM), showing the potential risk(s) associated with each of the material attribute(s) and/or process parameter(s) of EMLP-loaded MEs on its potential CQAs by assigning low, medium and high values to each of the studied factors. illustrates the REM for EMLP-loaded MEs for discerning high-risk parameters, if any.
Figure 1. Fish-bone diagram.
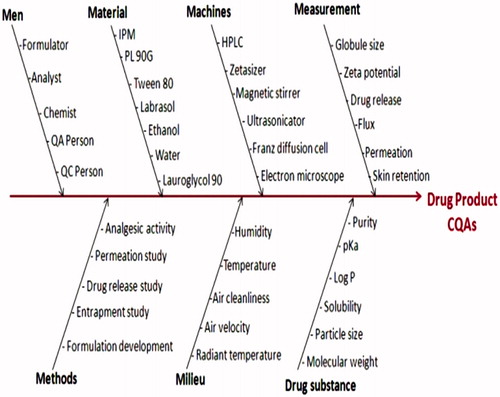
Table 3. Initial risk assessment for ME formulation containing EMLP.
Preparation of EMLP and screening of components for MEs
Lido and Prilo bases were directly combined in a definite mass ratio (1:1) in glass vials, and mixed using a spatula at ambient temperature until a visually homogenous liquid oil (eutectic mixture) was obtained. The eutectic mixture, so obtained, was allowed to equilibrate at room temperature (21–25 °C) for 24 h prior to use (Brodin et al., Citation1984). For the development of MEs, IPM was selected as the oil phase as it was completely miscible with EMLP. A combination of nonionic surfactant (Tween 80) and saturated lipids (SL) (Labrasol®/Lauroglycol 90®) was employed as the surfactant mixture, while the Phospholipon 90 G®: ethanol was selected as the cosurfactant (CS) in a fixed ratio of 1: 10.
Construction of pseudo-ternary phase diagrams
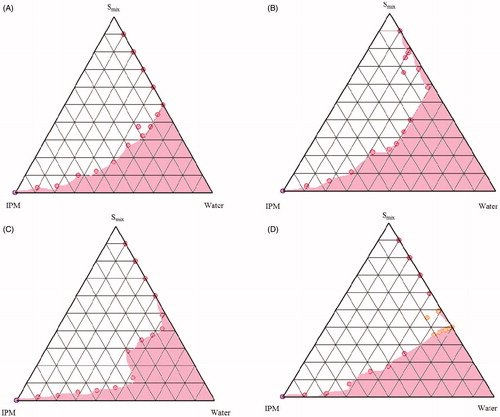
The different combinations of surfactants (Tween 80 and SL) and CS as Smix ratio, IPM and water were utilized to investigate the phase behavior by employing titration method. The Smix ratios of Tween 80: CS: SL were altered at 1:1:1, 1:1:0.5, 1:2:1 and 2:1:1 to construct a total of 8 ternary phase diagrams. The SL selected in the ternary phase diagrams were Labrasol® () and Lauroglycol 90® (). For the construction of pseudo-ternary phase diagram at each Smix ratio, the mixtures containing water and Smix were prepared with volume ratios ranging between 1:9 and 9:1, and titrated drop by drop with oily phase under magnetic stirring at ambient temperature till the appearance of turbidity. Similarly, volume ratios of oily phase and Smix (1:9 to 9:1) were varied and titrated with water. The ME area of the ternary system was mapped as a triangular phase diagrams using computer software (PCP Disso v2.08, Pune, India) ( and ).
Figure 2. Pseudo-ternary phase diagrams of MEs composed of oil (IPM), Smix (Tween 80: CS: Labrasol®) and water at various Smix ratios (A) 1:1:0.5 (B) 1:1:1 (C) 1:2:1 (D) 2:1:1.
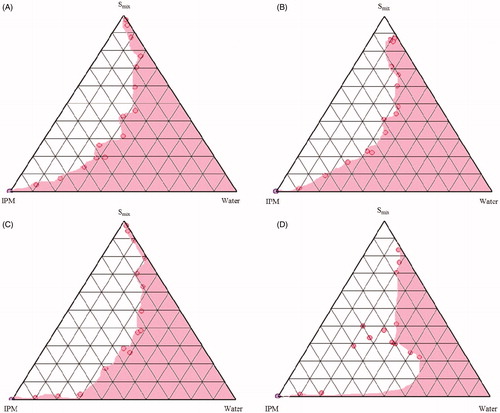
Figure 3. Pseudo-ternary phase diagrams of MEs composed of oil (IPM), Smix (Tween 80: CS: Laurogycol 90®) and water at various Smix ratios (A) 1:1:0.5 (B) 1:1:1 (C) 1:2:1 (D) 2:1:1.
Preparation of EMLP-loaded MEs as per the experimental design
From the pseudoternary phase diagrams, Smix ratio with maximum ME region () was selected. Different proportions of oil and Smix were mixed, depending upon the design points of the D-optimal mixture design (). EMLP 5% (w/w) was dissolved in the mixture of oil and Smix under magnetic stirring at ambient temperature. Appropriate amount of water was slowly added to the oily mixture under magnetic stirring until clear and transparent ME(s) was obtained. The mixture was allowed to stabilize and attain the equilibrium for 10–15 minutes under continuous stirring. All EMLP-loaded microemulsion formulations were then stored at ambient temperature.
Table 4. Experimental runs of D-optimal mixture design and their responses.
The levels of three independent variables viz. oil (X1), Smix (X2) and water (X3) were chosen on the basis of pseudo-ternary phase diagrams. These three factors were varied with respect to each other such that the total sum was 100% using D-optimal mixture design. The ranges of the components for design were selected as follows:
9%≤ X1≤10%
30%≤ X2≤60%
50%≤ X3≤70%
summarizes an account of the thirteen experimental runs studied and their factor combinations. The globule size (Y1, nm), skin retention (Y2, mgcm−2), cumulative permeation (Y3, %) and skin permeation flux (Y4, µg cm−2 h−1) were selected as the CQAs (responses).
Response surface methodology and data analysis
Response surface analysis of variables was carried out employing Design Expert® (Version 8.0.4; Stat-Ease Inc., Minneapolis, MN) software to fit the linear, quadratic or cubical polynomial equations based on Scheffe’s model. Only those coefficients which were found to be significant using ANOVA, were considered in framing the polynomial equations. The polynomial regression results were demonstrated using contour plots obtained with the help of Design Expert® software (Singh et al., Citation2005). Finally, the prognosis of optimum formulation(s) was conducted by two methods, i.e. graphical optimization (overlay-plots) and numerical (desirability) optimization, using standard methods. For the studied design, the multiple linear regression analysis (MLRA) method was used to fit the full second-order polynomial equations with added interaction terms. The prognosis of optimum formulation was conducted in two stages; first, a feasible space was located and second by locating the overlay plot option in the software (Singh et al., Citation2011). For overlay plots, the response surfaces/contour plots were superimposed over each other to search for the best composition. Minimum and maximum boundaries were set up for acceptable objective values. The region, within the overlay plot or combined contour plot, was highlighted as the design space wherein all the responses are considered within the acceptable limits. Within this optimal area, an optimum formulation was carefully located by “trading off” the values of different response parameters viz. globule size, skin permeation flux, % cumulative permeation in 5 h, and skin retention in 5 h. Seven formulations were selected as the check point formulation from the overlay plot and numeric optimization to validate the FbD methodology. The observed and predicted responses were critically compared and linear correlation plots were constructed. Residual graphs between predicted and observed responses were also constructed separately, and the percent bias (error) was calculated with respect to the observed responses.
Preparation of rat abdominal skin
The animal study was conducted in accordance with the approval of the Animal Ethical Committee, by the Panjab University Animal Ethics Committee, duly approved for the purpose of control and supervision of experiments on animals by the Government of India (Ref. letter no. CAH/09/70; IAEC/156). Wistar rats weighing 150–200 g were sacrificed using cervical dislocation and the full thickness skin was removed from the abdominal region. The hair of test animals was carefully removed with surgical blade no. 22 and freed from any adhering fat material. The excised skin was washed with normal saline twice, and used for ex vivo skin permeability studies.
Ex vivo skin permeation studies
The rat skin was mounted between donor and receptor compartments of the Franz diffusion cells (cross-sectional area of 3.142 cm2) with stratum corneum facing the donor compartment. The ME (1 g) was placed in the donor compartment and 30 mL of phosphate buffer saline (PBS, pH 7.4) containing 30% (v/v) of ethanol was placed in receptor compartment. Ethanol was used to maintain the sink conditions. The assembly was maintained at 32 ± 1 °C with the help of a thermo-regulated outer water jacket, while the diffusion medium was stirred continuously using a magnetic stirrer. Aliquots of 1 mL were collected periodically at the predetermined time points and replenished with the fresh diffusion medium (Raza et al., Citation2013). Drug concentration in the receiver compartment was determined using HPLC and the cumulative amount of Lido and Prilo (Qn) permeated was calculated according to Equation. (Equation1(1)
(1) )
(1)
(1)
where, Cn represents the drug concentration of the receiver medium at each sampling time, Ci the drug concentration of the ith sample, and V0 and Vi represent the volumes of the receiver solution and the sample, respectively.
The flux values were calculated from slope of the linear graph between the amounts of drug released per unit surface area versus time (Raza et al., 2011b).
Skin retention study
After completion of permeation studies, skin mounted on the diffusion cell was carefully taken off. The adhered formulation on the skin was cautiously removed and analyzed for drug content. The cleaned skin tissue was washed thrice with ultrapure water and dried on lint-free cotton swab. The skin tissue was chopped into small pieces and macerated in ethanol (5 mL) for 24 h for complete drug extraction to take place (Raza et al., Citation2013). After filtering the solution through a membrane (0.45 μm), the filtrate was analyzed using a validated RP-HPLC technique.
Characterization of ME
Globule size and zeta potential of the optimized MEs, MOPT and MOPT-NMP (optimized ME with 5% NMP), were determined using Zetasizer ZS90 (M/s Malvern Instruments, Worcestershire, UK). The MEs were diluted 10 times before the globule size and zeta potential analysis. The mean value of triplicate measurements for each sample was reported as the final result. Transmission electron microscope (TEM) installed at Central Instrumentation Laboratory (CIL), Panjab University, Chandigarh, was employed to determine the morphology of the ME globules. The developed ME system was negatively stained with aqueous solution of phosphotungstic acid (1% by mass), subsequently dried on a microscopic carbon-coated grid and viewed under microscope at suitable magnification. Percent transmittance of the ME systems was measured at 650 nm using UV spectrophotometer (UV 1601, M/s Shimadzu, Kyoto, Japan) keeping distilled water as the blank. To quantify the clarity of prepared ME system(s), the value of refractive index (RI) was determined using Abby’s refractometer (M/s Advance Research Instruments, New Delhi, India) at 37 ± 0.1 °C and compared vis-a-vis water. The pH of MEs was also determined at 25 °C using a high sensitivity pH meter (CyberScan PC 510, M/s, Eutech Instruments Pvt. Ltd., Singapore).
Development of secondary topical vehicle
In order to make the EMLP-loaded MEs (MOPT and MOPT-NMP) rheologically acceptable for topical applications; these were further incorporated in Carbopol® 934 hydrogel (1.25% by weight). Carbopol® 934 was slowly mixed with ME under stirring to obtain a clear ME-based hydrogel. Since various permeation enhancers could increase the permeation of drugs from the formulations, 5% w/w NMP was incorporated in the optimized MOPT and MOPT gel, to result in the formation of MOPT-NMP and MOPT-NMP gel, respectively.
Rheology and textural studies
The rheograms of the EMLP-loaded MOPT gel and MOPT-NMP gel were constructed using a cup and bob rheometer (Model MC1, PaarPhysica, Germany) at 30 °C. Approximately 5 g gel sample was placed in a concentric cylinder arrangement (Z4 probe with cup radius = 7.59 mm, bob radius = 7.0 mm, angle of measuring bob cone, α = 120°). The shear stress value was increased, automatically, linearly from 0.1 to 100 s−1. The relationship between shear stress (τ) and shear rate (γ) was determined using Power-law and Herschel–Bulkey models (Equations Equation2(2)
(2) and Equation3
(3)
(3) ; Raza et al., Citation2013).
(2)
(2)
(3)
(3)
where, K = consistency index (Pa secn); τ0 = yield stress (Pa); n = power-law exponent.
The textural properties of EMLP-loaded ME-based hydrogel formulations (MOPT and MOPT-NMP) were also evaluated using Texture Analyzer™ (TA.XT.Plus Texture Analyzer; M/s Stable Microsystems, Surrey, UK). Sample (5–7 g) was placed into the lower cone. Before testing, the upper cone probe was calibrated against the lower cone so that the starting point was at the same height for each test, e.g. 25 mm above the lower cone. During testing, the upper cone probe approached and then penetrated into the sample and continued to a depth of 2 mm above the sample holder surfaces, i.e. the probe moved a distance of 23 mm from its start point (with test speed of 3 mms−1) (Bhatia et al., Citation2009).
Stability studies
Stability studies on MEs, i.e., MOPT and MOPT-NMP, and on ME gels, i.e., MOPT gel and MOPT-NMP gel, were conducted at various storage temperatures, i.e. 5 ± 3 °C, 30 ± 2 °C and 40 ± 2 °C, each for a period of 6 months. MOPT and MOPT-NMP were placed in sealed glassed containers, while MOPT gel and MOPT-NMP gel were placed in the collapsible aluminium tubes. The physical stability of the MEs containing EMLP (MOPT and MOPT-NMP) was studied via clarity, phase separation observation, globule size, pH, refractive index and transmittance. The hydro gels (MOPT and MOPT-NMP gel) samples were assessed for phase separation and pH. In the chemical stability tests, % loss of Lido and Prilo in the formulations was also investigated by HPLC analysis at 5 ± 1 °C, 25 ± 2 °C and 40 ± 2 °C for up to 6 months.
Ex vivo skin permeation behavior of the optimized formulations and the commercial cream
The ex vivo skin permeation behavior of Lido and Prilo from MOPT and MOPT-NMP, and MOPT and MOPT-NMP gels was compared with that of the CC as a control using a method similar to as described in section “Ex vivo skin permeation studies”. Permeation experiments were performed in non-occlusive conditions during 5 h and samples withdrawn from the receptor phase were analyzed by RP-HPLC. Rat skin remaining after the permeation study was used to test the Lido and Prilo absorbed into the skin.
The cumulative amount of Lido and Prilo permeated per unit effective diffusional area (Qns, µgcm−2) through excised rat skins was determined employing the following equation:
(4)
(4)
where, Qn stands for the cumulative amount of drug permeated and S is the effective diffusion area
The flux (J) of the individual drugs was calculated from the slope of the linear portion of the curve (Qns versus time). The permeability coefficient was calculated according to Equation Equation5(5)
(5) .
(5)
(5)
where J (µg cm−2 h−1) is Lido/Prilo flux across the skin, P (cm−2 h−1) is the permeability coefficient and Cd the Lido/Prilo concentration in the donor compartment.
In vivo evaluation of the analgesic effect in rats
Radiant heat tail-flick latency test using analgesiometer was employed for evaluating anesthetic effect of the prepared formulations (Shin et al., Citation2004). The selected model is one of the most preferred one in various studies. The test was carried out using male Wistar rats. Animals were divided into three groups each consisting of five animals and 50 mg of formulation was applied on the root of the tail on midline. Group 1 received CC, Group 2 MOPT-NMP gel, while Group 3 was treated with control ME gel (without EMLP). All the animals in the respective groups were individually exposed to analgesiometer maintained at 55 °C. Tail-flick test started 5 min after a local application of gels, and the test was conducted every 5 min until duration time fell to blank. The rat was fixed on a tail flick analgesiometer (Tail-flick analgesiometer, Imcorp, India) with the portion of the tail, 10 cm from its tip, exposed to heat from a projector lamp. A single control switch simultaneously activated the light and a timer. The timer stopped automatically when the exposed rat’s tail flicks. The time interval between switching on the light and flick of the tail was recorded. A 30 sec cut-off time was used to avoid any thermal injury. The base line tail flick latency averaged four to five seconds in all animals (Equation Equation6(6)
(6) ).
(6)
(6)
The efficacy of the MOPT-NMP gel was also determined by comparing the area under the efficacy curve (AUEC) of MOPT-NMP gel with the CC. It was defined by the efficacy factor (EF) (Equation Equation7(7)
(7) ).
(7)
(7)
Histopathology
For histopathological studies, dorsal hair of male Laca mice (4–6 weeks old; 15–20 g) was removed with the help of a 0.1 mm animal hair clipper. The skin was wiped with a saline wetted cotton swab 3 to 4 times and after drying, five hundred milligrams of formulations, MOPT-NMP and MOPT-NMP gel were topically applied for 24 h. After exposure, the formulation remaining on skin was removed carefully and swabbed with saline soaked cotton. After that, animals were sacrificed by cervical dislocation; skin samples were harvested and fixed in 10% formalin solution. The skin samples obtained were appropriately processed and stained with haematoxylin and eosin. The processed skins were observed microscopically for the histopathological changes (Raza et al., Citation2013).
Statistical analysis
Statistical analysis was performed using a one-way analysis of variance (ANOVA) to test the difference between flux, permeability coefficient and skin retention of test formulations (MOPT, MOPT-NMP, MOPT gel and MOPT-NMP gel) to that of CC formulation in ex vivo skin permeation study. Statistical differences are denoted as p < 0.05 (NS = not significant), p < 0.01 (Significant) and p < 0.001 (highly significant), respectively. For the in vivo efficacy studies, two-way ANOVA, followed by post-hoc Bonferroni t-test was employed (Daniel & Cross, Citation2013).
Results and discussion
Selection of components for MEs
The main criteria for selection of components were their solubility and permeability potential. The solubility of the drug in oils is considered to be the most important, as the ability of the ME to maintain the drug in solubilized form is greatly influenced by the solubility of drug in the oil phase (Raza et al., Citation2011a). EMLP is liquid at room temperature. As it is completely miscible in IPM (very soluble), the latter was selected as the oil phase. Earlier reports suggested that larger concentration gradients as a result of the high solubilization capacity of the ME lead to the enhanced dermal flux (Kreilgaard, Citation2002; Sintov & Shapiro, Citation2004). Besides, IPM also acts as penetration enhancer which further helps in increasing the permeability of drug into the skin (Kogan & Garti, Citation2006). The combination of nonionic surfactant, Tween 80, and various saturated lipid surfactants Labrasol® and Lauroglycol 90® were chosen for the ternary phase diagram construction. These surfactants are biocompatible and are reported to increase the dermal flux of various drugs. Phospholipid 90G® along with the ethanol was used as the cosurfactants (Kreilgaard, Citation2002). While Phospholipid 90G® could help in facilitating the drug delivery by interacting with the stratum corneum lipids, ethanol could reduce the rigidity of condensed lecithin film at the interfacial region and thus, help in ME droplet formation (Williams & Barry, Citation2004; Raza et al., Citation2011a).
Pseudoternary phase diagram studies
In order to obtain the appropriate concentration ranges of the components of ME, the pseudo-ternary phase diagrams were constructed for Smix (Tween 80: CS: SL) ratios viz. 1:1:1, 1:1:0.5, 1:2:1 and 2:1:1, each for two SLs (Labrasol® and Lauroglycol 90®). The Smix ratio which gave the largest ME region was selected for further study. In general, the phase diagrams constructed by taking the Labrasol® as SL in Smix ratio (), larger ME regions were obtained in comparison to those constructed with Lauroglycol 90®. The increase in the Labrasol® component in Smix from 1:1:0.5 to 1:1:1 resulted in no change in ME area. Increase in CS (Phospholipon 90G: ethanol) proportion from 1:1:1 to 1:2:1 and Tween 80 from 1:1:1 to 2:1:1, on the other hand, resulted in considerable reduction in the ME area, ascribable to lesser availability of short chain alcohol (i.e. ethanol) in the presence of other SL surfactant to decrease the rigidity of lecithin film at the oil-water interface. Analogously, in case of phase diagrams constructed by taking Lauroglycol 90® as SL component in Smix ratio (), an increase in Lauroglycol 90® from 1:1:0.5 to 1:1:1, led to reduction in the ME region. The increase in CS and Tween 80 component further decreased the ME area, attributed to analogous reason as explained earlier in case of Labrasol®. Thus, Labrasol® was selected for formulation of EMLP-loaded MEs using a mixture of Tween 80 and CS in Smix ratio 1:1:1.
FbD-optimization studies
The D-optimal mixture design was employed in the present study in order to obtain the optimized EMLP-loaded MEs, as the nature of response-factor relationship was known earlier (Singh et al., Citation2005). The components oil (X1), Smix (X2) and water (X3) were chosen as the formulation variables, while globule size (Y1), skin retention (Y2), % cumulative permeation (Y3) and skin permeation flux (Y4) were selected as the CQAs or response variables. The magnitudes of CQAs obtained for these formulations are summarized in .
The special polynomial mathematical model encompassing ten coefficients (β1–β10) was postulated with β0 as the intercept (). All the coefficients represent quadratic and interaction terms, as depicted in Equation Equation8(8)
(8) .
(8)
(8)
Table 5. Model summary statistics of the measured responses.
The model generated for all the seven response variables were found to be highly significant statistically (p < 0.0001). The r2 values for these models ranged between 0.9888 and 0.9996, indicating excellent fit of the generated polynomials to the response data (p < 0.0001 in all the cases). All the models were found to have insignificant values of “lack of fit”, (p > 0.005) ratifying that the proposed model was appropriate. Close proximity in the magnitude of adjusted (Adj) and predicted (Pred) r2 to the actual model r2 also confirm excellent fit to the data. (a–g) clearly show significantly high influence of factor B (Smix) and C (water) on all the response variables. With increase in the levels of Smix, while the globule size increased considerably, the values of % skin retention for Lido and Prilo decreased. However, with respect to % cumulative permeation and permeation flux, a non-linear quadratic dependence was observed on these response variables. MEs containing minimum amount of Smix showed higher permeation flux and % skin permeation. This could be attributed to the fact that high-surfactant concentration decreases the thermodynamic activity of the drug in the vehicle, and the affinity of the drug to the vehicle becomes greater, consequently decreasing the flux (Shinoda & Kaneko, Citation1988).
Figure 4. Three-dimensional response surface plots and the corresponding two-dimensional contour plots (front) depicting the effect of various input variable (a) globule size EMLP-loaded ME, (b) skin retention (R5) of Lido, (c) skin retention (R5) of Prilo, (d) permeation flux of Lido, (e) permeation flux of Prilo, (f) skin permeation (Q5) of Lido, (g) skin permeation (Q5) of Prilo.
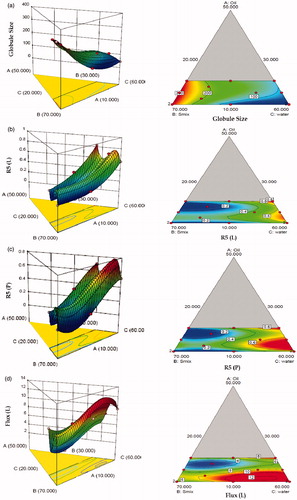
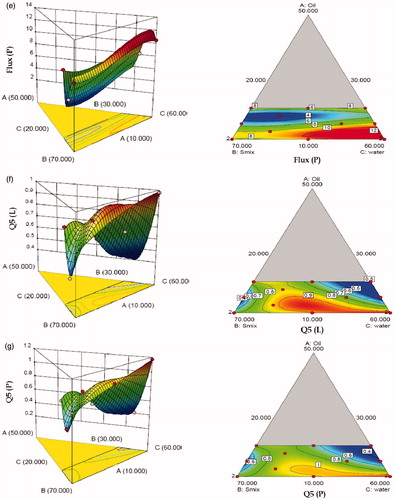
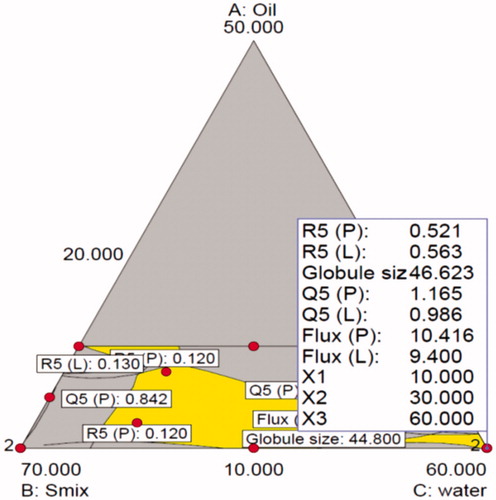
With increase in levels of water (Component C), the values of globule size tended to decrease, while the % skin retention increased for both Lido and Prilo. The IPM fraction in entire mixture varied in narrow range and had nonlinear effect on all the response variables. By and large, the figures vividly depict non-linear trend for all the studied response variables, attributable to the existence of significant interactions among the factors. Individually, the Smix contents had the most influential effect on the response variables, followed by water and IPM. Nearly inverse relationship observed between the response surface of globule size and permeation flux construe that the globule size of ME should be as small as possible to penetrate better into the deeper layers of the skin. The response surface plots of globule size, permeation flux and % skin permeation also proved that the Smix content should be minimal while the water content should be maximal in amount to have the minimum globule size of ME and maximum percutaneous absorption. Thus to search for the most suitable template ME composition with high dermal characteristics, both numerical and graphical methods were employed (Bhatia et al., Citation2013). The feasible optimal region was located as design space by drawing an overlay plot (). The overlay plot between the three factors shows the desirable region in yellow shade along with the chosen optimized formulation by “trading-off” various response variables within this region. The optimized formulation (MOPT) contained oil 10%w/w oil (5% EMLP and 5% IPM), 30% Smix and 60% water.
Figure 5. Overlay plot depicting the location of optimized microemulsion formulation in the design space.
A total of 7 formulations were chosen from this yellow region to establish mathematical models for mixture design. The percent bias for various response variables ranged between −9.36 and 4.97, with overall bias as −0.19 ± 2.40%, indicating very high degree of prognostic ability. All the above results clearly demonstrate unambiguous accuracy and validity of the proposed Scheff’s model in the successful postulation of the polynomial model and prediction of response variables.
Characterization of MOPT, MOPT-NMP, MOPT gel and MOPT-NMP gel
The mean globule size of optimized ME (MOPT) was found to be 40.6 nm with PDI of 0.392. Addition of NMP caused only marginal increase in the globule size (59.34 with PDI 0.311) of MOPT-NMP. The zeta potential of MOPT was found to be −0.532, while that of MOPT-NMP, it was 0.494. The zeta potential of the ME formulations was close to zero. It has already been reported that stability of MEs containing non-ionic surfactants does not depend on the values of its zeta potential (Tadros, Citation2006). The TEM () revealed the spherical nature and size homogeneity of the ME droplets (MOPT-NMP). The transmittance of MOPT was 99% and 98.13% for MOPT-NMP, confirming the transparent nature of MEs. The refractive index for MOPT was 1.38 and 1.31 for MOPT-NMP, which is close to RI of water, thus ratifying its o/w nature. The pH of MOPT system was 6.7, while the pH of MOPT-NMP was 5.3, while the pH of MOPT gel was 7.2 and MOPT-NMP gel was 7.4, all indicating that gel formation neutralized slight acidic characteristics of the ME formulations. Photographic images of ME (MOPT-NMP) and ME gel (MOPT-NMP gel) formulations are portrayed in . The rheological parameters of the developed hydrogels (MOPT gel and MOPT-NMP gel) are reported in . The values of ‘n’ were found to be less than 1, indicating that both the systems were shear-thinning in nature (Basu & Shivhare, Citation2007). The yield value of MOPT gel was found to be high (81.71) than MOPT-NMP gel (49.80) indicating rigidity of gel structure of the MOPT gel, which required more shear to initiate its flow. Results of the texture analysis are depicted in . It shows the variation of force as a function of time to divulge the gel strength, work of spreading, stickiness and force of extrusion. The results reveal that the developed systems exhibit fairly good gel strength, ease of spreading, bioadhesion and extrusion from tube. MOPT was found to be more viscous than MOPT-NMP, requiring higher force to penetrate and withdraw the male cone, and thus, revealing higher gel strength than MOPT-NMP. Analogous observations were made for the work of spreading and work of adhesion (i.e., stickiness) vis-à-vis MOPT-NMP. Further, uniformity of curve, plotted using the Exponent 32® software (), confirmed the smoothness and absence of any grittiness or lumps in the hydrogels (Bhatia et al., Citation2009). Developed gels, thus, met the criteria of absence of particulate matter and grittiness, as desired for any topical preparation.
Figure 6. TEM image of optimized ME formulation.
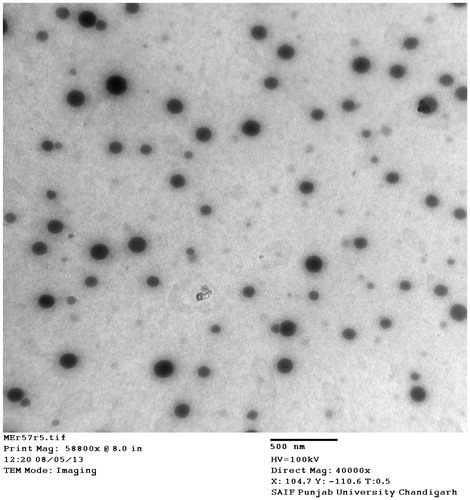
Figure 7. Photograph showing the images of microemulsion formulations (a) MOPT-NMP and (b) MOPT-NMP gel.
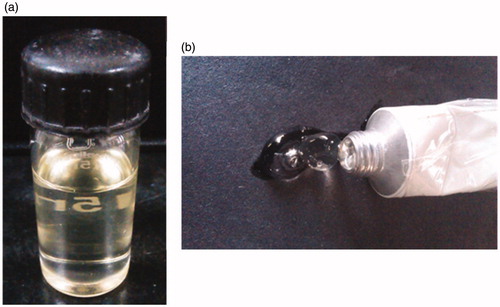
Figure 8. Texture analysis: (a) MOPT gel and (b) MOPT-NMP gel formulations.
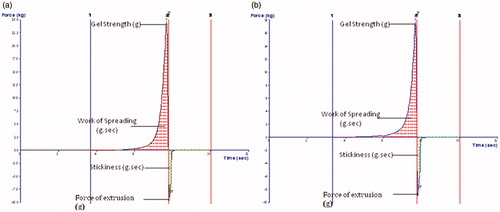
Table 6. Rheological characteristics of the developed ME gel formulations.
Stability studies
For the stability test, all MEs and ME hydrogel formulations were examined at 5 ± 1 °C, 25 ± 2 °C and 40 ± 2 °C. The percent drug loss of Prilo was found to be greater than Lido at all the storage temperatures. However, the best storage temperature for all formulations was found to be at 5 ± 1 °C, followed by 25 ± 2 °C ( stability data for MOPT-NMP gel). The physical stability of MOPT and MOPT-NMP gel formulation was also maintained throughout the testing period, as only negligible changes were observed in the globule size, refractive index, pH or phase separation of the formulations at all the storage temperatures.
Table 7. Chemical stability of Lido and Prilo in the MOPT-NMP gel formulations after 6 months of storage at various conditions. Values are means of three experiments ± SD.
Ex vivo permeation studies
Lido and Prilo permeation profiles from different formulations are depicted in and all permeation parameters are shown in . Considering the indication for the formulation a fast onset time is required, and therefore a high release rate is important.
Figure 9. Cumulative permeation amount versus time curves of ME and the reference formulations (a) prilocaine (b) lidocaine (mean + SD); n = 3.
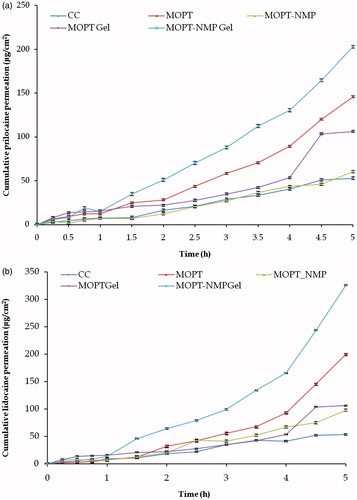
Table 8. Permeation parameters (mean±SD) of lidocaine and prilocaine through rat skin from ME formulations and commercial formulation (n = 3).
The permeation rates and permeability coefficient values of Lido and Prilo from the optimized ME formulations were higher than the marketed formulation (p < 0.001) (). The flux of Lido and Prilo from MOPT, MOPT-NMP, MOPT gel and MOPT-NMP gel were 1.06–4.94 folds higher than CC (p < 0.01). Individually, the flux from MOPT was observed to be 2.48 times higher for Prilo and 2.94 times higher for Lido vis-à-vis CC. This could be ascribed to three main reasons, one is the high thermodynamic activity of the drugs due to ME vehicle. Secondly, smaller globule size of the ME provides the larger surface area for better percutaneous absorption. Thirdly, the presence of permeation enhancers like Phospholipon 90G® and Labrasol® in the MEs facilitate the percutaneous absorption (Shakeel et al., Citation2007; Raza et al., Citation2011a). It has been reported that at lower concentration, the phospholipid molecules get incorporated in the skin layers and fluidize and loosen the lipidic matrix of the skin, thus promote the drug permeation (Yokomizo & Sagitani, Citation1996). Moreover, phospholipids can serve in a characteristic manner to increase tissue hydration on account of their unique lamellae forming nature, thus resulting in the increased drug permeation (Williams & Barry, Citation2004).
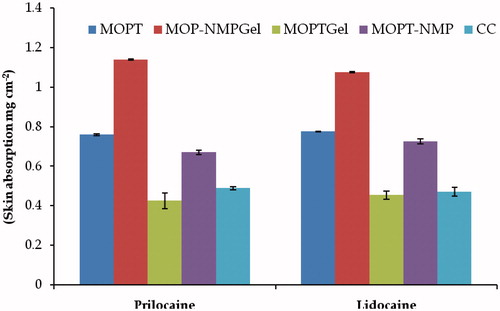
The addition of Carbopol 934® into ME (MOPT) decreased the permeability of Lido and Prilo (MOPT gel) (). This might be due to the fact that the viscosity of hydrogel is much higher than that of ME, accounting for retardation of mobility and consequently, the permeation of drugs (Peltola et al., Citation2003). On the contrary, the formulations (MOPT-NMP and MOPT-NMP gel) containing NMP as penetration enhancer, revealed the opposite results. Enhancement in the permeation flux from MOPT-NMP gel was 3.22-folds for Prilo and 4.94-folds for Lido in comparison to CC, whereas, the corresponding ME (MOPT-NMP) formulation showed very less enhancement in the flux of Prilo (1.07-folds) and Lido (1.57-folds). This was not anticipated as the viscosity of hydrogel (MOPT-NMP gel) was much higher than the corresponding ME (MOPT-NMP) formulation. The difference in the composition of MOPT and MOPT-NMP microemulsion formulation was only due to the presence of an additional constituent, i.e. NMP (penetration enhancer) in the latter formulation. Addition of NMP did not increase the penetration of Lido and Prilo, ostensibly because the drugs were in their liquid state. This could be correlated to the fact that the presence of other excipients (like NMP in the present case) in the emulsion or microemulsion may hinder the penetration of drugs when they are present in the liquid state. The excipient may also compete with the drug(s) during their partitioning into the skin. Here, drugs are present in their eutectic state of matter, which is oily in nature. A similar observation has already been reported wherein the permeation of an oily drug was retarded in the presence of other excipients (Welin-Berger et al., Citation2001). However, the effect of NMP as penetration enhancer was revealed in the MOPT-NMP gel, wherein higher permeation flux values were obtained in comparison to all the other formulations. NMP contained in MOPT-NMP gel could have acted as an effective penetration enhancer to reduce the diffusional barrier. After the permeation study for 5 h, the skin absorption of Lido and Prilo () of different formulations was calculated. The trend for the skin absorption was observed to be quiet similar to that of permeation. The best skin absorption was obtained in MOPT and MOPT-NMP gel among all the formulations. The skin absorption enhancement was 1.64 folds for Lido and 1.55-folds for Prilo in case of MOPT, and 2.88-folds for Lido and 2.23-folds for Prilo in case of MOPT-NMP gel to that of CC (p < 0.001). This could be attributed to the reservoir effect of ME because of the formation of micro-depots of the drug molecules within the layers of dermis by virtue of the integration of ME lipids components to those of the skin lipids (Raza et al., Citation2011a). Overall, out of all the tested formulations, MOPT and MOPT-NMP gel exhibited the best skin permeation and skin absorption characteristics.
Figure 10. Skin absorption of lidocaine and prilocaine from various formulations (mean ± SD); n = 3.
In vivo evaluation using tail flick analgesic model
MOPT-NMP gel formulation containing NMP, which showed the greatest enhancing effects in percutaneous permeation study, was used in the rat tail-flick analgesic test. The value of AUEC of MOPT-NMP gel and CC was 532.5 min2 and 307.5 min2, respectively. Thus, the efficacy of MOPT-NMP gel was observed to be about 1.73-folds greater than CC. The highest analgesic effect was shown at 20 minutes for the MOPT-NMP gel (). Percent analgesic effect was also found to be highly significantly improved in MOPT-NMP gel as compared to CC at each time interval (p < 0.001) as shown in . The improved pharmacodynamic action of MOPT-NMP gel could be because of improved penetration, localization, formation of local reservoirs and thus extended drug action, and enhanced drug interaction in conducive bio-milieu. Herein, the phospholipid molecules have been accountable to alter the microenvironment(s) at various stages of transportation skin by virtue of their unique aqua-lipoidal hydrating nature. Results have been corroborated by earlier studies, wherein long lasting effect in the study with lidocaine in microemulsion-based gels was obtained when compared to emulsion-based systems (Lee et al., Citation2003).
Figure 11. Tail-flick test comparison of control gel, MOPT-NMP gel and commercial cream (CC). The data represent the mean ± SD (n = 5).
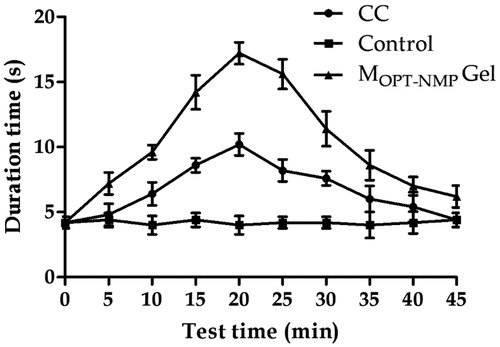
Table 9. Comparison of % analgesic effect of MOPT-NMP gel and CC*.
Skin histology
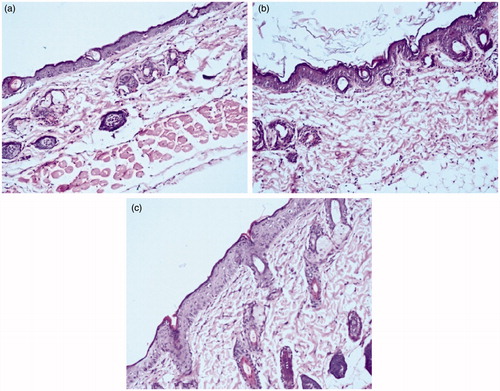
depicts the photomicrographs of mouse skin surface treated with normal saline (Control), MOPT-NMP and MOPT-NMP gel. The control treated group revealed normal skin histology with intact multilayers of epidermis, dermis and subcutaneous fatty layer. However, the MOPT-NMP-treated skin showed the alterations in the skin layers, with increase in the width of cell gaps and elongation of epidermal and dermal skin appendages. On the other hand, MOPT-NMP gel-treated skin showed less alteration in the skin histology. This could be due to the indirect contact of the ME components with skin due to gel formation. The irritation studies did not show visible irritation after application of MOPT-NMP and MOPT-NMP gel after 24 h on the dorsal skin of rats (data not shown). Thus, topical drug delivery of the developed ME systems can be considered to be safe.
Figure 12. Photomicrographs of skin histology sections treated with (a) Control (b) MOPT-NMP gel treated (c) MOPT-NMP treated.
Conclusions
In this research work, new oil/water EMLP-loaded phospholipid MEs have been developed employing the QbD methodology. The MEs were optimized using the D-optimal mixture experimental design to get the optimum composition with desired carrier characteristics. The results revealed that the various components had significant effect on the responses. The optimum ME composition could be located at the level of 5% IPM, 5% EMLP, 30% Smix and 60% water. The MOPT-NMP gel formulation with 5% NMP showed better skin permeation and skin absorption than all other optimized formulations and CC. In the assessment for in vivo efficacy on tail-flick model in rats, the MOPT-NMP gel has shown significant improvement vis-à-vis conventional system. The studies are indicative of the usefulness of the tested novel compositions containing local anesthetics more effective and safe than currently available formulations.
Acknowledgements
Authors are thankful to M/s Ipca Labs Ltd. Ratlam, India for generously providing the gift samples of lidocaine and Prilocaine, where to M/s Gattefosse, Hauptstrasse, Germanyand M/s Phospholipid GmbH, Nattermannallee, Germany, for the ex gratis supply of Labrasol®, Lauroglycol 90® and phospholipids, respectively.
Declaration of interest
The authors report no declarations of interest. Financial grants obtained from University Grants Commission (UGC), New Delhi, to one of us (Poonam Negi) are gratefully acknowledged.
References
- Basu S, Shivhare US, Raghavan GSV. (2007). Time dependent rheological characteristics of pineapple jam. Int J Food Eng 3 (3)
- Bhatia A, Raza K, Singh B, Katare OP. (2009). Phospholipid-based formulation with improved attributes of coal tar. J Cosmet Dermatol 8:282–8
- Bhatia A, Singh B, Raza K, et al. (2013). Tamoxifen-loaded lecithin organogel (LO) for topical application: Development, optimization and characterization. Int J Pharm 444:47–59
- Brodin A, Nyqvist-Mayer A, Wadsten T, et al. (1984). Phase diagram and aqueous solubility of the lidocaine-prilocaine binary system. J Pharm Sci 73:481–4
- Daniel WW, Cross CL. (2013). Biostatistics: a foundation for analysis in the health sciences (Wiley Series in Probability and Statistics). Hoboken, NJ: John Wiley & Sons Inc
- DeCou JM, Abrams RS, Hammond JH, et al. (1999). Iontophoresis: a needle-free, electrical system of local anesthesia delivery for pediatric surgical office procedures. J Pediatr Surg 34:946–9
- Dreher F, Walde P, Walther P, Wehrli E. (1997). Interaction of a lecithin microemulsion gel with human stratum corneum and its effect on transdermal transport. J Control Release 45:131–40
- Kearns GL, Heacook J, Daly SJ, et al. (2003). Percutaneous lidocaine administration via a new iontophoresis system in children: tolerability and absence of systemic bioavailability. Pediatrics 112:578–82
- Kogan A, Garti N. (2006). Microemulsions as transdermal drug delivery vehicles. Adv Colloid Interface Sci 123–126:369–85
- Kreilgaard M. (2002). Influence of microemulsions on cutaneous drug delivery. Adv Drug Deliv Rev 54:S77–98
- Kreilgaard M, Pedersen EJ, Jaroszewski JW. (2000). nmR characterisation and transdermal drug delivery potential of microemulsion systems. J Control Release 69:421–33
- Lee PJ, Langer R, Shastri VP. (2003). Novel microemulsion enhancer formulation for simultaneous transdermal delivery of hydrophilic and hydrophobic drugs. Pharm Res 20:264–9
- Lionberger RA, Lee SL, Lee L, et al. (2008). Quality by design: concepts for ANDAs. AAPS J 10:268–76
- Naik A, Kalia YN, Guy RH. (2000). Transdermal drug delivery: overcoming the skin's barrier function. Pharm Sci Technolo Today 3:318–26
- Paolino D, Ventura CA, Nisticò S, et al. (2002). Lecithin microemulsions for the topical administration of ketoprofen: percutaneous adsorption through human skin and in vivo human skin tolerability. Int J Pharm 244:21–31
- Peltola S, Saarinen–Savolainen P, Kiesvaara J, et al. (2003). Microemulsions for topical delivery of estradiol. Int J Pharm 254:99–07
- Raza K, Negi P, Takyar S, et al. (2011). Novel dithranol phospholipid microemulsion for topical application: development, characterization and percutaneous absorption studies. J Microencapsul 28:190–9
- Raza K, Singh B, Lohan S, et al. (2013). Nano-lipoidal carriers of tretinoin with enhanced percutaneous absorption, photostability, biocompatibility and anti-psoriatic activity. Int J Pharm 456:65–72
- Raza K, Singh B, Mahajan A, et al. (2011). Design and evaluation of flexible membrane vesicles (FMVs) for enhanced topical delivery of capsaicin. J Drug Target 19:293–302
- Russell SC, Doyle E. (1997). A risk-benefit assessment of topical percutaneous local anaesthetics in children. Drug Saf 16:279–87
- Scherlund M, Malmsten M, Holmqvist P, Brodin A. (2000). Thermosetting microemulsions and mixed micellar solutions as drug delivery systems for periodontal anesthesia. Int J Pharm 194:103–16
- Shakeel F, Baboota S, Ahuja A, et al. (2007). Nanoemulsions as vehicles for transdermal delivery of aceclofenac. AAPS PharmSciTech 8: E1–E9
- Shin SC, Cho CW, Yang KH. (2004). Development of lidocaine gels for enhanced local anesthetic action. Int J Pharm 287:73–8
- Shinoda K, Kaneko T. (1988). Characteristic properties of lecithin as a surfactant. J Disp Sci Tech 9:555–9
- Singh B, Dahiya M, Saharan V, Ahuja N. (2005). Optimizing drug delivery systems using systematic “design of experiments.” Part II: retrospect and prospects. Crit Rev Ther Drug Carrier Syst 22:215–94
- Singh B, Kapil R, Nandi M, Ahuja N. (2011). Developing oral drug delivery systems using formulation by design: vital precepts, retrospect and prospects. Expert Opin Drug Deliv 8:1341–60
- Singh B, Kumar R, Ahuja N. (2005). Optimizing drug delivery systems using systematic “design of experiments.” Part I: fundamental aspects. Crit Rev Ther Drug Carrier Syst 22:27–105
- Sintov AC, Shapiro L. (2004). New microemulsion vehicle facilitates percutaneous penetration in vitro and cutaneous drug bioavailability in vivo. J Control Release 95:173–83
- Sobanko JF, Miller CJ, Alster TS. (2012). Topical anesthetics for dermatologic procedures: a review. Dermatol Surg 38:709–21
- Tadicherla S, Berman B. (2006). Percutaneous dermal drug delivery for local pain control. Ther Clin Risk Manag 2:99–113
- Tadros T. (2006). Principles of emulsion stabilization with special reference to polymeric surfactants. J Cosmet Sci 57:153–69
- Welin-Berger K, Neelissen J, Bergenstahl B. (2001). In vitro permeation profile of a local anaesthetic compound from topical formulations with different rheological behavior – verified by in vivo efficacy data. Eur J Pharm Sci 14:229–36
- Williams AC, Barry BW. (2004). Penetration enhancers. Adv Drug Deliv Rev 56:603–18
- Yokomizo Y, Sagitani H. (1996). Effects of phospholipids on the in vitro percutaneous penetration of prednisolone and analysis of mechanism by using attenuated total reflectance – Fourier transform infrared spectroscopy. J Pharm Sci. 85:1220–6