
Abstract
A receptor level interaction of etoposide with P-glycoprotein (P-gp) and subsequent intestinal efflux has an adverse effect on its oral absorption. The present work is aimed to enhance the bioavailability of etoposide by co-administering it with quercetin (a P-gp inhibitor) in dual-loaded polymeric nanoparticle formulation. Poly-lactic-co-glycolic acid (PLGA) nanoparticles were optimized for various parameters like o/w phase volume ratio, poly-vinyl alcohol concentration, PLGA concentration and sonication time. The cytotoxicity studies (MTT assay) revealed a 9- and 11-fold decrease in the IC 50 values for etoposide-loaded nanoparticles (ENP) and etoposide + quercetin dual-loaded nanoparticles (EQNP) when compared to that of free etoposide, respectively, and the results were further supported by florescent-activated cell sorter studies. The confocal imaging of the intestinal sections treated with ENP and EQNP containing fluorescent probe (rhodamine) showed the superiority of the EQNP to permeate deeper. Furthermore, pharmacokinetic studies on rats revealed that EQNP exhibited a 2.4-fold increase in bioavailability of etoposide than ENP with no quercetin. The developed loaded nanoparticles have the high potential to enhance the bioavailability of the etoposide and sensitize the resistant cells.
Introduction
Etoposide belongs to the class of drugs known as podophyllotoxin derivatives. It is a topoisomerase II inhibitor and promotes apoptosis of the cancer cells (Hande, Citation1998). Etoposide has been approved for the treatment of small cell lung cancer and testicular cancer. It is also used to treat non-Hodgkin’s lymphomas, Hodgkin’s disease, acute myelogenous leukemia, acute lymphocytic leukemia and various other types of cancer. However, etoposide observed to have a very low oral bioavailability (Yadav & Sawant, Citation2010), which limits its use to and relatively in-convenient parenteral route or use of high oral doses. Low oral bioavailability of etoposide is attributed to its efflux from the intestinal lumen by P-glycoprotein (P-gp) receptors, which are a class of ATP binding cassette transporters (Lo & Huang, Citation1999). Hence, a strategy to combat the P-gp induced efflux of etoposide can be very valuable for enhancing its oral bioavailability. Various chemical modulators have been successfully used to improve the bioavailability of the substrate drugs by P-gp modulation (Akhtar et al., Citation2011). Among various agents, components of herbal origin constitute the ideal P-gp inhibitors as they have been consumed since long with an intention to improve health status of human beings (Bansal et al., Citation2009). In most of the cases, different flavanoids found in herbal extracts are responsible for their P-gp inhibition activity. These flavanoids acts by a number of ways to reduce the P-gp induced efflux of the substrates. They might interact directly on the cell membrane or reduce the expression of P-gp by interfering with gene expression (Bansal et al., Citation2009). In some cases, they were also reported to act on ATPase unit of the P-gp receptor (Shapiro & Ling, Citation1997). Quercetin is one such flavanoids, abundantly available in green tea and has been well established to have P-gp inhibitory action (Lo & Huang, Citation1999; Li & Choi, Citation2009; Borska et al., Citation2010; Choi et al., Citation2011). Concomitant use of anti neoplastic agents and P-gp inhibitors has been considered to be an effective approach to enhance the oral bioavailability (Bansal et al., Citation2008). Pharmacokinetic studies in rats where quercetin was administered prior to etoposide resulted in higher oral bioavailability of etoposide (Li & Choi, Citation2009). However, the studies were done only in the drug solutions and the concept is not exploited so far for the development of dual agent formulation for etoposide. Use of quercetin in suppressing the effect of P-gp was also established by the work from our group with Irinotecan hydrochloride (Bansal et al., Citation2008). Among the various flavanoids used (quercetin, hesperitin, piperine, curcumin and naringenin), quercetin was found to have greatest impact on the oral bioavailability of the irinotecan hydrochloride. The use of polymeric nanoparticles like poly-lactic-co-glycolic acid (PLGA) has long been established for the delivery of anti-neoplastic agents (Win & Feng, Citation2005; Dandagi et al., Citation2011; Yadav et al., Citation2011). The advantage of using biodegradable polymer (PLGA and PLA) for the nanoparticle formation is their non-toxic nature along with the end-products of their degradation which can be utilized by the various metabolic pathways in the body rendering them safe for consumption. Higher cytotoxic effects have also been reported for the drug-loaded nanoparticles when compared to the free drug suspension (Yadav et al., Citation2011). Use of nanodrug delivery as a tool for co-administration of cytotoxic drugs and P-gp modulator may enable the co-localization of drug and P-gp modulator at the tissular and cellular level. This can enhance the utility of P-gp modulators and reduce their required dose for more efficient and effective effect. It was shown in resistant cell culture experiments that the association of both cyclosporin A and doxorubicin within a single nanoparticle formulation elicited the most effective growth rate inhibition as compared to other combinations of both drugs. This result was probably due to the synergistic elect achieved by combining the chemo-sensitizing compound cyclosporin A, with an effective cytotoxic drug like doxorubicin (Soma et al., Citation2000). Hence, the present work is concerned with the development of novel dual-loaded PLGA particles of the quercetin and etoposide for enhanced oral bioavailability. A comprehensive in vitro, ex vivo and in vivo investigation was also performed to validate the effectiveness of the developed formulation.
Materials and methods
Materials
Polymer PLGA (50:50, 45 kDa) was generously gifted by Resomer Evonik. Etoposide was purchased from Sigma Aldrich, Inc. (MO). MCF-7 cells (human breast adenocarcinoma breast cancer cell line) were obtained from ATCC (American Type Culture Collection, Manassas, VA). Dulbecco’s Modified Eagle Medium (DMEM) and Fetal Calf Serum (FCS) were purchased from Invitrogen (Carlsbad, CA). Penicillin streptomycin Amphotericin B mixture (PSA), trypan blue solution and 3-(4,5-dimethylthiazol-2-yl)-2, 5-diphenyl tetrazolium bromide (MTT) were from Sigma Aldrich, Inc. (St. Louis, MO). MilliQ water was used throughout which was produced in-house from Millipore Water Purification System-Q (Millipore Corporation, Bedford, NY). All the reagents used were of analytical reagent grade. Adult Wistar rats were obtained from Central Animal House Facility, Jamia Hamdard, New Delhi, India, approved by 173 CPCSEA, (Animal Protocol No 836).
Formulation development
Preparation of blank nanoparticles
Poly-lactic-co-glycolic acid nanoparticles were prepared by using single emulsification (o/w) solvent evaporation technique. A modified method of (Yadav & Sawant, Citation2010) was used. The organic phase consisting of PLGA polymer in dichloromethane (DCM) was added to the aqueous phase consisting of poly-vinyl alcohol (PVA) surfactant and sucrose (cryoprotectant) in Milli-Q water with simultaneous sonication using a probe sonicator (Bandelin probe sonifier, Danbury, CT) at 40% duty cycle, 40% power output. The resulting single (o/w) emulsion was kept for overnight stirring at room temperature for the evaporation of DCM, polymer hardening and nanoparticle formation. The resulting particles were harvested by centrifugation at 15 000 rpm for 20 min at 4 °C in Sorvall Evolution RC (Kendro, Waltham, MA), washed three times with ice-cold Milli-Q water (15 000 rpm for 20 min each) and lyophilized to get a free flowing powder. Polymeric particles were then stored at 4 °C for further use and evaluation. Taguchi (L9) orthogonal array (TOA) design was used to optimize the conditions for smaller particle size. Four process parameters: phase volume ratio, PVA concentration, PLGA concentration and sonication time, were varied to see their effect on size of the blank nanoparticles. The variability can be attributed to the signal to noise (S/N) ratio (Negi et al., Citation2013). The factors and the levels used in TOA are mentioned in .
Table 1. The optimization parameters and different levels.
Preparation of ENPs
Drug-loaded nanoparticles were prepared by the same method as described above. Etoposide along with PLGA was dissolved in DCM and processed in the same way as described. Drug to polymer ratio (w/w) was varied from 1:5, 1:10, 1:15, 1:30 and 1:50 and optimized on the basis of mean particle size, zeta potential, surface morphology and entrapment efficiency.
Preparation of quercetin and etoposide dual-loaded PLGA nanoparticles
The ratio of quercetin to etoposide (w/w) to be incorporated in the nanoparticle was optimized using florescent-activated cell sorter (FACS) study. Rhodamine, a fluorescent dye, being a P-gp substrate was taken as a substitute for etoposide. Keeping the same concentration of rhodamine (20 µM) throughout, the concentration of quercetin was varied over a range (1–20 µM). The extent of uptake of the dye by MCF-7/ADR cells was analyzed by flow cytometry or FACS. MCF-7/ADR cells were seeded at a concentration of 0.25 million cells/500 µl/well in complete DMEM on 24-well plates. The cells were incubated for 24 h (at 37 °C, 5% CO2) in a CO2 incubator (Shel Lab, Sheldon Manufacturing, Inc., Cornelius, OR). At 80% confluence, solutions of rhodamine (20 µM) and rhodamine (20 µM) + quercetin (0.2–20 µM) were added to the wells in triplicates. Untreated cells were taken as control group. The cells were then incubated for 90 min (Choi et al., Citation2011). After 90 min, DMEM was removed from the plates and cells were washed with 100 µl ice cold PBS to remove the adherent cells. The cell suspension was centrifuged at 1200 rpm for 5 min. The supernatant was collected and the cell pellet was re-suspended in 300 µl ice cold PBS. The cell suspension was added to the previously collected supernatant and was analyzed by Flow Cytometer, BD-LSR (BD Biosciences, San Jose, CA). The graphs were plotted using the software WinMDI 2.9 (West Lafayette, IN) taking FL-2 (fluorescence) on the X-axis and FSC (forward scatter) on the Y-axis. The amount of quercetin was dissolved in the organic phase (DCM) along with etoposide in the ratio obtained by FACS studies. Rest of the method was followed as per preparation of nanoparticle, described in the section titled “Preparation of blank nanoparticles” to prepare the final dual-loaded nanoparticles.
In vitro characterization of formulation
Determination of entrapment efficiency
To determine the entrapment efficiency of the developed nanoparticles, the method described elsewhere (Yadav & Sawant, Citation2010) was used with some modification. 100 mg of nanoparticles were taken and suspended in 5 ml of PBS and centrifuged at 10 000 rpm for 15 min to obtain the pellet of nanoparticles. The supernatant was removed and the pellet was further washed with PBS solution to remove any unentrapped drug. The nanoparticle pellet was then dissolved in chloroform. The obtained suspension was the centrifuged at 3000 rpm for 20 min. The supernatant was analyzed using a modified method of HPLC (Park et al., Citation2009). The entrapment capacity was calculated using the formula:
where T is the amount of drug that was added and C is the amount of drug detected.
Size and size distribution measurement
Dynamic light scattering
Malvern Zetasizer (Nano-ZS, Malvern, UK) with DTS (nano) software® (Malvern, UK) was used for nanoparticles size measurement. Nanoparticle suspension was diluted with Milli Q water and the measurements were conducted in triplicate.
Transmission electron microscopy
Nanoparticles were visualized using a JEOL 2100F electron microscope, with an accelerating voltage of 100 kV. Samples were negatively stained with a 1% aqueous solution of phosphotungstic acid and viewed under the microscope at a 100 k-fold enlargement.
Zeta potential
Surface charge (zeta potential) was measured using Zetasizer (Nano Z, Malvern Instruments and Worcestershire, UK). To determine the zeta potential, a suspension of 1–2 mg polymeric particles was prepared in sufficient Milli-Q water (neutral pH) to ensure that the signal intensity was suitable for the instrument. The suspension was then placed in the disposable zeta cell for the measurement of zeta potential.
Scanning electron microscopy
Scanning electron microscopy (SEM) was conducted to characterize the surface morphology of the vesicles. They were viewed with an EVO LS 10 (Carl Zeiss, Brighton, Germany) scanning electron microscope operating at an accelerating voltage of 13.52 kV under high vacuum. Data analysis was done using Smart SEM software program.
In vitro release studies
Freeze-dried drug-loaded nanoparticles were evaluated for in vitro drug release by using dialysis membrane. 0.1 N HCl tandem phosphate buffer (pH 6.8) was employed in the studies. The dialysis bags (MW cut off of 8–10 kDa; (Spectra/Por® Spectrum Laboratories, Inc, Rancho Dominguez, CA)) were treated as per the manufacturer’s guideline and used for the release studies. Drug-loaded PLGA nanoparticles (15 mg) were re-dispersed in 1 ml water and poured in dialysis bags. The bags were suspended in 150 ml of dissolution media, i.e. 0.1 N HCl and placed into an incubator shaker maintained at 37 °C and 100 rpm. Aliquots each of 2 ml were withdrawn at various time points (0.166, 0.33, 0.5, 1 and 2 h) over a time interval of 2 h after which the dissolution media was completely replaced with phosphate buffer pH 6.8 and samples were removed after 3, 4, 8, 12, 24, 48 and 72 h. Sink condition was maintained throughout the experiment. Etoposide in aliquots were analyzed by HPLC and cumulative percent of drug released was calculated.
In vitro cell line studies
Cytotoxicity studies by MTT assay
MCF-7 cells were seeded at a concentration of 8000 cells/100 µl/well in a 96-well plate, incubated at 37 °C, 5% CO2 and allowed to grow for 24 h. After 24 h, media was etoposide-loaded nanoparticles (ENP) and etoposide and quercetin dual-loaded nanoparticles (EQNP) were added to the cells in triplicates. Untreated cells (containing only the media) acted as the control group. Free etoposide suspension was added in a concentration range of 1–200 µg/100 µl/well, ENP and EQNP were added in the range 0.005–1 mg/100 µl/well. After 24 h of incubation, MTT assay was performed to check cell viability. For MTT assay, the media was removed from all the wells, 100 µl of 0.05 mg/ml MTT reagent was added to each well and the plates were kept in incubator for 4 h. Following this, the reagent was removed and the blue formazan crystals were solubilized in 100 µl of dimethyl sulfoxide (DMSO). The absorbance of this DMSO extract was measured at 570 nm using an ELISA plate reader. The background absorbance was taken at 650 nm. The value of absorbance is a measure of number of live cells. The corresponding values for OD for different control, free drug and optimized formulation were recorded (Mainardes & Evangelista, Citation2005).
Flow cytometric analysis for florescent particle uptake
MCF-7/ADR cells were seeded at a concentration of 0.25 million cells/500 µl/well incomplete DMEM on 24-well plates. The cells were incubated at 37 °C, 5% CO2 for 24 h in a CO2 incubator. At 80% confluence, rhodamine nanoparticles (RNP) and rhodamine + quercetin nanoparticles (RQNP) (20, 40 and 60 µl from a stock of 10 mg/ml of nanoparticles in complete DMEM) were added to the wells in triplicates. Untreated cells were taken as control group. The cells were then incubated for 90 min (Choi et al., Citation2011). After 90 min, DMEM was removed from the plates and cells were washed with 100 µl ice cold PBS to remove the adherent cells. The cell suspension was centrifuged at 1200 rpm for 5 min. The supernatant was collected and the cell pellet was re-suspended in 300 µl ice cold PBS. The cell suspension was added to the previously collected supernatant and was analyzed by flow cytometer, BD-LSR (BD Biosciences, San Jose, CA). The graphs were plotted using the software WinMDI 2.9 taking FL-2 (fluorescence) parameter on the X-axis and FSC (forward scatter) parameter on the Y-axis.
Animal studies
Intestinal permeation study by confocal laser scanning microscopy
Rats were fasted for 12 h before euthanasia. At autopsy, the abdominal cavity was opened and the ileum portion of the small intestine was uncovered. The small intestine was removed, longitudinally sliced and flushed with 0.9% sodium chloride solution to remove feces and blood. Longitudinally sliced sections of ∼4 cm each were sutured from one side and different formulations were introduced (rhodamine solution, nanoparticles containing rhodamine alone dispersed in water, nanoparticles containing both rhodamine and quercetin). The intestines were then sutured from the other side and suspended in aerated Tyrode’s solution for 60 min. After 1 h, the tissue were dismantled from the apparatus and washed with 0.9% NaCl to remove excess of the dye. Each tissue was then cut open on a separate slide with a sharp surgical blade to expose the lumen on the surface of the slide. Thin sections of ∼5 mm× 5 mm were cut carefully and sealed with a cover-slip placed on top of it. The sections were immediately stored at 4 °C and the extent of the penetration of the rhodamine dye (a P-gp substrate) in the z-axis was analyzed in each sample by laser confocal microscope with fluorescence correlation spectroscopy (FCS) (Olympus FluoviewTM FV 1000) at an excitation wavelength of 540 nm and emission wavelength of 625 nm. The surface of the sections was analyzed at an increasing depth during the microscopy to give a view of the extent of fluorescence at each level.
Pharmacokinetic studies
Animals
The animal study protocol to carry out in vivo studies was duly approved by the Institutional Animal Ethics Committee (Approval No. 836). Wistar rats of either sex were kept under standard laboratory conditions (temperature 25 ± 2 °C and RH 55 ± 5%). They were housed in polypropylene cages (two per cage) with free access to standard laboratory diet (Lipton Feed, Mumbai, India) and water ad libitum.
Experimental
The nanoparticle formulation containing ENP, EQNP and marketed soft gelatine capsule (Etosid®, Mumbai, India) were taken for in vivo pharmacokinetic studies. The dose calculation of the rats was based on bodyweight and was determined to be 9 mg/kg (Li & Choi, Citation2009). The rats were fasted for at least 24 h prior to the beginning of experiments and had free access to tap water. The animals were divided into three groups (n = 6) and were orally administered with ENP (Group I), EQNP (Group II) and Etosid® (Group III) using feeding tube. Total oral volume was kept 500 µl for each dose. At the time of blood sampling, each animal was anaesthetized with ether and blood samples (0.2 ml) were collected from the retro orbital route into EDTA containing tubes. The blood samples were collected at the time points: 0.5, 1, 2, 3, 4, 6, 8, 12, 16 and 24 h. The blood samples were immediately centrifuged for 5 min at 13 000 rpm and a 0.1-ml aliquot of plasma was stored in a freezer at −20 °C until HPLC analysis.
Effect of nanoparticle formulation on enterocytes: biochemical estimation
A comparative toxicity study was carried out to get an insight of the tissue interference by nanoparticulate formulation. Everted gut assembly was set as described. The donor compartments were filled with an aqueous solution/suspension of etoposide (0.05–0.5% W/V) and optimized nanoparticles (with equivalent amount of etoposide as well as blank), separately for 60 min with Tyrode solution in receptor compartment. Normal saline and Triton X-100 (1%) were used as negative and positive controls, respectively. After 60 min, the samples were taken from the receptor compartment and spectroscopically evaluated using Accurex biomedical kit for LDH assay.
Statistical analysis
Analysis of variance (Kruskal–Wallis one-way ANOVA) along with multiple comparison test (Student–Newman Keuls Method) and t-test (for two samples) were employed at p < 0.05.
Results and discussion
Optimization of etoposide-loaded PLGA nanoparticles
Blank PLGA nanoparticle was optimized using TOA design. The levels of various parameters affecting optimization are shown in and the size of the particles was evaluated as the optimization criteria. In the present case, the criteria of optimization was “smaller the better” and hence S/N ratio was calculated by the equation: S/N = −10 Log[()/n]. Here, “yi” represents the estimated value and “n” represents number of replicates (Negi et al., Citation2013). S/N ratios of each level corresponding to different parameters are surmised in . A larger S/N value corresponds to the lesser deviations from the observed value. It can be observed from that parameter A (Organic to aqueous phase ratio) have highest S/N value at level 2, similar to the, parameter B (Concentration of PVA), parameter C (Concentration of PLGA) and parameter D (Sonication time). In other words, A2B2C2D2 represents the optimized condition for the formulation of smallest sized nanoparticles based on the S/N values. Therefore, the optimized blank nanoparticles were prepared with an o/w phase volume ratio of 1:4, 1% PVA concentration, 5% PLGA concentration and sonication time as 90 s. Drug-loaded nanoparticles were prepared by varying the drug to polymer ratio (1:5–1:50 w/w) keeping the polymer concentration constant and were further analyzed for the entrapment efficiency. Formulation ENP-1 with a drug to Polymer ratio of 1:5 showed the maximum entrapment efficiency of 62.46 ± 1.22%. Hence, 1:05 was taken as the optimized ratio. The size and zeta potential measurement were found to be 279.2 ± 4.2 nm and −21.5 ± 2.4 mV, respectively.
Table 2. Compositions of different formulations by Taguchi orthogonal array and respective S/N ratio.
Table 3. Average S/N ratio to different levels of different parameters.
Development of quercetin–etoposide dual-loaded nanoparticles
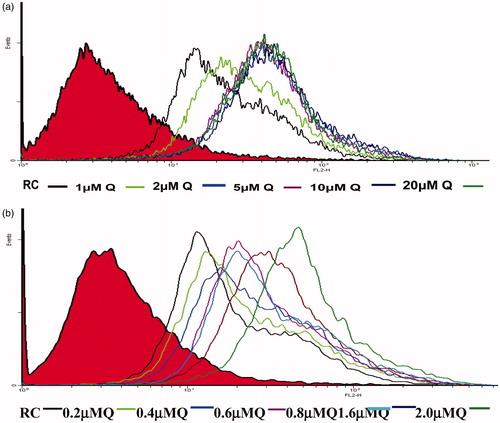
Flow-cytometric studies were conducted to optimize the ratio of quercetin to etoposide for the effective inhibition of the P-gp. Rhodamine fluorescent dye (with an additional P-gp substrate character) was taken as a substitute for etoposide. The concentration of quercetin was varied over a range (1–20 µM) by keeping the same concentration of rhodamine (20 µM) throughout. The extent of uptake of the dye by MCF-7/ADR cells was analyzed by flow cytometry or FACS. The eastward shift on the x-axis from the origin represents fluorescence exhibited by the cells. Since fluorescence is directly related to the amount of rhodamine taken up by the cells, greater the eastward shift, higher is the degree of uptake of rhodamine (). Rhodamine control group (black line after red region) indicates cells treated with only rhodamine (20 µM solution). A shift was noted as compared to the control group of untreated cells, indicating fluorescence. As keeping the concentration of rhodamine same (20 µM), MCF-7 cells were treated with constantly increasing concentrations of quercetin (from 1 to 20 µM), it was found that the uptake of rhodamine by the cells increased by increasing the concentration of quercetin but attained a saturation point after 2 µM concentration. The increased uptake of rhodamine in the presence of quercetin could be attributed to the inhibition of P-gp by quercetin and hence the uptake of rhodamine by the cells is increased. After a particular concentration of quercetin, there is no further increase in the fluorescence by increasing the concentration of the same. To get a precise picture, another set of experiment was run where the concentration range of quercetin was scaled down. The strength of quercetin solution administered was 0.2, 0.4, 0.6, 0.8, 1.6 and 2.0 µM. With each increasing concentration, a shift toward right indicates the enhanced uptake of the rhodamine by the cells. Minimum fluorescence at 0.2 µM and maximum fluorescence at 2.0 µM of quercetin was observed (). It was found that at 2 µM concentration of quercetin had optimum capacity for the maximum uptake of 20 µM rhodamine by the cancer cells. Above this ratio, there was no further enhancement in rhodamine uptake. This could be due to the saturation of receptor at this concentration. As rhodamine was used as a substitute to etoposide, the quercetin to etoposide ratio was optimized as 1:10. Optimization of formulation variables to control the size and drug entrapment efficiency of dual agent-loaded nanoparticles seems to be based on the same physicochemical principles as single agent-loaded nanoparticles prepared by O/W emulsion solvent evaporation method. Both the emulsification process and the stability of emulsion globules were the most important factors to control the particle size, while both the drug–polymer interaction and the partition of drug in organic phase were the crucial factors to govern the drug entrapment efficiency. However, the ratio drug to P-gp modulator was optimized by biological response of the P-gp over-expressing cell lines.
Figure 1. Flow cytometric analysis of increasing concentrations of rhodamine-B on MCF-7.
Visualization of optimized nanoparticles
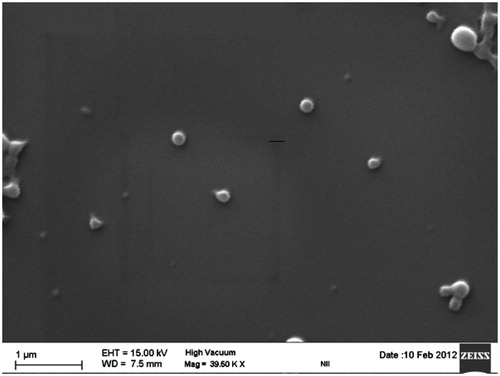
Pictures from transmission electron microscopy showed nanoparticles, which were circular in shape with well-defined boundaries (). The size and size distributions were in close proximity of the size suggested by the dynamic light scattering measurements (). Scanning microscopy results further confirmed the formation of spherical nanoparticles having uniform and smooth surface ().
Figure 2. Size and shape analysis of optimized formulation (EQNP): (a) dynamic light scattering report and (b) transmission electron microscopy photograph.
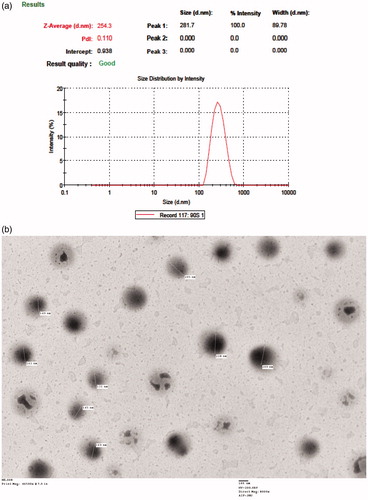
Figure 3. SEM photograph of etoposide-loaded nanoparticles.
In vitro release kinetics
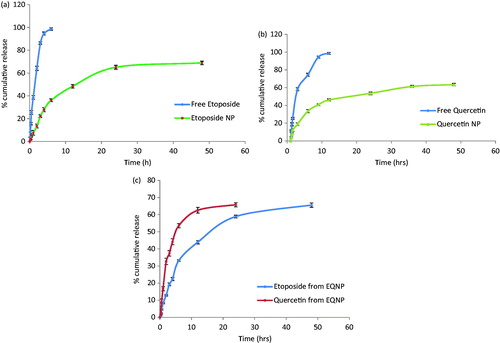
A comparative release study of etoposide from suspension, ENP and optimized EQNP formulation were performed. Similarly, the release study was performed for quercetin from suspension, quercetin-loaded nanoparticles (QNP) and EQNP in that 100% of the drug was released in ∼6 h in case of free drug suspension; whereas ENP showed a sustained release and 68.9 ± 3.2% of etoposide was released in 48 h (). The initial burst release was found to be sufficiently low (5.4 ± 1.2% in 30 min). The release study of quercetin was compared from suspension and QNP. It was observed that in contrast with the non-encapsulated quercetin, there was a pronounced time prolongation of release of quercetin from QNP. Only 67.4 ± 2.2% of quercetin was released from nanoparticles (QNP) after 24 h while ∼100% of free quercetin was detected in release medium after ∼4 h. The release profiles of quercitin from QNP suggested an initial burst release (23.6 ± 4.3%) during the first 2 h followed by a slow and sustain release (). This initial burst release was said to be due to diffusion of dissolved drug initially deposited inside the pores of the particle (Cohen et al., Citation1991). The large surface to volume ratio of the nanoparticles geometry is also responsible for the initial fast release (Yadav & Sawant, Citation2010). The release pattern of etoposide and quercetin from EQNP were recorded. It was observed that etoposide exhibited a release of 65.6 ± 2.1% in 48 h whereas quercetin had a release of 65.8 ± 3.4% in 24 h (). This indicates that quercetin was released faster than etoposide from the nanoparticle. Such a pattern of release is of specific interest as this will make the P-gp modulator, i.e. quercetin available at the site of modulation prior to the drug molecule.
Figure 4. Release profile of (a) etoposide from suspension and nanoparticle (ENP); (b) quercetin from suspension and nanoparticle (QNP) and (c) etoposide and quercetin from EQNP (n = 3).
In situ cell line studies
Cytotoxicity studies by MTT assay
The MTT assay was performed to compare the IC50 values of etoposide in suspension, ENP and etoposide and quercetin dual-loaded nanoparticles (EQNP) and is shown in . It was observed that after 24 h of MTT assay, etoposide in suspension form was cytotoxic and showed a linear relationship between concentration and cell death. The lowest concentration of etoposide (1 µg/well = 17 µM) caused 4.94 ± 1.3% cell death, while, the between percentage cell survival and concentration of etoposide at 50% cell survival. The IC50 value was calculated to be 2047.5581 ± 12.34 µM. In case of ENP, the IC50 value for ENP was calculated to be 226.2518 ± 11.32 µM. Similarly, for the dual-loaded nanoparticle (EQNP), the IC50 value was found out to be 176.9177 ± 11.87 µM. The IC50 values were calculated accordingly by using the linear equation. A comparative cell death percentage was observed at the same concentration (10 µM) for free etoposide, ENP, EQNP, dummy (Empty) nanoparticle (DNP) and QNP. It was observed that DNP and QNP showed a cell death of 9.61% and 9.09%, respectively, at 10 µM. Values for cell death for free etoposide; ENP and EQNP were 19.74%, 42.598% and 54.54% at 10 µM concentrations (). Hence, it can be concluded that the drug delivered by a nanoparticle carrier system to the cells is much more effective than the free drug itself. It maybe because of the small size of the nanoparticles, which facilitates their uptake by the cells. The presence of quercetin along with etoposide in the nanoparticle enhanced the uptake of etoposide by 1.28-fold when compared with etoposide alone loaded nanoparticle. This may be due to the inhibition of P-gp expressed at the surface of the cancer cells (MCF-7 in this case) by quercetin, thereby reducing the efflux of etoposide out of the cell. Etoposide being a P-gp substrate is not able to exert its maximum cytotoxic effect as it is thrown out of the cell by the P-gp. But, in the presence of quercetin and its co-localized delivery at the cell surface site, quercetin inhibits the action of P-gp and facilitates the entry of etoposide into the cells.
Figure 5. Comparative % cell death at same concentration (10 μM) of different nanoparticles with free etoposide (where, Efree is free etoposide suspension, ENP is etoposide nanoparticles, EQNP is etoposide and quercetin dual loaded nanoparticles, DNP is dummy nanoparticles and QNP is quercetin loaded nanoparticles).
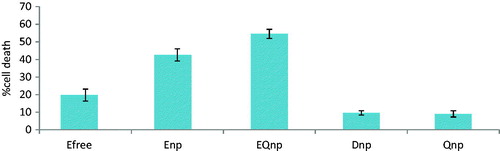
Table 4. IC50 values of different formulations.
Cell uptake studies by FACS
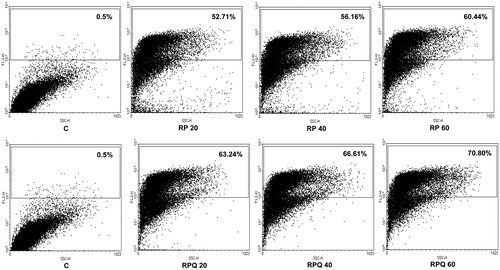
MCF-7 cells were treated with rhodamine-loaded nanoparticles (RP) and rhodamine and quercetin dual-loaded nanoparticles (RQP). The dot plot of fluorescence exhibited by the MCF-7 cells is depicted in . 10 mg/ml particle stock of both the formulations was prepared and 20, 40 and 60 µl of this was added to each well. It was observed that there was a concentration dependent increase in uptake (fluorescence) in both the cases. However, the uptake was significantly higher (∼10%) (p < 0.05) in case of rhodamine and quercetin dual-loaded nanoparticles (RQNP) than rhodamine-loaded nanoparticles (RNP) for all the concentrations tested. When treated with rhodamine encapsulated nanoparticle (RNP) (20 µg/ml), 52.71% cells exhibited fluorescence. Whereas, on treatment with rhodamine + quercetin dual-loaded nanoparticle (RQNP) at the same concentration, 63.24% cells showed fluorescence. There was a 20% increase in fluorescence with RQNP when compared with RNP, indicating the corresponding increase in uptake of rhodamine by the cells. The percentage enhancement in the fluorescence was found to increase linearly with the increasing the concentration of the RQNP added to the cells. The uptake of rhodamine in the MCF-7 cells is facilitated by the co-encapsulated quercetin in the nanoparticle.
Figure 6. Comparative dot plot analysis of uptake of rhodamine-B particles (RP) and rhodamine and quercetin dual-loaded particles (RPQ) in MCF-7 cells. C = control cells.
Rhodamine a P-gp substrate is effluxed out of the cells by the P-gp expressed on the surface of cancer cells. The co-localized delivery of quercetin from the nanoparticle at the cell surface enhances the penetration of rhodamine into the cells resulting in increased fluorescence (uptake) by the MCF-7 cells. Since rhodamine was taken as a substitute for etoposide, it can be estimated that the uptake of etoposide will also be enhanced by the colocalized delivery of quercetin from the nanoparticle formulation in the same way in which it facilitates rhodamine uptake by the cells.
Animal studies
Intestinal permeation study by confocal laser scanning microscopy
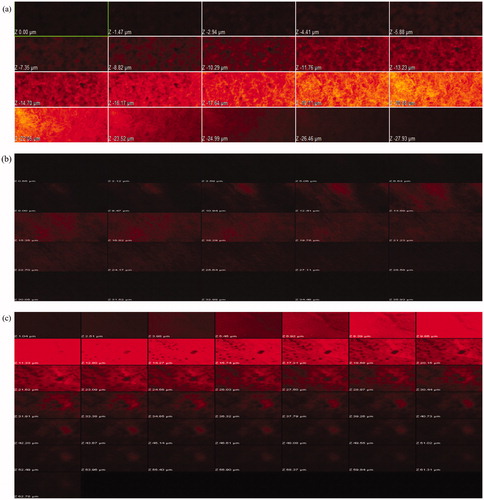
The confocal laser scanning microscopy studies for intestinal permeability were carried out using rhodamine as fluorescent probe, which itself is a P-gp substrate. The study was carried out for 60 min and the tissue slides were observed by scanning along the “Z” axis at various depths. In case of rhodamine solution, fluorescence was observed only up to 23.80 µm (). The permeation of the dye was found to be hampered by P-gp receptors present in the intestine. Use of nanoparticles had increased the depth of rhodamine permeation to 28.58 µm (). Significantly, better results were observed by using quercetin and dye dual-loaded nanoparticles. The co-localized delivery of dye and P-gp modulator (Quercetin), resulted in greater depth of penetration, i.e. 62.78 µm ().
Figure 7. Confocal laser scanning microscopic pictures of intestine treated with (a) rhodamine-B solution, (b) nanoparticles containing rhodamine-B and (c) dual-loaded nanoparticles containing rhodamine-B and quercetin.
Pharmacokinetic studies
Pharmacokinetic analysis was performed by non-compartmental (model independent) method. The comparative pharmacokinetic profiles of etoposide from etoposide-loaded PLGA nanoparticles (ENP), etoposide–quercetin dual-loaded nanoparticles (EQNP) and marketed etoposide formulation (Etosid®), following the oral administration, are illustrated in and the pharmacokinetic parameters are summarized in . The maximum concentration (Cmax) attained by etoposide in the systemic circulation from EQNP, ENP and Etosid® were observed to be 1256 ± 198.3 ng/ml, 585.6 ± 38.9 ng/ml and 516.2 ± 25.6 ng/ml, respectively. The time required by etoposide to reach the maximum concentration (tmax) from Etosid, ENP and EQNP were found to be 0.5 ± 0.02 hrs, 2 ± 0.12 hrs and 1 ± 0.08 hrs respectively. As suggested by the values of tmax, the release of etoposide from nanoparticle was more sustained when compared to the market preparation Etosid® that resulted in higher tmax for ENP and EQNP. It was observed that the time taken to reach Cmax by EQNP was significantly lower (p < 0.05) than the time taken by ENP. The area under the plasma concentration time curve (AUC) for different treatments was calculated by the trapezoidal method. The AUC of etoposide for EQNP, ENP and Etosid® were found to be 5589 ± 455.8 ngh/ml, 2494 ± 399.9 ngh/ml and 1452 ± 213 ngh/ml, respectively. The elimination rate constant (Kel) was calculated by log-linear regression of etoposide concentration data during the elimination phase. The values of Kel for ENP, EQNP and Etosid® were found to be 0.2163 ± 0.011 h−1, 0.2137 ± 0.018 h−1 and 0.2851 ± 0.009 h−1, respectively. The terminal half-life (T1/2) was calculated as 0.693/Kel. The T1/2 values for ENP, EQNP and Etosid® were calculated as 3.204 ± 0.087 h, 3.243 ± 0.199 h and 2.431 ± 0.118 h, respectively. T1/2 of etoposide was higher in case of both, ENP and ENQP in comparison to Etosid®. As represented by the figure and the data from table, a marked difference in pharmacokinetic parameters of etoposide by developed nanoparticles. EQNP had a significantly increased (p < 0.05) peak plasma concentration (Cmax) from ENP by 2.144-fold and Etosid® by 2.433-fold. This can be attributed to the inhibition of P-gp by quercetin which facilitates the absorption of etoposide from the enterocytes and hence increases the Cmax. However, tmax values of both ENP as well as EQNP were higher than marketed formulation, suggesting a slower release of the drug from the nanoparticles. The pharmacokinetic data also demonstrated that the presence of quercetin in the nanoparticle (EQNP) significantly (p < 0.05) increased the AUC of etoposide. Bioavailability enhancement was found to be 2.24-fold when EQNP was compared to ENP and 3.84-fold when EQNP was compared to market preparation Etosid® soft gelatine capsule. This implies that the absorption of etoposide from EQNP was higher than ENP and market preparation Etosid®. This might be due to the P-gp inhibition by quercetin which can prevent the efflux out of the drug from the enterocytes. These findings were also strengthened by the confocal data (see the section “Intestinal permeation study by confocal laser scanning microscopy”) which clearly showed the intestinal penetration depth of rhodamine was significantly increased (p < 0.05) in the presence of quercetin by 2.196-fold than when rhodamine was used alone. Quercetin facilitated the penetration of rhodamine by inhibiting the P-gp which decreased the efflux of rhodamine from the intestinal lumen. Hence, the co-encapsulation of quercetin resulted in greater rate as well as extent of absorption of etoposide.
Figure 8. Plasma time profile of etoposide from etosid, etoposide-loaded nanoparticle (ENP) and etoposide–quercetin dual-loaded nanoparticle (EQNP).
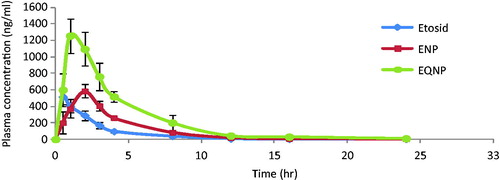
Table 5 .Pharmacokinetic parameters of etoposide formulations.
Elimination rate constant, Kel, of etoposide decreased in case of both ENP and EQNP in comparison with Etosid®. However, there was not much difference in Kel of ENP and ENQP. This might be due to the fact that quercetin had an influencing role in the enhancement of drug absorption by inhibition of P-gp efflux, but no effect on disposition or elimination of the drug reached in systemic circulation. It was also evident from the Kel values that as the elimination of etoposide from ENP and EQNP were slower than Etosid®, their duration of residence in the body was more. Hence, their terminal half life was lesser than Etosid®. However, there was not much difference in T1/2 of ENP and EQNP. Therefore, it was concluded that quercetin might not have any significant effect on disposition or elimination of the drug.
Effect of nanoparticle formulation on enterocytes: biochemical estimation
The biochemical estimation of LDH from the everted gut assembly depicts the toxic effect of treatments on enterocytes. Normal saline and Triton X-100 were used negative and positive control for tissue damage, respectively. A higher LDH release corresponds to higher tissue damage. It was observed that blank nanoparticles as well nanoparticles with drug had lower toxic potential. This might be the low toxicity of biodegradable PLGA particle with optimal surfactant. Furthermore, the drug-loaded particles have lower toxic potential than free etoposide due to slower release of drug from the particles which accounts for lower drug accumulation at one site and less tissue damage.
Conclusion
The novel drug-modulator dual-loaded nanoparticle formulation of etoposide was found to be capable of increasing the penetration of drug through the intestinal wall and significantly enhancing cytotoxicity by increasing the uptake in the P-gp over expressing cancer cells. In addition, the pharmacokinetic parameters exhibited a sustained release with an increase in the bioavailability. Hence, this developed formulation with amalgamation benefits of nanosized system and chemical P-gp modulator, was found to be a good replacement for conventional oral formulations with decreased dose, frequency of dosing and toxic effects. The future perspectives include study of effects of different P-gp modulators and clinical trials for developing a clinically viable formulation.
Acknowledgements
The authors acknowledge the financial help provided by AICTE, Government of India.
Declaration of interest
The authors have no conflict of interest to be declared. We also acknowledge National Institute of Immunology for their support in cell line studies and Resomer Evonik for the PLGA as gift sample.
References
- Akhtar N, Ahad A, Khar RK, et al. (2011). The emerging role of P-glycoprotein inhibitors in drug delivery: a patent review. Expert Opin Ther Pat 21:561–76
- Bansal T, Awasthi A, Jaggi M, et al. (2008). Pre-clinical evidence for altered absorption and biliary excretion of irinotecan (CPT-11) in combination with quercetin: possible contribution of P-glycoprotein. Life Sci 83:250–9
- Bansal T, Jaggi M, Khar RK, Talegaonkar S. (2009). Emerging significance of flavonoids as p-glycoprotein inhibitors in cancer chemotherapy. J Pharm Pharm Sci 12:46–78
- Borska S, Sopel M, Chmielewska M, et al. (2010). Quercetin as a potential modulator of P-glycoprotein expression and function in cells of human pancreatic carcinoma line resistant to daunorubicin. Molecules 15:857–70
- Choi JS, Piao YJ, Kang KW. (2011). Effects of quercetin on the bioavailability of doxorubicin in rats: role of CYP3A4 and P-gp inhibition by quercetin. Arch Pharm Res 34:607–13
- Cohen S, Yoshiaka T, Lucarelli M. (1991). Controlled delivery system for proteins based on poly (lactic/glycolic acid) microspheres. Pharm Res 8:713–20
- Dandagi P, Patel P, Patil P, et al. (2011). Development and characterization of a particulate drug delivery system for etoposide. Indian J Novel Drug Deliv 3:43–51
- Hande KR. (1998). Clinical oncology update etoposide: four decades of development of a topoisomerase II inhibitor. Eur J Cancer 34:1514–21
- Li X, Choi JS. (2009). Effects of quercetin on the pharmacokinetics of etoposide after oral or intravenous administration of etoposide in rats. Anticancer Res 29:1411–5
- Lo YL, Huang JD. (1999). Comparison of effects of natural or artificial rodent diet on etoposide absorption in rats. In Vivo 13:51–5
- Mainardes RM, Evangelista RC. (2005). PLGA nanoparticles containing praziquantel: effect of formulation variables on size distribution. Int J Pharm 290:137–44
- Negi LM, Talegaonkar S, Jaggi M. (2013). A logical approach to optimize the nanostructured lipid carrier system of irinotecan: efficient hybrid design methodology. Nanotechnology 24:241–14
- Park J, Fong PM, Lu J, et al. (2009). PEGylated PLGA nanoparticles for the improved delivery of doxorubicin. Nanomedicine 5:410–8
- Shapiro AB, Ling V. (1997). Effect of quercetin on Hoechst 33342 transport by purified and reconstituted P-glycoprotein. Biochem Pharmacol 53:587–96
- Soma CE, Dubernet C, Bentolila D, et al. (2000). Reversion of multidrug resistance by co-encapsulation of doxorubicin and cyclosporin A in polyalkylcyanoacrylate nanoparticles. Biomaterials 21:1–7
- Win KY, Feng S. (2005). Effects of particle size and surface coating on cellular uptake of polymeric nanoparticles for oral delivery of anticancer drugs. Biomaterials 26:2713–22
- Yadav KS, Sawant KK. (2010). Formulation optimization of etoposide loaded PLGA nanoparticles by double factorial design and their evaluation. Curr Drug Deliv 7:51–64
- Yadav KS, Chuttani K, Mishra AK, Sawant KK. (2011). Effect of size on the biodistribution and blood clearance of etoposide-loaded PLGA nanoparticles PDA. J Pharm Sci Technol 65:131–9