
 ?Mathematical formulae have been encoded as MathML and are displayed in this HTML version using MathJax in order to improve their display. Uncheck the box to turn MathJax off. This feature requires Javascript. Click on a formula to zoom.
Abstract
Hydrophobicity of PLA nanoparticles makes them a good substrate for macrophageal and reticulo-endothelial system uptake. Long-circulating properties can be imparted to these particles by coating them with hydrophilic stabilizers. Surface-modified PLA nanoparticles loaded with anti-cancer agent temozolomide were fabricated by solvent evaporation method and coated with surface modifiers. Selection of the surface modifier was based upon uptake of nanoparticles by K9 cells (liver cells). The particles were prepared and characterized for various physicochemical properties using transmission electron microscopy, differential scanning calorimetry, powder X-ray diffraction and in vitro dissolution studies. In vitro BBB permeation studies were performed using the co-culture model developed by using Madin–Darby canine kidney and C6 glioma cells as endothelial and glial cells, respectively. In vitro C6 glioma cell cytotoxicity, cellular proliferation, cellular migration and cellular uptake studies due to developed nanoparticles was assessed. In vivo studies such as pharmacokinetics, qualitative and quantitative biodistribution studies were performed for the developed nanoparticles. Drug-loaded nanoparticles with entrapment efficiency of 50% were developed. PEG-1000 and polysorbate-80 coated nanoparticles were least taken up by the liver cells. Characterization of the nanoparticles revealed formation of spherical shape nanoparticles, with no drug and excipient interaction. In vivo pharmacokinetics of developed nanoparticles depicted enhancement of half-life, area under the curve and mean residence time of the drug. Qualitative and quantitative biodistribution studies confirmed enhanced permeation of the drug into the brain upon loading into nanoparticles with less deposition in the highly perfused organs like lung, liver, spleen, heart and kidney.
Introduction
Approaches for the treatment of brain tumors (gliomas) are invasive, pharmacological or physiological (Gabathuler et al., Citation2010). The invasive techniques involve either reversible or irreversible opening/disruption of the blood–brain barrier (BBB) followed by delivery of agents. Site-specific drug delivery can be achieved by localized implanting of drug-carrying wafers, stereotactic injections or by convection-enhanced drug delivery. However, such methods suffer many limitations such as danger of infections and entry of foreign matter into the brain (Groothuis, Citation2000; Gabathuler et al., Citation2010). Also, in diffused gliomas, the drug may get cleared before it reaches cancer cells. An alternative approach to obtain a better distribution profile of drug is to entrap drug in nanocarriers, such as nanoparticles, liposomes, and solid lipid nanoparticles. Through surface-modified drug delivery systems, the diffused gliomas will be better exposed to drug. The surface modification can be achieved by passive or active targeting of the particles. Passive targeting of cancers can be attempted by taking advantage of the enhanced permeability and retention effect (EPR effect). Whereas active targeting involve cancer targeting via ligands, molecules or agents; identified by the cancerous cells and possibly by the BBB endothelial cells.
Properties of nanoparticulate-based polymeric drug delivery systems such as biodegradability; biocompatibility and amphiphilic characteristics; controlled release; targeted delivery; and therapeutics due to tunable particle size, surface morphology and hydrophobicity of the particles make them promising delivery systems (Kumari et al., Citation2010). The interaction with cell membrane is dependent on the size and size distributions of nanoparticles. Further, the penetration across the physiologic drug barriers, distribution into various tissues and site-specific targeting of nanoparticles is dependent on particle size (Brannon-Peppas and Blanchette, Citation2004). Cellular internalization of the nanoparticles, adsorption of blood components onto nanoparticle surface, interaction with charged cell membranes and stability of nanoparticles in circulating fluids is dependent on surface charge of the particles (Feng, Citation2004). Conventional nanoparticles that are hydrophobic in nature allow adsorption of proteins on the surface. These proteins are recognized by the opsonins and phagocytosized by the macrophages of the mononuclear phagocyte system (MPS) followed by rapid clearance from general circulation. However, for targeted delivery, maintenance of nanoparticles in systemic circulation is required. Hydrophilic stabilizers such as poloxamers, polyethylene glycols, propylene glycols, poloxamines and polysorbates are few hydrophilic stabilizers which are frequently used for coating hydrophobic surfaces (Moghimi et al., Citation2005). A cloud of chains is created by hydrophilic stabilizer after coating the surface of hydrophobic polymer. The created cloud will repel plasma proteins thus avoid opsonization and impart long circulation properties to nanoparticles (Brigger et al., Citation2002). Hence, it was decided to prepare nanosized particles covered with hydrophilic surface modifier.
In recent years, polymeric nanoparticles made up of poly(lactic-co-glycolic acid) (PLGA) and poly(lactic acid) (PLA) nanoparticles (100–300 nm) have been proven as potential drug carriers across the BBB. Among the many stabilizers used, polysorbate-80 has received great attention and has been tried by many researchers. Polysorbate-80-coated nanoparticles adsorb apolipoprotein E/B from the blood on the surface and behave like low-density lipoprotein molecule (LDL). Such particles interact with LDL receptors and thus endocytosed and passed through the BBB (Kreuter et al., Citation2003).
For the current study, in vitro activity was investigated on U-87 MG cell line. Though there are numerous reports on use of polysorbate-80 for coating nanoparticles, we propose to use PEG-1000 for coating PLA nanoparticles (Azmin et al., Citation1985; Pardridge, Citation2005). To investigate the difference between performance of PEG-1000 batches and polysorbate-80 coated batches, they were included in few of our in vitro cell line study.
In our study, we have designed PLA nanoparticles loaded with temozolomide (TMZ) and such particles were coated with various hydrophilic stabilizers. The uptake of such nanoparticles by liver cells was investigated by employing K9 cells. For enhanced targeting gliomas efficiency, we designed long-circulating PLA nanoparticles with better entrapment efficiency and high loading of TMZ.
Materials and methods
PLA was obtained as a gift sample from Evonik (Mumbai, India). TMZ was a generous gift sample from Cipla Ltd, Mumbai, India. All the other chemicals and reagents required for performing the experiments were of the highest possible grade.
Preparation of nanoparticles
An earlier-reported solvent evaporation method was used for fabrication of blank (P-NP) as well as drug-loaded PLA nanoparticles (TMZ-PLA-NP). This method has been discussed by Jain et al. (2013b) and Xu et al. (Citation2005). PLA was dissolved in sufficient volume of organic solvent to obtain a clear solution. The resulting solution (organic phase) was emulsified with pre-chilled (at 4 °C) stabilizer solution slowly on a high-speed homogenizer (IKA T-18 ULTRA-TURRAX, Bangalore, India) at a speed of 15 000 rpm. The resulting emulsion was poured immediately into chilled stabilizer solution kept under magnetic stirring for up to 2 h for complete evaporation of organic solvent.
Optimization of nanoparticles
The developed formulation was optimized for various formulations and process parameters. The independent parameters are discussed herewith and the effect of these parameters on particle size and polydispersity index (PI) was studied.
Optimization of process variable
Optimization of stirring speed
Among the process variables, stirring speed which is responsible for emulsification of organic solvent and aqueous phase was optimized. Stirring speed had an effect on the particle size and PI and the results are indicated in . The speed at which particles with least size and PI were obtained and were selected for further production of nanoparticles.
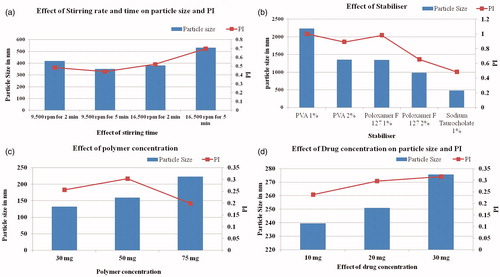
Figure 1 (a) Effect of stirring time and speed on particle size and PI. Particle size and PI are affected with the stirring speed and the stirring time. At the stirring speed of 9500 rpm and the stirring time of 2 and 5 min, the average particle size was found to be ∼415 and 350 nm, respectively. At the stirring speed of 16 500 rpm for 2 and 5 min, the size was ∼375 and 525 nm. (b) Effect of stabilizer on particle size and PI. The granulometric distribution of particles is affected by the stabilizer type and concentration, PI of the particles was also affected. (c) Effect of polymer concentration on particle size and PI. Any increase in the concentration of the polymer leads to increase in particle size and PI. (d) Effect of drug concentration on particle size and PI. As the drug concentration is increased, particle size and PI increases thus the particle size and PI are dependent on drug concentration as well.
Optimization of formulation parameters
Optimization of stabilizer
TMZ-PLA-NP were formulated using stabilizers at different concentrations, namely polyvinyl alcohol, Poloxamer-407 and sodium tauroglycholate by aforementioned procedure. Based upon the particle size and PI, optimum surfactant and its concentration were selected. The results are shown in .
Effect of polymer concentration
To study the effect of polymer concentration on particle size and PI, three concentration of polymer, namely 25, 50 and 75 mg per 15 ml of nanodispersion were tried. Nanoparticles at these concentrations of polymer were prepared using the described procedure with 1% w/w sodium tauroglycholate stabilizer solution. The particle size and PI for the nanodispersion were measured on Malvern Zetasizer 90S (Worcestershire, UK) and the results are shown in .
Effect of drug concentration
To study the effect of drug concentration on particle size and PI, three concentration of drug, namely 10, 20 and 30 mg were tried. Nanoparticles at these concentrations of drug were prepared using the described procedure with 1% w/w sodium tauroglycholate stabilizer solution. The particle size and PI for the nanodispersion were measured on Malvern Zetasizer 90S and the results are shown in .
Freeze drying of nanoparticles
To improvise and maintain the stability of TMZ-PLA-NP, freeze drying was carried out. Cryoprotectants like sucrose, lactose, sorbitol, dextrose and mannose were screened. The process steps consist of primary drying at −40 °C for 24 h, drying at 0 °C for 5 h followed by 10 °C for 2.5 h and 15 °C for 2 h and secondary drying at 25 °C for 2.5 h. The chamber pressure and cold trap temperature was maintained at 20 Pa and −50 °C during entire process (Martin Christ Lyophiliser, Osterode am Harz, Germany). P-NP were lyophilized similarly and retained for further characterization studies. Freeze-dried TMZ-NP and P-NP were reconstituted and parameters like particle size and polysipersity index were studied to optimize the cryoprotectant type and its concentration. A batch of P-NP and TMZ-PLA-NP were lyophilized without cryoprotectant and used as controls (). The batches free of cryoprotectant were used for transmission electron microscopy (TEM) and differential scanning calorimetry (DSC) measurements.
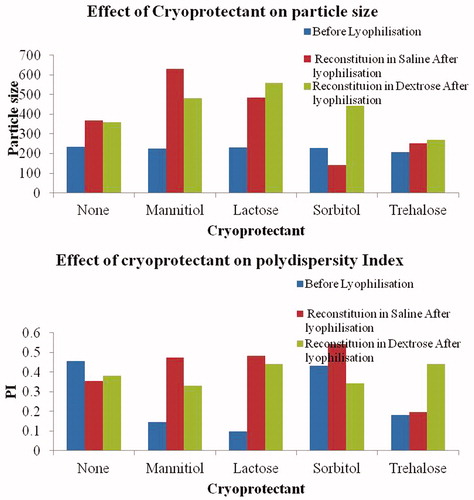
Figure 2. Particle size and PI assessment post-lyophilization of samples. The particle size and PI for the samples before lyophilization were 234 nm and 0.455, respectively. The particle size increased after lyophilization and upon reconstitution in saline and dextrose. It was observed that trehalose is the most suitable cryoprotectant for maintaining the particle size and PI of the particles both pre- and post-lyophilization.
Preparation of surface-modified nanoparticles
The optimized batch prepared using the discussed procedure was selected for surface modification. Surface-modified nanodispersions were prepared by incubating the preformed nanodispersions with surface modifiers, namely Poloxamer-188, PEG-400 and PEG-1000, Polysorbate-80 and propylene glycol on a magnetic stirrer for 24 h. The modification of the surface of nanoparticles was confirmed by recording the particle size and PI. For TEM, DSC and powder X-ray diffraction (P-XRD) studies, the samples were lyophilized without any cryoprotectant on a Martin Christ Lyophiliser.
Particle size analysis and PI measurements
The average particle size and PI for nanoparticles coated with PEG-1000 was determined on a Malvern Zetasizer 90S (version 6.12). The samples (20 μl) were suitably diluted using double-distilled water and the particle size of the diluted sample was noted using the instrument. The cuvette was filled with the sample and the cuvette was placed in the instrument and operated (Nerkar et al., Citation2012). Particle size was noted and the obtained results are shown in .
Table 1. Formulations prepared using ethyl acetate as organic solvent and various hydrophilic and hydrophobic stabilizers.
Table 2. Particle size, PI and zeta potential for surface-modified PLA nanoparticles.
Zeta potential and diffusion coefficient measurements
The zeta potentials for the developed nanodispersions were determined using Malvern Zetasizer 90S using the procedure described in our earlier report. Suitably, diluted samples were placed in glass cuvette and fitted with dip cell. These cells were inserted in the Malvern Zetasizer 90S and zeta potentials was recorded as shown in .
Table 3. Zeta potential measurements for designed PLA nanoparticles.
K9 cell uptake studies performed using FACS
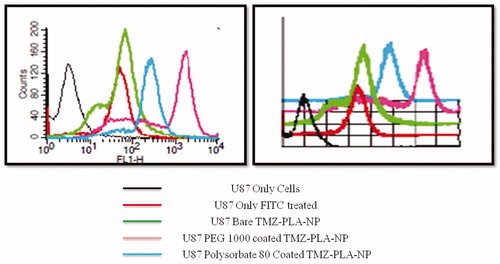
The uptake of the surface-modified nanoparticles by the liver cells was studied using in vitro normal liver cell line (K9). Earlier-reported procedure was used for testing the non-specific cellular uptake of the surface-modified nanoparticles (Jain et al., 2013b). For our studies, coumarin-6 (60 µg/ml) was loaded into PLA nanoparticles and these particles were surface modified with predetermined surface modifiers. Nanoparticulate formulations were incubated with subconfluent cultures of K9 cells for 30 min. Post-exposure of K9 cells with nanoparticles (bare and coated), cells were thoroughly washed, trypsinized and harvested. The cells were fixed using 1% paraformaldehyde (PFA) solution and washed with phosphate-buffered saline (PBS) and finally suspended in PBS. The suspension was used for acquisition on FACSCalibur (Becton, Dickinson and Company, Mountain View, CA) and the results were analyzed using CellQuest software (Becton Dickinson, NJ). depicts the cellular uptake results for surface-modified nanoparticles.
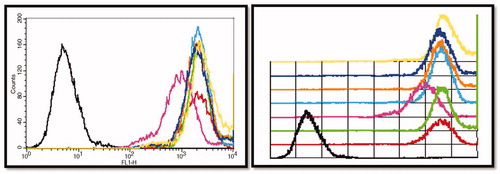
Figure 3. K9 liver cell uptake study performed for surface-modified PLA nanoparticles. Bare nanoparticles due to hydrophobic polymer covering were readily taken showing the highest uptake while least was demonstrated by particles coated with Tween-80 followed by the particles coated with PEG-1000.
Characterization of surface-modified nanoparticles
From the liver uptake study, it was clear that PEG-1000 coated particles are least taken up by the liver cells. Also, polysorbate-80 coated particles are not readily taken up the liver cells. However, in the presence of polysorbate-80 the cells appeared weak and hence was not considered for further characterization purpose. Optimized formulation coated with PEG-1000 was selected for further characterization process. The developed formulation was characterized for particle size, drug–excipient interaction, modification in the crystalline structure and surface characteristics. The results for the characterization of the drug are shown in the following section.
Transmission Electron Microscopy
TEM was performed to study the morphology and size of the developed TMZ-PLA-NP (Formulation K coated with PEG-1000). Nanoparticles were investigated on a Philips CM200 machine (Amsterdam, Netherlands) operated at voltages of 20–200 kV with a resolution of 2.4 Å. Nanodispersions dried on a copper slide with carbon grid were placed in the instrument and scanned for the particles. The shape and morphology of the particle was investigated and the images obtained are shown in .
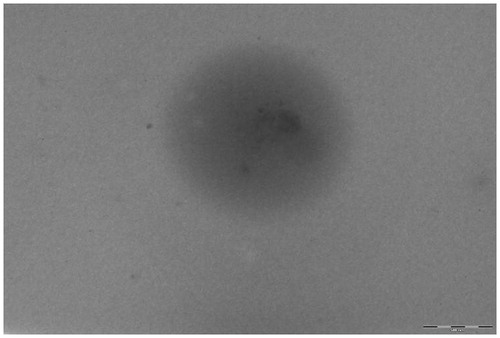
Figure 4. TEM image for TMZ-PLA-NP. Formation of smooth, homogenous and spherical particles was confirmed with TEM analysis as seen in . The particle size (∼200 nm) obtained by the TEM analysis corroborates the findings of dynamic light scattering readings.
DSC studies
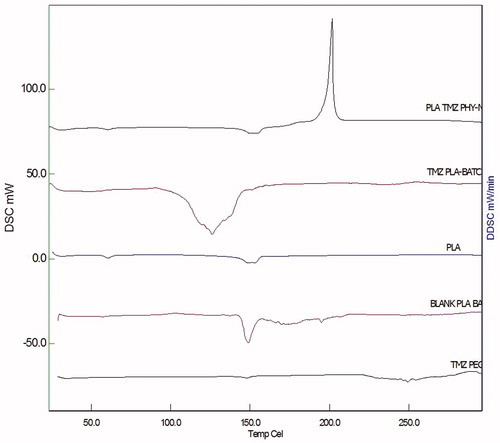
DSC studies were performed to assess the interaction between the drug and the excipient. DSC analysis of the drug TMZ, PLA, TMZ-PLA-NP coated with PEG-1000 and B-NP was performed on S11 nanotechnology (Seiko, Japan) DSC6220. Approximately 10 mg of the sample was weighed in standard aluminum pans and subjected to heating under nitrogen purging at rate of 10°/min. The samples were heated in the temperature range of 25–300 °C and the thermograms were recorded. Standard empty aluminum pan was used as reference standard (Nerkar et al., Citation2012) and the recorded thermograms are shown in .
Figure 5. DSC thermograms for TMZ, PLA, P-NP and TMZ-PLA-NP. From the DSC thermogram, it was confirmed that the drug was dispersed at molecular level in the formed polymeric matrix. The developed nanoparticles exhibited no interaction between the drug and the excipient.
P-XRD studies
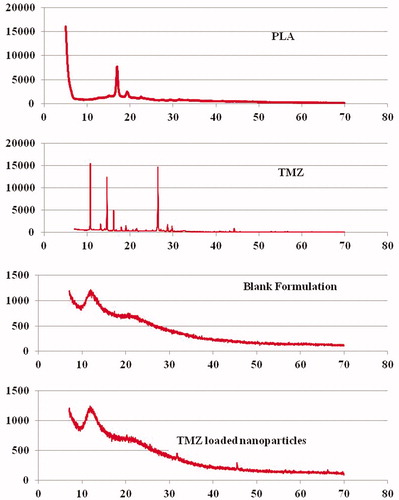
P-XRD pattern was studied on a Perkin Elmer X-ray diffractometer (MA). To study the changes in the crystalline behavior, X-ray diffraction was investigated for drug, PLA polymer, TMZ-PLA-NP and B-NP. Briefly, the sample was sprinkled to form a 0.5-mm thickness and spreaded over vacuum grease-coated glass slide and targeted using Cu Kα radiation (λ = 0.15418 nm) target filter at a voltage/current of 40 kV/30 mA. Scanning of the sample was performed at a speed of 4°/min in the radiation diffraction angle (2θ) range of 5–70° i.e. 3 ≤ 2θ ≤ 40°. X-ray diffraction patterns obtained are indicated in (Jain et al., 2013b).
Figure 6. P-XRD pattern for PLA, TMZ, blank and drug-loaded nanoparticulate formulations. P-XRD pattern obtained for the drug demonstrates the highly ordered crystalline nature of the drug. The hollow pattern obtained for the B-NP indicates formation of sub-crystalline or amorphous particles of PLA.
Encapsulation efficiency
Encapsulation efficiency (EE %) for the developed formulation was assessed using the centrifugation technique. The developed TMZ-PLA-NP formulations (1 ml) were placed in a centrifuging tube (15 ml). Formulations with a polymer drug ratio 13:1, 7.5:1 and 3.57:1 were centrifuged up to 15 000 rpm at 4 °C on a REMI cold centrifuge (Remi Equipments Ltd, Mumbai, India) for 20 min. The supernatant was carefully separated in another glass-stoppered test tube and diluted to 10 ml with sodium acetate buffer (pH 5). Absorbance for the diluted solution was recorded at 255 nm. The amount of the drug trapped in nanoparticles was determined from the amount of the drug found in the supernatant. It was calculated using the formula:
In vitro dissolution study
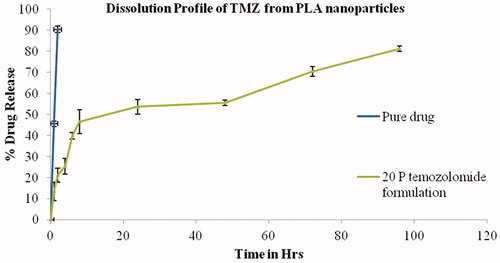
In vitro dissolution study was performed using dialysis membrane as reported earlier. TMZ-PLA-NP and TMZ equivalent to 20 mg were weighed and transferred into dialysis bags sealed at one end by thread [cutoff 6–8 kDa and diameter 21.5 mm (HIMEDIA, Mumbai, India dialysis membrane-50)]. The powders were suspended in 1 ml of dissolution medium and bags sealed. The bags were dialyzed by suspending in 500 ml of sodium acetate buffer (pH 5) as dissolution medium. Dissolution was performed on 8 T dissolution apparatus (ELECTROLAB Pvt. Ltd, Mumbai, India) at rotation speed of 100 rpm. Aliquots were withdrawn at different time-points and each time 1 ml was withdrawn and replenished with the same medium. The volume of the aliquot was made to 10 ml with dissolution medium and the absorbance measured at λmax of 255 nm on a Jasco UV spectrophotometer (Easton, MD). The percent drug release was calculated and plotted against time. The resultant concentrations at various time-points are given in .
Figure 7. Dissolution profile for TMZ and TMZ-PLA-NP. A biphasic release pattern of TMZ was exhibited from the developed nanoparticles characterized by an initial rapid release of 30% drug during the first 2 h, followed by a slower and continuous release at extremely slow rates for a period of 7 days the release pattern was in respect to the amount of drug encapsulated into the system.
Cell line
U-373 MG glioma cells [National Centre for Cell Science (NCCS), Pune, Maharashtra, India] were cultured in the Dulbecco’s modified Eagle’s medium (DMEM) medium (Genetix Biotech Asia Pvt. Ltd, Mumbai, India), 10% fetal bovine serum (FBS) (Genetix Biotech Asia Pvt. Ltd) and antibiotics (including penicillin 100 U/ml and streptomycin 100 µg/ml) (GIBCO, Carlsbad, CA). Cell growth was performed at 37 °C in a 5% CO2 humidified atmosphere.
Madin–Darby canine kidney cells (MDCK, NCCS) were cultured in DMEM medium, 20% FBS, 100 U/ml penicillin, 100 µg/ml streptomycin and 2 mM l-glutamine. Growth was performed at 37 °C in a 5% CO2 humidified atmosphere.
U-87 MG glioma cell line was procured from NCCS and maintained in DMEM (Genetix Biotech Asia Pvt. Ltd) supplemented with 10% FBS (Genetix Biotech Asia Pvt. Ltd) and antibiotic streptomycin (100 μg/ml). The cultures were incubated at 37 °C in 5% CO2 humidified atmosphere.
Material
PLA was obtained as a gift sample from Evonik. TMZ was a generous gift sample from Cipla Ltd. Sodium tauroglycholate, polysorbate-80 and MTT dye was purchased from Sd Fine-Chem Ltd, Mumbai, India. All the other chemicals and reagents required for performing the experiments were of the highest possible grade.
In vitro BBB passage study
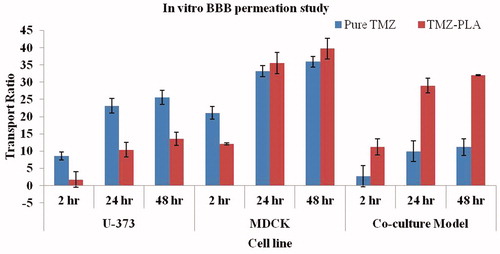
An in vitro BBB co-culture model and monolayer model was used to investigate the permeation of TMZ and developed TMZ-PLA-NP. The monolayer model employed single cell line and co-culture involves the use of two cell lines culture together to study the passage. For the co-culture model, U-373 MG cell line and MDCK cell line as glial and endothelial cells were used, respectively. Briefly, U-373 MG cells at a density of 7.5 × 10⁴ cells/well were seeded onto the apical side of inserts (Corning, NY) coated with 2% (w/v) gelatin solution and allowed to grow for 30 min. These were then inserted into 12-well culture plates containing 1 ml of DMEM medium and incubated at 37 °C for 24 h. After 24 h, onto the inner side of the insert (luminal side in case of in vivo BBB) MDCK cells were seeded at a density of 150 × 104 cells/well and incubated at 37 °C for 24 h. After 24 h, the inserts were observed under the microscope for cell growth and covering of the space by the cells. After incubation, TMZ and TMZ-PLA-NP were diluted with serum-free DMEM was then applied to the luminal chamber of inserts at concentrations of 1000 µl per well (2 mg/ml). After drug treatment, 200 µl of medium was withdrawn from basal chamber at 0, 2, 24 and 48 h. After each sampling, the medium was replenished with 200 µl of fresh serum-free DMEM. The drug permeated through the model was determined through high-performance liquid chromatography (HPLC) analysis and the transport ratio of TMZ across the in vitro BBB model was calculated with the formula (Tian et al., Citation2011): transport ratio (%)=(Wn/W) × 100, where Wn is the amount of TMZ in basal chamber at the nth h (n = 2, 24 and 48 h) and W is the amount of TMZ (400 µg) added in apical chamber.
For the monolayer model, the cells were grown in a similar fashion. However, only one cell line was used at one time and the formulations were subjected to monolayer cell line model study. This was done to check permeation of drug particles through the BBB under various test conditions. The results are shown in .
Figure 8. In vitro BBB studies for TMZ and TMZ-PLA formulations. The transport ratios for TMZ-PLA was higher than pure drug through the in vitro co-culture model constructed with U-373 MG cell line and C6 glioma cells at all the tested time-points. The developed nanoparticles transported TMZ through the in vitro BBB model four times better than the pure drug.
Cellular proliferation using MTT cytotoxicity assay
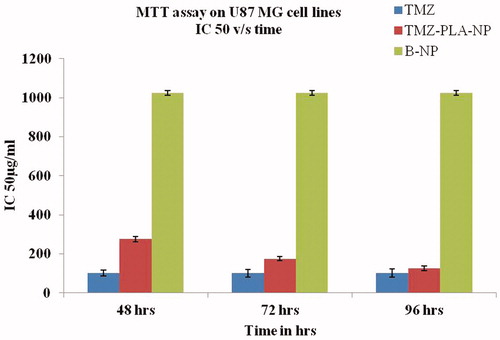
MTT assay was performed for TMZ, TMZ-PLA-NP and B-NP was carried by a procedure reported previously on U-87 cells (Goel et al., Citation2011, Citation2014) Briefly, in a 96-well cell culture plate, the cells were seeded in a density of 2500 and 1500 cells and the study was carried out at 72 and 96 h, respectively. The cells were exposed to pure drug TMZ, B-NP and TMZ-PLA-NP diluted with complete media to yield varying doses of (1500–0.01 μg/ml) for a period of 72 and 96 h, respectively. The plates were further incubated at 37 °C and 5% CO2 for given time period followed by discarding the drug and washing of the wells with PBS.
The pre-prepared MTT dye solution was added to all the wells at a concentration (1 mg/ml) and incubated overnight. The plates were centrifuged and the supernatant was finally discarded and the formed formazan crystals were solubilized in dimethyl sulfoxide. The readings were taken using ELISA (Sunnyvale, CA) plate reader at dual wavelengths of 540/690 nm, respectively. The concentration required to kill 50% of the cells by formulations under investigation was calculated, i.e. IC-50 was calculated. The graph was plotted in a logarithmic scale as percentage viability versus drug concentration as shown in .
Figure 9. MTT assay for the pure drug and TMZ-loaded PLA nanoparticles assessed on U-87 MG cell line. The developed nanoparticles exhibited time and concentration dependent cytotoxicity.
Wound scratch assay
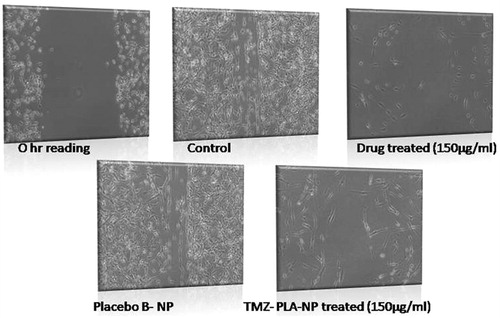
The assessment of proliferative activity of cells in the presence of compounds under investigation was done using wound scratch assay (Goel et al., Citation2011). The U-87 MG glioma cells were seeded at a density of 0.6 × 10⁶ cells into 35-mm plates overnight. Thereafter, the cells were treated with 2 μg/ml mitomycin-C for 1 h. A wound was made using a sterile tip in the center of a fully covered cell plate. Cells with a wound area were treated with subtoxic doses of TMZ (75 and 150 μg/ml), TMZ-PLA-NP and B-NP formulations (equivalent to pure drug) were added to these plates and were incubated for 24 h. The drug was carefully removed from the plates and they were fixed using 70% methanol. Measurements of wound were performed using the AxioVision Rel 4.8 imaging software (Oberkochen, Germany). Plots of percent wound closure with respect to control of 100% were drawn. The results are shown in .
Figure 10. Wound scratch assay performed on U-87 MG cells for pure drug, TMZ-loaded PLA nanoparticle formulation and placebo formulation. Anti-metastatic activity was demonstrated by the developed nanoparticles similar to the pure drug.
Cellular morphology in presence of TMZ loaded in nanoparticulate formulation
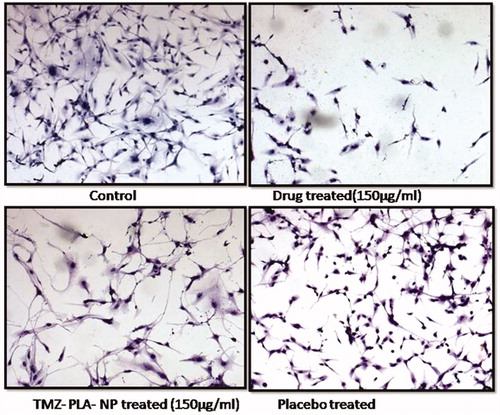
Morphological changes for cells in the presence of TMZ, TMZ-PLA-NP and B-NP was performed using hematoxylin–eosin (H&E) staining (Goel et al., Citation2011). The subconfluent U-87 MG cells were allowed to grow on coverslips and the cells grown on coverslip were treated with TMZ, TMZ-PLA-NP and B-NP (concentration equivalent to 75 μg/ml). After the treatment for 24 h, the cells on the coverslips were fixed with 70% chilled methanol as done earlier. The coverslips were washed with PBS to remove any possible debris and dead cells. The cells on the coverslip were stained using H&E. The coverslips were mounted using DPX mountant (Mumbai, India) on glass slides and were observed under Zeiss upright microscope (Oberkochen, Germany). The captured images of for each formulation are shown in .
Figure 11. Cellular morphology assay for TMZ and TMZ developed nanoparticles on U-87 MG cell line. Developed nanoparticles exhibited stress on spindle fibers and rounding up of cells similar to the pure drug.
U-87 MG glioma quantitative cellular uptake using FACS
U-87 MG glioma cells were seeded into 6-well culture plates at a density of 5 × 10⁵ cells/well and incubated at 37 °C in a 5% CO2 humidified atmosphere for 24 h. Cells were treated with FITC fluorescent probes and FITC-loaded PLA nanoparticles [PLA nanoparticles loaded with fluorescent probe, FITC (0.06 mg/ml)] were prepared. The cells were washed thoroughly with PBS, trypsinized and harvested and were acquired using flow cytometry (FACSCalibur) and the analysis was done using CellQuest software as done earlier (Jain et al., Citation2014). The results are shown in .
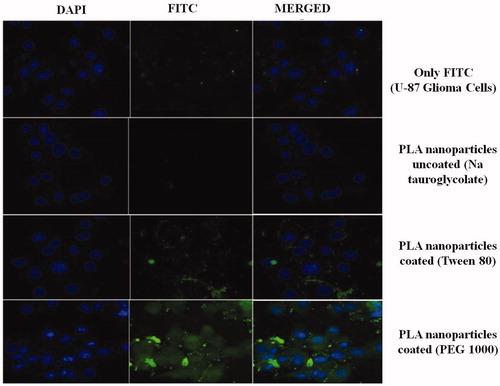
Figure 12. Nanoparticles enhance the cellular uptake by qualitative assessment using confocal microscopy on U-87 MG cells. Developed nanoparticles enhanced the cellular uptake of the particle as indicated by enhanced fluorescence.
U-87 glioma qualitative cellular uptake using confocal microscopy
The qualitative assessment of uptake of nanoparticles was performed using particles loaded with fluorescent probe. The subconfluent cultures of U-87 MG cells (5 × 10³) grown on coverslips (37 °C for 24 h) were treated with FITC and FITC-loaded nanoparticles for 2 h, respectively. Cells were washed with PBS and fixed using 1% PFA. The cells were treated with DAPI to stain the nucleus and thereafter coverslips were washed thrice using PBS. The coverslips were mounted using 2.5% (DABCO) on glass slides and sealed. The acquisition was done using Zeiss LSM 510 confocal microscope (Oberkochen, Germany) at 63× (excitation wavelength = 488 nm, emission wavelength = 560 nm). Analysis was done using LSM Image Browser software (Oberkochen, Germany) to observe the internalization of coumarin-6 by U-87 cells (Jain et al., 2013a). The results are shown in .
Figure 13. Nanoparticles enhance the cellular uptake in U-87 MG glioma cells by quantitative assessment using flow cytometry. Developed nanoparticles enhanced the cellular uptake of the particle as demonstrated by flow cytometry.
Animal studies
Pharmacokinetic study
Pharmacokinetic studies on male wistar rats (150–200 g) were performed for TMZ and TMZ-PLA-NP to obtain the plasma concentration–time profile. Animals were procured from Haffkines Institute for Training, Research and Testing, Mumbai, India and the study protocol was approved by the Institutional Animal Ethical Committee of the CU Shah College of Pharmacy (IAEC/CUS/34/2012–13), S.N.D.T. University, Mumbai, India. The animals were maintained at 25 °C and 50% relative humidity for 12 h light–dark cycle and thereafter used for the study. The animals were divided into two groups with six animals in each group (n = 6). Animals in group one received pure drug (TMZ dispersed in pH 5 acetate buffer) by intravenous route and the animals in second group received TMZ-PLA-NP by intravenous route at a dose of 3 mg/kg (Miura et al., Citation2004; Straub et al., Citation2005). At predetermined intervals, the blood was collected retro-orbitally from the animals in tubes containing 100 µl of EDTA. Plasma was separated from the collected blood samples by centrifugation at 5000 rpm for 20 min on a cold centrifuge (Remi Equipments Ltd). The plasma was carefully separated in an eppendorf and stored at −70 °C until further analysis.
Pharmacokinetic parameter calculation
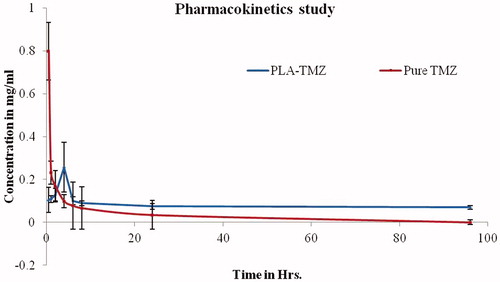
Plasma concentration versus time was plotted and pharmacokinetic parameters were determined after dose normalization. Cmax was directly determined from the concentration–time profile as shown in . Mean residence time (MRT) and elimination rate constant (Kel) for the drug were determined from the plot and area under the curve (AUC) was calculated by the trapezoidal rule.
Figure 14. Plasma profile-time concentration plots for TMZ and TMZ-PLA (pharmacokinetic study). Enhancement in half-life (t1/2) AUC was seen for TMZ upon encapsulation in time. The increase in the MRT demonstrated that long-circulating properties were imparted to TMZ and thus prolongation in half-life, better bioavailability and long-circulating properties potentiate the action of TMZ.
Biodistribution studies
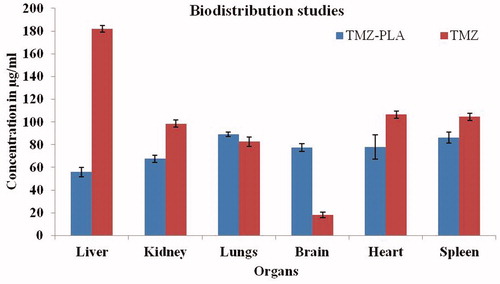
Eighteen animals were randomly divided into two groups comprising of nine animals each. One group received TMZ solution and other TMZ-PLA-NP, respectively. Animals in each group received 1 ml of drug solution (3 mg) via tail vein. Following intravenous administration, three rats were sacrificed by euthanization through femoral artery at predetermined time intervals of 24 h. Organs, namely brain, heart, lung, liver, spleen and kidney were isolated and washed thoroughly with cold saline solution and blotted with tissue paper. The organs were homogenized and thoroughly minced using a tissue homogenizer. The homogenates were centrifuged at 5000 rpm for 20 min and the supernatant was carefully separated and stored at −20 °C in eppendorfs till further analysis. The results for the biodistribution studies are shown in .
Figure 15. Biodistribution studies for TMZ and TMZ-PLA-NP. The distribution of the drug in brain tissues was four-fold greater with surface-modified nanoparticles as compared to free drug.
HPLC analysis of the sample
A novel salting-out liquid–liquid extraction (SALLE) HPLC method was employed for estimation of TMZ from samples obtained during studies with biologic material (Jain et al., 2013b). Plasma and tissue samples were treated as per the developed and validated SALLE-HPLC protocol as follows: briefly, 100 µl of plasma + 50 µl of acetic acid was mixed with 2 ml of acetonitrile thoroughly to obtain a uniform suspension. To this suspension, 500 µl of 1 M solution of sodium chloride was added. The solution was vortexed for 2 min. The vortexed plasma suspension with organic solvent was centrifuged at 2000 rpm for 15 min, supernatant layer comprising of drug was further subjected to double SALLE by the addition of 0.5 ml of 1 M solution of potassium sulfate. The suspension was vortexed and centrifuged at 4000 rpm for 20 min. The supernatant layer separated and was injected into HPLC system for quantification of drug with the following chromatographic method conditions and AUC for each sample was determined. The AUC was converted into concentrations of TMZ in each sample.
Chromatographic condition
Chromatographic system consisted of an LC-20 AD pump connected to a SPD-M20A Diode Array Detector (KYT, Japan) settled at UV wavelength of 255 nm. Separations were performed on a reversed-phase HPLC Hypersil ODS (Milford, MA) 5-µm column (25 cm× 4.6 mm ID) equipped with a Hypersil ODS 5-µm (20) guard column. HPLC mobile phase was set as acetonitrile [0.1% acetic acid (10:90 v/v)] with flow rate of 1.0 ml/min. Samples were injected into the injector with a loop capacity of 20 µl. LC Software Solution was used for chromatography data processing.
Brain penetration studies
Qualitative estimations for the penetration of developed nanoparticles into the brain were performed. Coumarin-6 (60 µg/ml) was loaded into the formulations using the procedure discussed in “Preparation of nanoparticles” section. Male wistar rats (180 ± 20 g) were divided in two groups comprising of six animals each. Animals were deprived of food for 12 h prior to study. Coumarin-6 solution prepared by solubilizing 60 µg in 1 ml was administered to animals intravenously trough tail vein. Similarily, group two animals were treated with Coumarin-6 (60 µg/ml) loaded PLA nanoparticles.
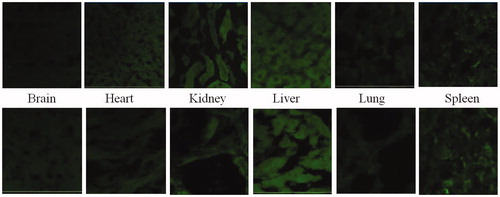
Subsequent to dosing of animals, animals were sacrificed by euthanization through femoral artery after 4 h. Major organs, namely brain, heart, liver, spleen, kidney and lungs were separated. The organs were washed in cold saline water and fixed in formalin. A small slice of each tissue was embedded in paraffin blocks. Thin slices of the tissue were obtained on a glass slide. The coverslips were mounted on glass slides using 2.5% (DABCO) and sealed. The acquisition was done using LSM 510 confocal microscope from Zeiss at 10× and the results are shown in (excitation wavelength = 488 nm, emission wavelength = 560 nm).
Figure 16. Qualitiative biodistribution studies for pristine dye and dye-loaded PLGA formulations. The fluorescence in the brain section was markedly enhanced for the animals treated with fluorophore-loaded nanoparticles as compared to only dye treated animals. Further, the fluorescence in tissues such as kidneys, liver and lungs was lesser for the animal tissues treated with nanoparticles loaded with fluorophore. Whereas, for organs of animals like spleen and lungs treated with free fluorophore and fluorophore loaded into nanoparticles, fluorescence remained more or less same.
Results and discussion
Nanoparticles were prepared using solvent evaporation method. Control on formulation and process variables enable fabrication of nanoparticles with solvent evaporation method. Particle size and PI were selected as major control parameters for entire optimization process.
Trials with EA and DCM as organic solvent
As described in , Formulation A was prepared using a combination of hydrophilic and hydrophobic stabilizer solution. An immediate separation was seen in the batch indicative of low emulsification of the organic phase with the continuous aqueous phase. Hence, in our further trial the amount of Span-80 was increased (Formulation B). There was still a separation noted in the formulation suggestive of unsuitability of the combination for preparation of nanoparticles. It was decided to try another hydrophilic stabilizer for the preparation of nanoparticles and hence Tween-80 was considered for further trials. The Formulation C obtained was in the form of large particles (microspheres). Formulation D was prepared keeping the combination of the stabilizer same but varying the amount of Span-80. With high amount of Span-80, the particle size was reduced. However, it was still in the micron range and hence could not be taken further for optimization. Hydrophobic agents with an HLB value of 12–14 were tried and incorporated into the formulation. Formulation E was prepared with 0.1 ml of HCO-10 in combination with Poloxamer-188. However, low emulsification and further separation of the particles lead us to try high amount of HCO-10 (Formulation F). The viscosity of the organic phase was high and was not easy to emulsify this highly viscous product, and hence it was decided to try another hydrophobic agent for the preparation of nanoparticles. HCO-50 was tried for further preparation of particles. HCO-10 is similar to HCO-50 in structure. However, the hydrophobicity of the HCO-50 is higher. This is due to shorter number of hydrophilic chains attached to hydrogenated castor oil. Preparation of Nanoparticulate Formulation G was attempted using the above method. Low emulsification and immediate separation of the formulation was seen. A high concentration of emulsifier was tried as seen in the formula for Formulation H. Non-homogenous particles with large size were obtained. In our further trial, non-ionic stabilizers were eliminated and anionic polymer sodium tauroglycholate was attempted. Formulation I was prepared wherein PLA hydrophobic polymer was solubilized in ethyl acetate polymer and precipitated in the presence of aqueous sodium tauroglycholate solution. The particles obtained were larger in particle size but they were homogenous and also the viscosity of the formulation was very less. In our further trial, the organic solvent was substituted with dichloromethane and Batch J was prepared. This time the particles obtained where spherical, homogenous and in nanosize range, and hence this batch was considered for further optimization process. Formulation K was the batch that was obtained after optimization of the process and formulation parameters. The optimization process has been discussed in the subsection of “Optimization of nanoparticles”. Thus, the final procedure followed for preparation of PLA nanoparticles was as follows: PLA (75 mg) was solubilized in sufficient volume of dichloromethane to obtain a clear solution. The resulting solution (organic phase) was emulsified with pre-chilled (at 4 °C) sodium tauroglycolate solution slowly on a high-speed homogenizer (IKA T-18 ULTRA-TURRAX) at a speed of 15 000 rpm. The resulting emulsion was poured immediately to chilled sodium tauroglycholate solution kept under magnetic stirring for up to 2 h for complete evaporation of organic solvent. P-NP without any drug were prepared using the above procedure. The freshly prepared nanodispersions were used for the preparation of surface-modified nanoparticles.
Optimization of process and formulation variables
Process parameters, namely stirring speed and formulation parameters such as surfactant type and its concentration, polymer and drug concentration were optimized. At the stirring speed of 9500 rpm and stirring time of 2 and 5 min, the average particle size was found to be ∼415 and 350 nm, respectively. At the stirring speed of 16 500 rpm for 2 and 5 min, the size was ∼375 and 525 nm, respectively. Similarly, PI was also affected with the stirring speed and the stirring time.
The complete results for process parameter optimization are shown in . In a colloidal carrier system, solubility characteristics of the drug and polymer generally decide the method for encapsulation of drug substance. Both, drug and polymer were soluble in dichloromethane. Emulsifying agent sodium tauroglycolate, aqueous phase and the drug in organic solvent were the major components of the system described herein. Using oil-in-water single emulsion templates, an emulsion was prepared between the aqueous phase and organic phase with TMZ. The evaporation of organic solvent from the system leads to successful formation of nanoparticles.
Optimization of stabilizer type and concentration
Among the stabilizer, PVA and Poloxamer-407 at tested concentration yielded particles in micron size and hence were not suitable in fabricating nanoparticles. However, stabilizer sodium tauroglycolate yielded particles in nanosize range and hence was the most suitable stabilizer to form nanoparticles. As the granulometric distribution of particles is affected by the stabilizer type and concentration, PI of the particles was also affected. The results for stabilizer concentration and type are shown in .
Optimization of polymer concentration
Particle size and PI were both found to be polymer concentration dependent. Any increase in the concentration of the polymer leads to increase in particle size and PI. Results are shown in . Particle size and PI was <200 nm with 3 mg/ml polymer nanodispersion. The particle size was found to be ∼200 nm and PI as 0.2 with 5 mg/ml of the polymer. It is reported that particles <200 nm can pass through the BBB by passage through the leaky vasculature of the tumors. Hence, it was decided to limit the particle size <200 nm for delivery of drugs to the CNS thus higher concentrations of the polymer were not tried.
Optimization of drug concentration
The effect of drug concentration on particle size and PI was also studied. As the drug concentration is increased, particle size and PI increases, thus the particle size and PI are dependent on drug concentration as well. The size was ∼240–250 nm with both 10 and 20 mg of drug concentration. However, further increase in the drug concentration leads to drastic increase in the particle size of the nanoparticles. Results are shown in .
Freeze drying of nanoparticles
Various lyophilizers were screened for maintenance of particle size post-lyophilization. The reconstitution of the material was performed in 0.9% saline and 5% dextrose since the particles are intended for intravenous administration. (To maintain the osmotic balance, two reconstituting mediums were tried out). As indicated in , the particle size and PI for the samples before lyophilization were 234 and 0.455 nm, respectively. Cryoprotectants mannitol, sorbitol, lactose and trehalose were tried for bearing the cryo-process stress. Trehalose, sorbitol, mannitol and lactose were tried in 2, 5, 7.5 and 10% w/w concentration, respectively. (These are the prescribed limits of cryoprotectants by FDA for intravenous administration). It was observed that trehalose is the most suitable cryoprotectant for maintaining the particle size and PI of the particles both pre- and post-lyophilization. With all other cryoprotectants, the particle size increased (p > 0.05) after lyophilization and upon reconstitution in saline and dextrose.
Preparation of bare and surface-modified nanoparticles
Nanoparticles were prepared by solvent evaporation technique as described by Xu et al. (Citation2005) and Jain et al. (2013b) with drug solubilized in sufficient volume of dichloromethane to obtain low viscosity clear solution. The resulting solution was incubated with hydrophilic stabilizers (organic phase) and the increment in particle size was determined using Malvern Zetasizer 90S (Jain et al., 2013b).
As indicated in , the particle size for bare PLA particles was 156.1 nm and that for surface-coated nanoparticles was increased and found to be in the range of 180–272 nm. The increase in the particle size indicates that the particles were coated with the stabilizer under investigation. The increase in the particle size was found to be in the following order: PEG-1000, Polysorbate-80< PEG-400< PEG-6000< propylene glycol. PEG-1000 and Polysorbate-80 were the stabilizer that exhibited the least increase in particle size. Size distribution pattern of particles plays important role in determining the drug release behavior, feasibility for intravenous administration as well as their fate after in vivo administration (Potineni et al., Citation2003). Further, particles with small size (<200 nm) can easily extravasate through the blood vessel and tend to accumulate in the tumor sites. PI is a measure of distribution of particles with indication of homogeneity of the particles. PI for the developed particles was found to be ∼0.1–0.4. The results are shown in .
Zeta potential and diffusion coefficient measurements
The zeta potential values were found to be in the range of −7.5 ± 1.1 to −14.0 ± 2.1 for bare and PEG-1000 coated TMZ-loaded nanoparticles as shown in . The physical stability of the particles and the charge possessed by the particles is determined by zeta potential.
It is well accepted that the nanoparticle with a negative charge are a good substrate for liver uptake. Negatively charged particles by electrostatic interactions combine with positively charged serum and plasma proteins.
Plasma proteins attract the opsonins with further attachment of opsonins on the surface. Opsonins attached particles are recognized by liver cells and are phagocytosized (Shegokar et al., Citation2011). To confirm the uptake phenomena, uptake of nanoparticles by K9 cell liver (in vitro) was investigated.
K9 cell uptake studies performed using FACS
The uptake of the nanoparticles by the liver cells upon administration was studied by employing K9 liver cells. Bare nanoparticles due to hydrophobic polymer covering were readily taken and hence showed the highest uptake. The least uptake was demonstrated by particles coated with Tween-80 followed by the particles coated with PEG-1000. The uptake of particles coated with other hydrophilic agents was higher than polysorbate-80 and PEG-1000 coated nanoparticles and lesser than bare nanoparticles. The coating of nanoparticles with the hydrophilic agent changed the zeta potential of the nanoparticles. This indicates that the surface properties of the particles changed. The results for the uptake study indicate that the particles are readily taken up by the liver cells. These phenomena of uptake by the liver cells can be attributed to the negative surface charge and hydrophobic polymer. There are reports indicating that hydrophilic coating on hydrophobic particulate system diminishes the uptake by liver cells. Polysorbate-80, PEGs, propylene glycol, poloxamines and poloxamers are some materials that are used as hydrophilic agent for covering or masking the hydrophobic nanoparticles. Through incubation, a coating of these stabilizers was adsorbed on the surface of TMZ-PLA-NP. The uptake of nanoparticles was considerably reduced after coating with the stabilizer. The decrease in the uptake of particles by liver cell was found to be of the order:
Polysorbate-80< PEG-1000< Poloxamer-188< propylene glycol< PEG-400< bare PLA nanoparticles
Thus, PEG-1000 was selected as a hydrophilic stabilizer for coating the nanoparticles. And thus, the work was undertaken with an objective of preparation of surface-modified nanoparticles of TMZ for prolonged circulation in the body with potential for treatment of brain tumors.
For surface modification of TMZ-PLA-NP, various hydrophilic stabilizers like polyethylene glycols, propylene glycols, poloxamers and polysorbates with HLB values of 15–30 were used. The increase in the particle size and change in the zeta potential was the major response that was assessed to judge the modification of the surface by the stabilizer under investigation. The chain lengths for the surface modifiers are indicated in . If the conformation of the surface modifier on the particle surface is in the form of straight chains then the particle size should be cumulative of bare nanoparticle size and chain length. However, the particles had a size lesser than the predicted size indicating that the alignment of surface modifier was not in the form of straight chains. Hence, branched structures, loops or adsorbed structures must be formed on the surface.
The developed system after coating with PEG-1000 demonstrated an increase in zeta potential. The charged particles are electrostatically repelled form each other and hence are stable. Hence, such particles were more stable compared to the bare particles. Further, from the liver uptake readings obtained for nanoparticles by K9 cells indicate that the particles when uncoated are readily taken up by the liver cells. The diminished uptake of stealth nanoparticles can be attributed to the coating that forms a hydrophilic cloud on the surface of nanoparticles. This hydrophilic cloud alters the zeta potential of nanoparticles, which prevent interactions with biologic components, reduce complement activation, and interaction with cells preventing uptake of nanoparticles by MPS (Wang et al., Citation2007). According to our observation, particles coated with polysorbate-80 were least taken up by the K9 cells. However, the morphology of the cells was affected when treated with polysorbate-80 coated particles. The cells appeared weak with a partial distortion of the cell membrane at the tested concentration of 1%. Polysorbate-80 is reported to act as solubilizer and hence the weakening of the membrane can be attributed to solubilization of the lipidic membrane of the cells. With PEG-1000, there was no alteration in the cell morphology and the cells appeared to be healthy during the entire procedure. Hence, it was decided to coat the nanoparticles with PEG-1000 for our studies. PEG-1000 surface-modified nanoparticles were characterized for various parameters.
Transmission electron microscopy
Formation of smooth, homogenous and spherical particles was confirmed with TEM analysis as seen in . The particle size (∼200 nm) obtained by the TEM analysis corroborates the findings of dynamic light scattering readings. Further the particles were discrete indicating the stability (no aggregation) of developed nanoparticles. The particles have moderate uniformity and all the particles were discrete suggesting that the particles do not aggregate upon reconstitution. TEM analysis confirmed the formation of discrete, smooth surface and homogenous particles with a size of 200 nm. Bare as well as coated nanoparticles depicted the same morphology.
DSC studies
The physical status of the native drug in the prepared nanoparticles was determined by DSC analysis. Thermal analysis methods have been used for determining the transition in the system upon heating and change in enthalpy (Mu & Feng, Citation2003; Dong & Feng, Citation2007). Further, the interaction between the drugs and the excipients were predicted by DSC studies. DSC thermogram of the TMZ, PLA, placebo NP, TMZ-PLA bare nanoparticles and TMZ-PLA-NP is provided in .
The drug exhibited a sharp exothermic peak at 212 °C indicating that the drug was crystalline in nature (melting point after 200 °C is suggestive of structural rigidity of the compound). PLA polymer showed a small endothermic peak at 152 °C, suggestive of d and l form of the polymer and purity of the compound due to single peak. Placebo formulation maintained the peak for the polymer. Further, there were numerous small peaks representing the excipients present in the placebo formulation. For the drug-loaded nanoparticles, the sharp endothermic peak for the polymer had shifted to the lower temperature due to conversion of polymer into amorphous form. The drug peak was not completely obtained in the thermogram. This was either due to complete dispersion of the drug at the molecular level or due to non-detectable quantities of compound present in the formulation. From the DSC thermogram, it was confirmed that the developed nanoparticles exhibited no interaction between the drug and the excipient.
P-XRD studies
TMZ shows characteristic sharp and intense peaks at 2θ values of 11°, 14.5° and 26.25° indicative of highly crystalline nature of drug. The polymer is also crystalline as it exhibits a sharp peak at 16.3°, 18.8° and 19.5°. The hollow pattern for blank nanoparticles indicates that the crystalline structure is modified to partial amorphous or semi crystalline form due to process parameters. XRD patterns for drug-loaded formulation are similar to that obtained for blank nanoparticles indicating probability of most of the drug getting entrapped in the polymeric matrix of the nanoparticle.
Encapsulation efficiency
The entrapment efficiency of surface-modified nanoparticles was determined using centrifugation method. The centrifugation of 15 000 rpm was found to be sufficient for PLA nanoparticles, since PLA is a high molecular weight polymer and settles easily upon application of gravitational force. At this revolution per minute, the drug in the solubilized state (unentrapped drug) does not settle and hence remains in the supernatant. Thus, separation and further analysis of supernatant for drug will predict the amount of the drug present in the unentrapped form in the developed polymeric system. The same principle was applied for our nanoparticles and it was found that ∼60% of the drug is in the entrapped form and remaining 40% remains unentrapped.
Different ratios of polymer to drug were tried to attain encapsulation of drug in optimum amount. Polymer to drug ratio of 13:1, 7.5:1 and 3.57:1 exhibited 60.55 ± 3.6, 59.8 ± 4.6 and 50.8 ± 5.8% EE, respectively. On further increase in the drug concentration, there was significant decrease in EE. For the purpose of our study, the drug weight was kept constant (5 mg). Higher amount of polymer resulted in a more viscous dispersed phase, making emulsification difficult with formation of larger particles that eventually precipitated in continuous phase. The high amount of drug in other ratios demonstrated drug loss during fabrication process and thus exhibited a decrease in drug encapsulation. The optimized ratio of polymer to drug (13:1) with highest EE was used for all further studies. These formulations were subjected to in vitro dissolution studies.
In vitro dissolution studies
TMZ when subjected to dissolution studies, through dialysis bags (cutoff 6000–10 000 Da) was out in the dissolution media in 2 h since the molecular weight for TMZ is less than the dialysis bag cutoff. However, from the in vitro drug release studies it is evident that 83.3 ± 2.4% of drug release within 120 h from TMZ-PLA-NP (molecular weight 75 000–90 000 Da thus allowing only drug to pass through). The release of TMZ from nanoparticles may depend on drug diffusion through PLGA and also on PLGA surface/bulk erosion or swelling. A biphasic release pattern of TMZ was exhibited from the developed nanoparticles characterized by an initial rapid release of 30% drug during the first 2 h, followed by a slower and continuous release at extremely slow rates for a period of 7 days as shown in (Mainardes & Evangelista, Citation2005; Huang et al., Citation2007). The observed in vitro drug release profile can be attributed to the immediate dissolution of surface adhered TMZ. The sustained release of the drug can be attributed to the slow diffusion of the drug entrapped in the polymer. A similar pattern of drug release was obtained for rolipram drug when loaded into biodegradable polymeric nanoparticles by Lamprecht et al. (Citation2001).
In vitro BBB passage study
Transport ratios of pure TMZ and TMZ-PLA-NP through the in vitro BBB were determined and the results are shown in . The transport ratios for TMZ-PLA-NP were higher than pure drug through the in vitro co-culture model at all the tested time-points. The developed nanoparticles transported TMZ through the in vitro BBB model four times better than the pure drug. The monolayer culture models were also included in the study to understand the role of tight junctions of BBB in permeation of materials. In case of monolayer models constructed of U-373 MG cells and MDCK cells individually, the permeation was more or less same for TMZ encapsulated and untrapped form.
Passage of the trapped and free form of TMZ through the in vitro BBB model was studied after applying the developed formulations to the luminal side of the constructed model. From the results, it was confirmed that polymeric nanoparticles enhanced the permeation of TMZ through the BBB. For the monolayer model, the permeation for free and trapped drug was more or less similar. This can be attributed to the formation of improper junctions between the cells. With monolayer model, the tightness among the junctions of the cells is not achieved. Due to improper junctions, the model allows passage of free and the trapped drug at the same rate. However, the co-culture model is much more robust and mimics the in vivo BBB to a greater extent. From the in vitro BBB model, it is seen that TMZ is better permeated when encapsulated than the free form. Thus, it can be confirmed that nanoparticles allows the passage of compounds through the BBB.
Cellular proliferation using MTT cytotoxicity assay
The cytotoxic activity of the developed formulations was assessed by incubating cells with concentrations ranging from 0.01 to 150 µg/ml of both pure drug and TMZ-loaded NP was assessed. For the purpose of our study, cell viability was studied on U-87 MG glioma cells by the MTT assay. The results of cell viability are shown in , after 24 h of incubation time, the IC-50 for the pure compound was found to be 100 µg/ml. In fact, the IC-50 for the pure compound remains constant as the cell viability was totally affected. However, with the developed formulations the IC-50 was found to 275, 175 and 125 µg/ml at 48, 72 and 96 h, respectively. Thus, cytotoxicity was found to be concentration and time dependent for the fabricated TMZ-PLA-NP. However, no cytotoxic effect was observed for placebo formulations suggesting the safety of the biodegradable polymer under study (Mo & Lim Citation2005). The promising results obtained from the preparation and characterization of nanoparticles prompted us to undertake cell line studies and test the cytotoxic, anti-proliferative and anti-metastatic activity of the compound. Our findings are in correspondence with our earlier findings where the study has been performed on C6 glioma cells. Cell growth was constantly inhibited for TMZ nanoparticles upto 96 h of incubation when compared to pure drug indicating slow release of TMZ. Thus, for nanoparticles the cytotoxicty was found to be concentration and time dependent.
Wound scratch assay
The wound healing test was performed for TMZ, TMZ-PLA-NP and B-NP. Percentage of wound healing after treatment of the cells with desired formulations was noted. The results are depicted in . It was seen that when the cells are treated with pure drug, 16.27 ± 5.20% of wound healing is seen. Similarly, for the wound treated with drug formulations, healing was found to be 19.31 ± 2.10%. Thus, there was no significant difference between the wound healing activity of the pure drug and TMZ-PLA-NP. The wound treated with B-NP and untreated cells were devoid of any space and thus can be referred to as complete wound healing (100%). Thus, it can be regarded that the excipients used for fabrication of nanoparticles have no effect on cell growth. Wound healing activity was performed to get insights about the anti-metastatic activity of the compound. It has been earlier reported that at low doses TMZ is effective in EGFR inhibition thus modulating the Rho GTPase signaling, a prerequisite for cellular migration (Chen et al., Citation2009). A similar mechanism can be suggested for our developed drug delivery systems loaded with TMZ. Thus, nanoparticles impede the cellular motility of the cells.
Cellular morphology using H&E staining
Morphology of the cells post-treatment with drug and TMZ-PLA-NP was investigated using H&E assay and is shown in . The pure drug and TMZ-PLA-NP treated cells (at a dose of 150 µg/ml) demonstrated loss of spindle shape and distortion of the interconnections between the cells ends. Further, there was lowering of volume of cells and rounding up of cells seen. This indicates that the cells treated with drug severely affect the morphology of the cells. The extent to which the cells are affected by TMZ-PLA-NP is less since the complete drug is not released/diffused for action from the nanoparticles. The morphology of the cancerous cells is affected upon treatment with pure drug and TMZ-PLA-NP. There is a rounding up of cells with reduction in number and volume of the cells. The promising results obtained on the cell line promoted us to undertake qualitative as well as quantitative estimation of the drug using FACS and confocal microscopy.
U-87 glioma qualitative cellular uptake using confocal microscopy
FITC and FITC-loaded nanoparticles were subjected to qualitative uptake assessment. The results for the uptake study are shown in as seen in the superimposed images of the cell and nucleus, FITC and FITC-loaded TMZ-PLA-NP uncoated nanoparticles and polysorbate-80 coated TMZ-PLA-NP are not taken up the U-87 MG glioma cell line. However, when the cells are treated with PEG-1000-coated TMZ-PLA-NP, they are readily taken up by the glioma cells. Indeed, the particles traverse through the cytoplasm and the localization of the particles into the nucleus. This indicates that the developed particles target the cancerous cells and unload their content in the nucleus. From the qualitative microscopy study, it was seen that PEG-1000 coated nanoparticles are readily uptake in comparison to bare and Tween-80-coated nanoparticles. The findings of the qualitative uptake study are of clinical significance since the drug is localized into the nucleus of the cells (this is of significance as the main site of drug action is the nucleus). The testing of the uptake under in vitro condition suggests that nanoparticles target the cells. These results when extended to in vivo condition suggest that when treated with nanoparticles low drug dose shall be required to produce the same response as pure drug, since the drug will have better action against the target site. Further the action shall be prolonged, since the action shall be obtained after the diffusion of the drug from the nanoparticles.
U-87 glioma quantitative cellular uptake using FACS
Quantitative uptake of FITC in free form, bare TMZ-PLA-NP, PEG-1000-coated TMZ-PLA-NP and Tween-80-coated TMZ-PLA-NP cells was studied using FACS and the results are shown in . The shift of the peaks to the left close to the cell peak indicates lesser uptake of the substance/particles under investigation. TMZ-PLA-NP without any coating were barely recognized by the cells and hence taken up and therefore a very low intensity was recorded for such cells. Particles coated with polysorbate-80 and PEG-1000 were recognized. However, among the two PEG-1000 coated cells were best recognized and taken up. For uptake study, a flurophore FITC was included in the formulation, since only the cells demonstrating any fluorescence are counted by FACS (Jain et al., 2013a). To avoid any dilemmas and disregards with polysorbate-80-coated nanoparticles (the particle size and PI are in the desired range), they were included in the study. At the tested concentration, uptake of polysorbate-80 nanoparticles is less than PEG-1000 coated nanoparticles by the U-87 MG cells. The number of cells that were harvested for acquisition with polysorbate-80 were less compared to the control cells and hence the uptake seen was comparatively less. This again is due to the solubilization/lipidization of the cell membrane after treatment with polysorbate-80.
In vivo studies performed for TMZ and TMZ-PLA nanoparticles
A complete set of in vivo studies was performed for the developed TMZ-loaded PLA nanoparticles. The obtained results for TMZ loaded into PLA nanoparticles are shown in this section.
Pharmacokinetic study and pharmacokinetic parameter calculation
Pharmacokinetic analysis was performed to check the effect of optimized formulation over pure drug. The calculated pharmacokinetic parameters for the two formulations have been summarized in . The values of area under the concentration-versus-time curve (AUC0−∞), MRT and t1/2 of TMZ-PLA-NP were found to be much higher (3–4 times) than for TMZ pure drug. The plasma concentration–time profile of pure drug and TMZ-PLA-NP are depicted in . In vivo pharmacokinetic profile of the drug can be correlated with in vitro release data. The drug concentration from the nanoparticles into plasma was detectable up to 120 h. The results demonstrated prolonged plasma levels, reduced clearance, raised volume of distribution and increased MRT of TMZ upon administration of nanoparticles. Enhancement in half-life (t1/2) and AUC was seen for TMZ upon encapsulation in time. The pharmacokinetic parameters were significantly different for the drug when formulated into nanoparticles (p < 0.05) tested at 95% confidence interval.
Table 4. Pharmacokinetic parameter calculation studies for TMZ and TMZ-PLA.
The increase in the MRT demonstrated that long-circulating properties were imparted to TMZ. Thus, prolongation in half-life, better bioavailability and long-circulating properties potentiate the action of TMZ.
Biodistribution studies
Biodistribution study was performed to assess the passage of the drug through the BBB and its distribution in various parts of the body. Biodistribution pattern of the drug in vital organs viz. heart, brain, liver, lung, spleen and kidney was studied for the pure drug and drug trapped in nanoparticles as shown in . The distribution of the drug in brain tissues was four-fold greater with surface-modified nanoparticles as compared to free drug. The results can be correlated with in vitro BBB model study, where the enhancement in the permeation of the drug was three-fold. These indicate that nanoparticle enhances the permeation of drug through the tight junctions of the BBB.
Further, the distribution in highly perfused organs was significantly less and this can be attributed to surface modification of nanoparticles. Surface modification avoids rapid clearance of the particles that generally occur due to opsonization process. The amount of drug seen in lung tissue was more or less same for the free drug and trapped drug. Whereas, for all the other organs the amount of drug present in the tissues was much lower when administered through nanoparticles.
Hence, the distribution of the drug when in trapped form is markedly reduced into the organs lungs, liver, spleen, kidney and heart. The results were further confirmed by performing qualitative distribution study of the nanoparticles.
Brain penetration studies
Qualitative biodistribution studies were performed for PLA nanoparticles and the results are shown in . For the study, a dye coumarin-6 was loaded into the nanoparticles and the tissues of animals treated with such dye-loaded nanoparticles were viewed under confocal microscope for fluorescence intensity. (Coumarin-6 was used as fluorescent probe since the dye is soluble in organic solvent dichloromethane promoting easy incorporation of dye into the nanoparticles during the fabrication step.) For the purpose of comparison and avoidance of any biasness, a group of animals was treated with free dye solution. Confocal microscopy was performed for tissues of animals belonging to this group. The permeation of fluorophore in different tissues was assessed through the emitted fluorescence. The fluorescence in the brain section was markedly enhanced for the animals treated with fluorophore-loaded nanoparticles as compared to only dye-treated animals. Further, the fluorescence in tissues such as kidneys, liver and lungs was lesser for the animal tissues treated with nanoparticles loaded with fluorophore. Whereas, for organs of animals like spleen and lungs treated with free fluorophore and fluorophore loaded into nanoparticles, fluorescence remained more or less same.
Permeation of the dye (unable to cross the BBB and reach brain in significant amount due to its high molecular weight) is enhanced significantly when encapsulated into nanoparticles. The distribution of the dye in other highly perfused organs is significantly reduced. Thus, it can be inferred that nanoparticles enhance the permeation of the drug into the brain, hence can be used for potential treatment of gliomas. These results are in compliance with the quantitative biodistribution studies performed for the developed PLA nanoparticles and the predrug. Nanoparticles, due to diminished distribution to other organs potentially reduce the toxicity of the compounds.
Conclusion
The objective of the study was accomplished by designing surface-coated PLA nanoparticles of TMZ. Among the various surface modifiers used for our purpose, PEG-1000 and Tween-80 were promising. The performance of PEG-1000 coated nanoparticles was found to be better than the Polysorbate-80 coated, since polysorbate-80 (at the tested concentration of 1% v/v) severely affected the healthy cells. The optimized formulations were characterized for various parameters. Characterization of the particles suggested that ∼60% of the drug was entrapped into the nanoparticles and this drug was released in ∼96 h from the formulation. Further, the developed formulation exhibited no drug–excipient interaction with drug being dispersed at the molecular level in the designed polymer. The developed particles exhibited time and concentration dependent cytotoxicity. Developed nanoparticles demonstrated anti-proliferative and anti-metastatic activity similar to the pure drug. Nanoparticles were better taken up by the glial in comparison to pure drug. Nanoparticles augmented the BBB passage of the drug as demonstrated via in vitro BBB monolayer and co-culture model. The performed in vivo studies demonstrated the enhancement in half-life of TMZ with higher deposition in the brain. Thus, the developed nanoparticles can be used for potential treatment of brain tumors.
Declaration of interest
The authors report no conflicts of interest. The authors alone are responsible for the content and writing of this article.
Acknowledgements
We would like to thank the imaging facilities at ACTREC for their help and support. Darshana S. Jain is supported financially by DST- INSPIRE fellowship. The project was financially supported by Cipla Pvt. Ltd. Peeyush N. Goel is a recipient of CSIR-SRF fellowship.
References
- Azmin MN, Florence AT, Handjani-Vila RM, et al. (1985). The effect of non-ionic surfactant vesicle (niosome) entrapment on the absorption and distribution of methotrexate in mice. J Pharm Pharmacol 37:237–42
- Brannon-Peppas L, Blanchette JO. (2004). Nanoparticle and targeted systems for cancer therapy. Adv Drug Deliv Rev 56:1649–59
- Brigger I, Dubernet C, Couvreur P. (2002). Nanoparticles in cancer therapy and diagnosis. Adv Drug Deliv Rev 54:631–51
- Chen M, Rose AE, Doudican N, et al. (2009). Celastrol synergistically enhances temozolomide cytotoxicity in melanoma cells. Mol Cancer Res 7:1946–53
- Dong Y, Feng S-S. (2007). PLGA nanoparticles prepared by high pressure homogenization for paclitaxel chemotherapy. Int J Pharm 342:208–14
- Feng SS. (2004). Nanoparticles of biodegradable polymers for new-concept chemotherapy. Expert Rev Med Devices 1:115–25
- Gabathuler R. (2010). Approaches to transport therapeutic drugs across the blood brain barrier to treat brain diseases. Neurobiol Dis 37:48–57
- Goel PN, Gude RP. (2011). Unravelling the antimetastatic potential of pentoxifylline, a methylxanthine derivative in human MDA-MB-231 breast cancer cells. Mol Cell Biochem 358:141–51
- Goel PN, Gude RP. (2014). Delineating the anti-metastatic potential of pentoxifylline in combination with liposomal doxorubicin against breast cancer cells. Biomed Pharmacother 68:191–200
- Groothuis DR. (2000). The blood-brain and blood-tumor barriers: a review of strategies for increasing drug delivery. Neuro-Oncology 2:45–59
- Huang RQ, Qu YH, Ke WL, et al. (2007). Efficient gene delivery targeted to the brain using a transferrin-conjugated polyethyleneglycol-modified polyamidoamine dendrimer. FASEB J 21:1117–25
- Jain D, Athawale R, Bajaj A, et al. (2013a). Studies on stabilization mechanism and stealth effect of poloxamer 188 onto PLGA nanoparticles. Colloids Surf B Biointerfaces 109:59–67
- Jain D, Athawale R, Bajaj A, et al. (2013b). Poly lactic acid (PLA) nanoparticles sustain the cytotoxic action of temozolomide in C6 glioma cells. Biomed Aging path 3:201–8
- Jain D, Athawale R, Bajaj A, et al. (2014). Unraveling the cytotoxic potential of temozolomide loaded into PLGA nanoparticles. DARU J Pharm Sci 22:1–9
- Kreuter J, Ramge P, Petrov V, et al. (2003). Direct evidence that polysorbate-80-coated poly(butylcyanoacrylate) nanoparticles deliver drugs to the CNS via specific mechanisms requiring prior binding of drug to the nanoparticles. Pharm Res 20:409–16
- Kumari A, Yadav SK, Yadav SC. (2010). Biodegradable polymeric nanoparticles based drug delivery systems. Colloids Surf B Biointerfaces 75:1–18
- Lamprecht A, Ubrich N, Yamamoto H, et al. (2001). Biodegradable nanoparticles for targeted drug delivery in treatment of inflammatory bowel disease. J Pharmacol Exp Ther 299:775–81
- Mainardes RM, Evangelista RC. (2005). Praziquantel-loaded PLGA nanoparticles: preparation and characterization. J Microencapsul 22:13–24
- Miura H, Onishi H, Sasatsu M, Machida Y. (2004). Antitumor characteristics of methoxypolyethylene glycol-poly(DL-lactic acid) nanoparticles containing camptothecin. J Control Release 97:101–13
- Mo Y, Lim LY. (2005). Preparation and in vitro anticancer activity of wheat germ agglutinin (WGA)-conjugated PLGA nanoparticles loaded with paclitaxel and isopropyl myristate. J Control Release 107:30–42
- Moghimi SM, Hunter AC, Murray JC. (2005). Nanomedicine: current status and future prospects. FASEB J 19:311–30
- Mu L, Feng SS. (2003). A novel controlled release formulation for the anticancer drug paclitaxel (Taxol): PLGA nanoparticles containing vitamin E TPGS. J Control Release 86:33–48
- Nerkar N, Bajaj A, Shrikhande S, Jain D. (2012). Fabrication of lipospheres for paclitaxel and assessment of in vitro cytotoxicity against U373 cancer cell lines. Thai J Pharm Sci 36:117–30
- Pardridge WM. (2005). The blood-brain barrier: bottleneck in brain drug development. NeuroRX 2:3–14
- Potineni A, Lynn DM, Langer R, Amiji MM. (2003). Poly(ethylene oxide)-modified poly(beta-amino ester) nanoparticles as a pH-sensitive biodegradable system for paclitaxel delivery. J Control Release 86:223–34
- Shegokar R, Jansch M, Singh KK, Muller RH. (2011). In vitro protein adsorption studies on nevirapine nanosuspensions for HIV/AIDS chemotherapy. Nanomedicine 7:333–40
- Straub JA, Chickering DE, Lovely JC, et al. (2005). Intravenous hydrophobic drug delivery: a porous particle formulation of paclitaxel (AI-850). Pharm Res 22:347–55
- Tian XH, Lin XN, Wei F, et al. (2011). Enhanced brain targeting of temozolomide in polysorbate-80 coated polybutylcyanoacrylate nanoparticles. Int J Nanomedicine 6:445–52
- Wang Z, Liu W, Xu H, Yang X. (2007). Preparation and in vitro studies of stealth PEGylated PLGA nanoparticles as carriers for arsenic trioxide. Chinese J Chem Eng 15:795–801
- Xu Z, Gu W, Huang J, et al. (2005). In vitro and in vivo evaluation of actively targetable nanoparticles for paclitaxel delivery. Int J Pharm 288:361–8