
 ?Mathematical formulae have been encoded as MathML and are displayed in this HTML version using MathJax in order to improve their display. Uncheck the box to turn MathJax off. This feature requires Javascript. Click on a formula to zoom.
Abstract
Objective: Buccoadhesive wafer dosage form containing Loratadine is formulated utilizing Formulation by Design (FbD) approach incorporating sodium alginate and lactose monohydrate as independent variable employing solvent casting method.
Methods: The wafers were statistically optimized using Response Surface Methodology (RSM) and Artificial Neural Network algorithm (ANN) for predicting physicochemical and physico-mechanical properties of the wafers as responses. Morphologically wafers were tested using SEM. Quick disintegration of the samples was examined employing Optical Contact Angle (OCA).
Results: The comparison of the predictability of RSM and ANN showed a high prognostic capacity of RSM model over ANN model in forecasting mechanical and physicochemical properties of the wafers. The in vivo assessment of the optimized buccoadhesive wafer exhibits marked increase in bioavailability justifying the administration of Loratadine through buccal route, bypassing hepatic first pass metabolism.
Introduction
Achieving optimal drug therapy necessitates patients to receive correct medication, at the right dosage, and at the most convenient dosing interval (Danckwerts, Citation2003). The need of the hour lies on developing newer dosage form to improve the efficacy of time-tested drugs that already exist in the market. It implicates low cost both in terms of money and time improving the usefulness of drugs that have already been approved rather than to develop a new chemical molecule.
To overcome the complication in the development of pharmaceutical formulations with tedious hit and trial methods, use of appropriate experimental designs and computer-based statistical optimization techniques like Response Surface Methodology (RSM), are widely been used today (Bouckaert et al., Citation1996; Hoang Thi et al., Citation2013). These techniques needs minimum experimentation and time, as a result, establishes far more cost-effective process for formulating dosage form. The aim of RSM lies in discovering the most favorable operating conditions for a certain system or the way in which a particular response is tailored by a set of variables over some specific regions of concern where as An Artificial Neural Network (ANN) is a computational model for storing and regain achieved knowledge. ANNs consist of dense interrelated computing units which are simple models for complex neurons in biological systems. The knowledge is attained during a learning process and is stored in the synaptic weights of the inter-nodal connections. The advantage of neural networks lied in their capability to represent complex input/output relationships. They are well appropriate for use in data classification, function approximation, and signal processing, among others (Ihme et al., Citation2006).
Oral route is the most preferred route of drug delivery and buccal pouch is one of the popular site of administration in this oral cavity. Oral wafers/Oral Disintegrating Films (ODFs) are stamp size strips of thin polymeric films meant to target this buccal cavity as site of drug delivery and are relatively new dosage forms. They are intended to disintegrate or dissolve almost instantaneously when placed onto the buccal cavity (Hariharan & Bogue, Citation2009).
ODFs are intended to dissolve rapidly in the saliva eliminating the need of swallowing the whole dosage form, which makes them a right choice for pediatric and geriatric groups, bedridden patients or those who are suffering from dysphagia, Parkinson’s disease, mucositis or have a vomiting tendency (Barnhart, Citation2008).
Their specific advantages are fast wetting action, which helps them to adhere to the mucosa and/or dissolve rapidly, avoiding the spitting reflex. The fear of choking or inhalation makes patient incompliance to Orally Disintegrating Tablets (ODTs). ODF/wafer technology completely eliminates these problems (Hariharan & Bogue, Citation2009). As they are thin and can be taken without water, wafers are also ideal for travelers or patients who do not have continuous access to water. Hariharan & Bogue (Hariharan & Bogue, Citation2009) indicated that the manufacturing of ODFs stands on the technology for producing transdermal patches, which is less expensive than lyophilization, a common process for manufacturing ODTs. Accurate dosing is achieved in case of ODFs which makes them superior to liquid formulations such as drops or syrups (Barnhart, Citation2008). As drug releasing from wafers requires a few seconds into the oral cavity. A rapid onset of action could be achieved, if the drug is absorbed through the oral mucosa, avoiding first-pass metabolism for some drugs, improving their bioavailability. Buccal absorption may be particularly beneficial, for example, for patients suffering from migraine, running nose and allergic rhinitis (Patel et al., Citation2010).
The first approaches to the concept of oral films are found in patent literature of the 1960s (Deadman, Citation1964).
Loratadine (LOR), a tricyclic, piperidine derivative of antihistamines, is a non-sedative second generation H1 receptor blocker comes under class II of the Biopharmaceutical Classification System (BCS). It is an ionizable drug, whose solubility depends on pH and the bioavailability, therefore is highly variable (Szabados-Nacsa et al., Citation2011). Various civil and military authorities approved the use of LOR by aircrew for mild or moderate allergic symptoms or other situations which necessitates an antihistaminic (e.g. urticaria) owing to its proven non sedative effect. Literature also suggested in vivo anti-inflammatory effect of Loratadine (Chakraborty et al., Citation2013b).
The pH-dependant solubility and varying bioavaialbility of Loratadine was the main challenge behind fabricatinga buccoadhesive wafer dosage form through Formulation by Design (FbD) approach, which can eliminate the biopharmaceutical problem of Loratidine through its’ inherent advantages discussed earlier. The objective of this present study was to compare the predictability of computer-based statistical optimization techniques, i.e. RSM and ANN algorithm, in the context of physico-chemical and physico-mechanical properties of the dosage form. This work also investigated the in vivo performance of the optimized wafer dosage formulation of Loratadine to ascertain uniform and enhanced bioavailability of the drug.
With reference to our previous work (Chakraborty et al., Citation2013a), a 32 factorial design was employed in formulation of the buccoadhesive pharmaceutical wafers, to probe the effect of sodium alginate (sodium salt of alginic acid) as a bioadhesive polymer imparting bioadhesion with the oral mucosa and lactose monohydrate as an ingredient (filler) of hydrophilic matrix base for formulating the wafers generating a pleasant mouth fill, thus improving patient compliance. The data obtained were then processed using RSM and ANN algorithm and the statistical results were compared with experimental data.
Experimental
Materials
Loratadine (LOR) was purchased from Yarrow Chemical Products, Mumbai, India. Hydroxy propyl Cellulose (HPC) (Klucel, E463) and Saccharine Sodium were also supplied by Yarrow Chemical Products, Mumbai, India; Sodium Alginate (AR grade), and Polyethylene glycol 400 was obtained from Merck, India; Lactose monohydrate, Sorbitol (Liquid 70%) was procured from CDH, India; Glycerol was purchased from Loba chemie, Mumbai, India. All the chemicals and solvents used were of analytical grade and used without further purification. Double-distilled water was used throughout the study.
Experimental design and preparation of pharmaceutical wafers
The solvent casting method was opted as it is the most convenient and inexpensive manufacturing process for making Oro-dispersible/quick dissolving thin films or wafers as demonstrate in the literature (Hoffmann et al., Citation2011). In short, this method includes the preparation of the base material by the mixing film forming excipients and the API together in a suitable solvent or solvent system The wafers were prepared following to the 32 factorial design, where the concentration of the two carrier(s) (factors) was varied at three levels as hypothesized by the design where the concentration of sodium alginate as a bioadhesive polymer (X1) and Lactose monohydrate as a matrix former (X2) were studied as independent variable and the physicochemical and physico-mechanical properties of the prepared wafers such as bioadhesive force (Y1), % Swelling Index (Y2), Disintegration time (Y3) and time taken for the release of 70% of drug (t70% or Y4) were studied as responses. In short the required amount of film former (HPC), bioadhesive polymers (Sod. alginate), plasticizer, matrix former (Lactose monohydrate) and drug (LOR) were mixed in aqueous solvent and casted on a polypropylene petri plates (Polylab Industries Pvt. ltd., India) and kept overnight to remove the entrapped air bubbles. The suspension was kept for drying at 45 °C and wafers were cut to requisite size (dia. 2.2 cm) and kept in desiccators, maintaining relative humidity (60 ± 5%) till further analysis (Chakraborty et al., Citation2013a). All the nine experimental batches were named as FNA with numerical suffix from 1 to 9 in accordance with the experimental design detailed in . The upper limit of bioadhesive polymer was set to 1.5% w/v because a wafer of higher polymer concentrations increases in their thickness which may be difficult to keep in the oral cavity. Some wafers, produced with polymer concentrations below 0.5% w/v were difficult to remove from the plates and less than 0.5% w/v of polymer was not sufficient to form the wafer matrix. The concentrations of lactose monohydrate higher than 1.5% w/v caused the wafer to be powdery and extremely fragile.
Table 1. The 32 factorial design matrix (independent variables and their coded and actual levels; and the experimental results of responses(dependable variables) and other physicochemical characteristics of experimentally designed wafers.
Estimation of surface pH of the wafers
The wafers were allowed to swell for 10 min on the surface of an agar plate composed of 2% m/v in isotonic phosphate buffer pH 6.75.The surface pH was measured by means of a pH paper placed on the surface of the swollen wafer. The mean of three readings was recorded (Nafee et al., Citation2003).
Estimation of disintegration time of the wafers
The wafer size (3.80 cm2) was placed on a glass Petri dish containing 10 ml of distilled water. The time required for wafer to break was noted as in vitro disintegration time. Three replicates were done for each formulation (El-Setouhy & El-Malak, Citation2010).
Estimation of Radial Swelling Index of the wafers
Radial Swelling Index of the wafers was calculated by allowing the samples to swell on the surface of an agar plate kept in an incubator maintained at 37 °C. Measurement of the diameter of the swollen wafer was done at 1 h. Three wafers were tested for each formulation. Radial swelling was calculated by diameter method from the following equation (Ahmad et al., Citation2008).
In vitro analysis of buccoadhesion
In vitro bioadhesion analysis of the prepared wafers was done with a TAXT2i Texture Analyzer (Stable Micro system, Surrey, UK) using bovine buccal mucosa as a model membrane, which was procured from local slaughter house, cleaned, washed, and stored at −20 °C and before commencement of the experiment, it was hydrated with simulated saliva solution and allowed to reach normal room temperature (25 °C). The buccal mucosa was attached to the lower probe of the assembly. The wafer was attached to the upper probe of the assembly using double-sided adhesive. The upper probe was allowed to fall on the lower probe with test speed 0.5 mm/s and post test speed 1 mm/s. An applied force 150 g was given to allow the wafers to adhere to the bovine buccal mucosa membrane with return distance 10 mm. The experiment was carried out at room temperature (Ahmad et al., Citation2008).
Surface morphology analysis
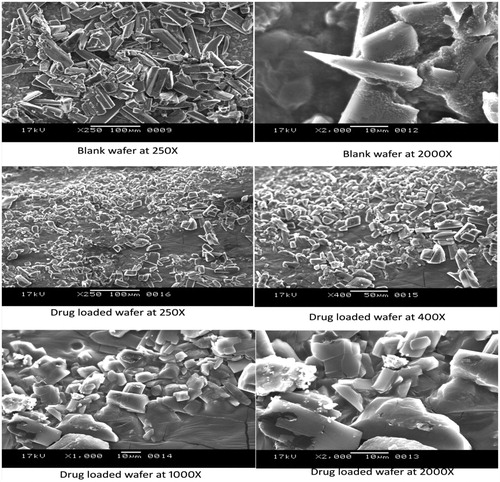
Dried placebo and drug-loaded wafers were examined under a SEM (JEOL-JSM-6360, JEOL Datum Ltd, Tokyo, Japan). SEM photographs of samples were taken at 12 kV intensity at magnifications from 250 to 2000 X.
In-vitro LOR release study
The in-vitro drug release of the wafers has been carried out by performing the dissolution experiment in a paddle type dissolution apparatus (Excel enterprises, Kolkata, India) equipped with six baskets. In order to mimic the in-vivo adhesion and to prevent the wafers from floating, each wafer was fixed to a rectangular glass slab and placed at the bottom of the dissolution vessel prior to starting the dissolution test. The dissolution medium comprised of 250 ml of simulated salivary fluid pH 6.75. The rotation speed was kept at 50 rpm at 37 °C ± 0.5 °C. At regular intervals of time (30 s) sample aliquots were withdrawn, filtered through a 0.45 μm membrane filter and analyzed by UV spectrophotometer (Thermo Scientific UV1, Thermo Fisher Scientific, MA) at a fixed λmax value of 248 nm. The withdrawn amount of dissolution medium was calculated. Cumulative percentage of drug released in the respective dissolution medium was plotted as a function of time. Each formulation was tested and analyzed in triplicate (Chakraborty et al., Citation2013a).
Experimental design and predictive modeling, optimization by response surface methodology (RSM) and artificial neural networks (ANNs)
The data set obtained from 32 factorial designs () was used for the optimization of the responses of pharmaceutically developed wafers (Chakraborty et al., Citation2013a). The response surface methodology (RSM) and artificial neural networks (ANNs) were used to fit experimental data.
Table 2. Experimental (OBS) and predicted values of ANN and RSM for chosen responses.
In the RSM, the responses can be simply related to chosen factors by first-order or second-order polynomial models. The first-order model uses a low-order polynomial model, which is appropriate for describing a flat surface, according to the equation:
(1)
(1)
where y is the predicted response, is the β0 constant term, βi represents the coefficients of the linear parameters, Xi represents the variables and ε is the random error (Antonopoulou et al., Citation2008).
A second-order model may be studied in order to locate the optimum point. A second-order model is given as follow (Antonopoulou et al., Citation2008)
(2)
(2)
where βii represents the coefficients of the quadratic parameter.
Statistical analysis was performed using the software package Design Expert® software (Trial version 8.0.7.1, Stat-Ease Inc., Minneapolis, MN, USA) and a regression model was proposed and published (Chakraborty et al., Citation2013a). Analysis of variance (ANOVA) was performed based on the proposed model to find the interaction between the process variables and the response. The quality of the fit for the polynomial model was expressed by the coefficient of determination (R2, R2 adj.), and statistical significance was checked by the F-value (Fisher variation ratio), p value and adequate precision in the same program. Finally, three-dimensional response surface plots were drawn in order to visualize the individual and the interaction effects of the independent variables on different physicochemical and physico-mechanical properties of the developed wafers taken as responses.
On the other hand, ANNs are computational model programs which can approximate complex nonlinear relationships existing between independent (ANN input) and dependent (ANN output) variables to an arbitrary degree of accuracy (Huitao et al., Citation2002). ANNs are built from nonlinear data processing units (artificial neurons), thus permit for effective identification of non-linear problems, which are sometimes tough in statistical approaches. The main lead role of neural networks is their ability to represent complex input/output relationships. They are well suited for use in data classification, function approximation, and signal processing, among others (Ihme et al., Citation2006). The topology of an ANN is determined by the number of its layers, number of neurons in each layer and the nature of learning algorithms and transfer functions. Finding the best ANN topology is the most important step in development of a model (Huitao et al., Citation2002). In the present study a Multilayer perceptrons (MLP) back propagation conjugate gradient descent method (BP, CG) was used in modeling and optimization of pharmaceutically developed wafers provided by computer software package STATISTICA Neural Network software (Stat Soft Inc., Tulsa, OK). shows the general structure of the MLP used in the proposed methodology.
In order to determine the optimal number of neurons in the hidden layer, MLPs with different number of hidden layer neurons (varying from1 to 11 in our case) were trained. After finding the optimal networks it was used to identify the optimum region of the responses. The predicted values were compared with the measured output values. Testing the neural network with similar data which was used in the training set is one of the few methods described to verify the network efficiency to learn the input domain (Huitao et al., Citation2002; Garcia et al., Citation2004). We offered the values of two test formulations (Test 1, Test 2) to MLP, when network was trained, to validate the network.
Contact angle measurement of the optimized wafer of LOR
The Sessile drop method, i.e. a sitting drop, as a drop of water resting on a table was utilized for the study. The drop shape analyzer (Data Physics, Germany; OCAH 230) records visual data for the measurement of contact angles. Images at different time interval: 0 s, 30 s and 60 s were taken () and evaluated (Garsuch & Breitkreutz, Citation2009).
In vivo evaluation
Male rabbits (New Zealand, White) weighing 2.2–2.8 kg were chosen and were given access to a normal standard diet and tap water ad libitum. Food was withdrawn from the rabbits 12 h before drug administration. Throughout the experiment, the animals were housed, two per cage, maintained at 22 ± 2 °C, 50–60% relative humidity. Rabbits were divided into three groups of three each; the 1st group received Loratadine oral solution (2.5 mg Loratadine was dissolved in a minimum quantity of 95% v/v ethanol), the 2nd group received buccoadhesive wafer (FNA8) which was optimized through RSM in our previous study (Chakraborty et al., Citation2013a) with a 2.5 mg drug loading per wafer and the 3rd group was kept as control which received normal saline. The institutional animal ethical committee (BCPSR, Durgapur, West Bengal, India, Protocol approval no. BCPSR/IAEC/2013/001) approved the protocol for this study.
Estimation of LOR in rabbit plasma
In the present study, plasma LOR concentration in rabbits at different time intervals was estimated by HPLC method (Cho et al., Citation2008). The isocratic HPLC apparatus (Shimadzu, Japan) with a Binary LC-10 A VP pumps and a PDA Detector with Temperature Controller SPD-10AVP Column Oven was used. Detection and quantification were performed using Class VP, Ver: 2.3 software (Shimadzu Corp., Kyoto, Japan). HPLC analysis was performed at room temperature using a Hypersil BDS C18 (250 mm × 4.6 mm, 5 µ Particle Size) column. The mobile phase was a mixture (80:20, vv) of acetonitrile and 0.025 M sodium dihydrogen phosphate buffer, which was adjusted to pH = 3.7 with H3PO4. A flow rate of 1.0 mL/min was maintained at an operating pressure of approximately 1000 psi through a rheodyne injector system fitted with 20 µl fixed loop. The eluent was monitored with a PDA detector set at 248 nm. The different chromatograms are shown in .
Pharmacokinetic study
Estimation of pharmacokinetic parameters was obtained from the plasma LOR concentration versus time profile data. The maximum plasma drug concentration (Cmax) and the time required to reach Cmax (tmax) were directly read from the plasma concentration versus time data. The overall elimination rate constant (Kel) was obtained from the slope of the terminal elimination phase of a semi logarithmic plot of concentration versus time after subjecting it to linear regression analysis. The half-life (t1/2) can be calculated by dividing 0.693 with Kel. The area under the plasma LOR concentration time curve (AUC) up to the last sampling point was determined by using PKPD software. Relative bioavailability of LOR loaded optimized wafer in comparison to reference LOR oral solution was calculated by dividing its AUC0–8 with that of reference LOR solution.
Results and discussion
Estimation of surface pH of the wafers
As a low surface pH might cause damage to contacting mucosal surface, it was therefore important to determine the pH of the wafers as it will be administered in the buccal cavity. The measured pH of the wafers will not cause any irritation at the site of administration, i.e. buccal cavity as the pH of other wafers were almost similar to the pH of the salivary fluids represented in .These results approved the non irritancy of prepared wafers in to the buccal cavity.
Estimation of disintegration time of the wafers
Disintegration is defined as deaggregation of solid dosage form (e.g. tablet or capsule) into its primary particles. The disintegration of solid dosage form is thereby distinguished from drug dissolution. But in case of oral wafers or films, disintegration and concurrent dissolution in a small amount of saliva, makes it difficult to mimic in natural conditions and measure with an adequate method. In the present study Petri dish method was performed to evaluate the disintegration process of the wafers and result depicted that almost all wafer formulations needed less than 2 min to disintegrate completely (), fulfilling the criteria of a fast dissolution.
Estimation of Radial Swelling Index of the wafers
Swelling is defined as the expansion in aqueous media. Swelling is an important parameter to be studied before considering bioadhesion (El-Kamel et al., Citation2002). In this study, an agar plate model was preferred as the simple model of the mucosa as it is able to keep an amount of water that bears a resemblance to the secreting fluid in and around the buccal mucosa, required for bioadhesion and consequent swelling of the formulation to provide adequate release of drug. The polymeric materials become adhesive with hydration but excessive swelling leads to reduced mucoadhesiveness, because water molecules bind to polymer groups responsible for adhesion (Parodi et al., Citation1996). Swelling index study reveals the fact of high swelling of the wafer as the buccoadhesive polymer concentration increase in concentration ().
In vitro analysis of buccoadhesion
Among several factors influencing mucoadhesive properties of a dosage form, viscosity, hydrogen bonding capacity and concentration of a polymer, as well as other environmental factors have a notable effect on adhesion forces. Previous studies in solid bioadhesive systems showed increase in amounts of polymers resulted in superior potency of mucoadhesion (Movassaghian et al., Citation2011). The buccoadhesive property of wafers of LOR containing a fixed proportion of Hydroxypropyl cellulose and varying proportions of Sodium alginate and lactose monohydrate determined with a view to develop wafers with good adhesiveness without any irritation and other problems. The results () showed that the prepared wafers are having good bioadhesive strength to be remaining in the buccal cavity to facilitate drug absorption through buccal mucosa.
Surface morphology analysis
SEM photographs displayed the high resolution micro-structure of the blank and drug-loaded wafers (). Lactose monohydrate crystals dispersed throughout the wafer were clearly visualized through SEM photomicrographs. Surface morphology analysis offered the depiction of the whole wafer structure to get an impression of the wafer texture along with its microstructure with the help of SEM.
Figure 1. SEM photograph of the experimentally developed wafers.
In-vitro LOR release study
The in vitro release profile of LOR from the experimentally designed wafers ware studied at simulated saliva pH 6.75 (). The t70% for each wafer system was enlisted in . Oral wafers of each trial formulation were pretested for disintegration time. Three-hundred seconds seem to have the longest time by which all wafer formulation would be found disintegrated completely thus the criterion of measuring 300 s was estimated. As expected, increase in hydrophilic polymer content in the wafer matrix showed decrease in LOR release from the wafers. This may be due to increase in the mechanical strength of these formulations which determines their rate of hydration and ultimate dissolution (Boateng et al., Citation2009). This finally affects the rate at which the drug diffused through the gel and released into the dissolution medium. Another reason may be, due to the tight binding exhibited by lactose monohydrate in forming the hydrophilic matrix within the wafers, but this phase lasts only for a short period of time. More than 70% of the drug release was observed within 240 s from all the prepared wafer formulations.
Figure 2. Cumulative % drug release versus time plot of wafers coded as FNA.
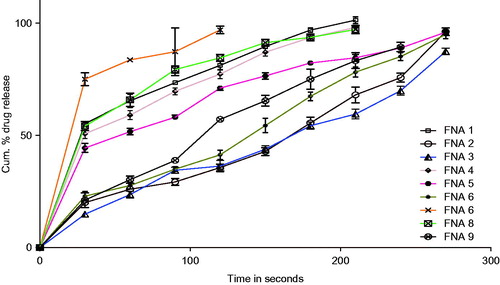
Fitting of the dissolution data to the four kinetic models such as Zero order, first order, Higuchi and Korsmeyer–Peppas kinetic equations and investigation of the r2 values showed that the Kormeyer–Peppas equation modeled the release curves most accurately. Investigation of the r2 values and diffusion coefficient “n” value from Kormeyer–Peppas equation gave an idea that lower the value of n (<0.5) for the set of formulations at lower concentration of the variables, viz. sodium alginate and lactose monohydrate consecutively, quicker the drug release observed which could be described as quasi-Fickian diffusion mechanism to exist. Increase in Lactose monohydrate concentration results in positive shift in the n value, attributing to a change from quasi-Fickian diffusion mechanism to Case I anomalous Fickian diffusion transport ().
Table 3. Results obtained by fitting the experimental drug release data to the Korsmeyer–Peppas kinetic equation.
RSM modeling and optimization of physicochemical and physicomechanical properties of pharmaceutically developed wafers of LOR
The 32 factorial design and experimental result obtained for the different responses for the two independent factors i.e. concentration of Sod. Alginate and concentration of lactose monohydrate was presented in . The optimization procedure for the dependable variables (responses) like bioadhesive force, disintegration time, % Swelling Index and t70% was discussed in detail in our earlier published work (Chakraborty et al., Citation2013a). In short the polynomial quadric model equations fitted for the different responses were written as:
(3)
(3)
(4)
(4)
(5)
(5)
(6)
(6)
The terms AB and A2 and B2 are the interaction and polynomial terms, respectively. The main effects (A and B) postulate the average result of changing one factor at a time from its low to high value. The interaction term (AB) shows how the response changes when two factors are changed accordingly. The polynomial terms (A2 and B2) symbolize nonlinearity.
When an optimum setting for the formulation was generated by the numerical optimization technique following desirability approach in RSM, keeping the bioadhesion force in target of 53.33 g, the disintegration time of the wafer at 0.5 min (30 s), percentage swelling index in range of 49.51 and 83.81, and t70% at 135 s, we observed that FNA 8 fulfills all the criteria of quick dissolving wafer formulation (Chakraborty et al., Citation2013a).
The results of ANN technique used for prediction of different physicochemical and physicomechanical properties of wafers of LOR
The structured ANN consist of three layers: first layer with 2 input units, the second layer with 10 hidden units and the third layer with 4 output units as shown in .
Figure 3. ANN MLP network architecture.
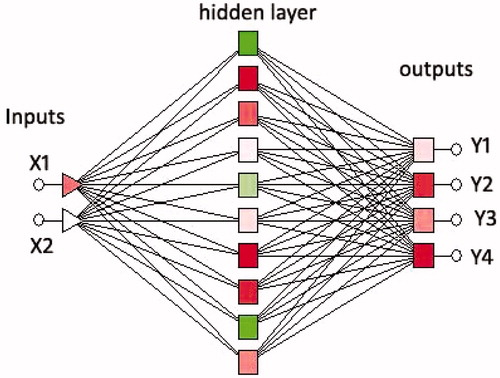
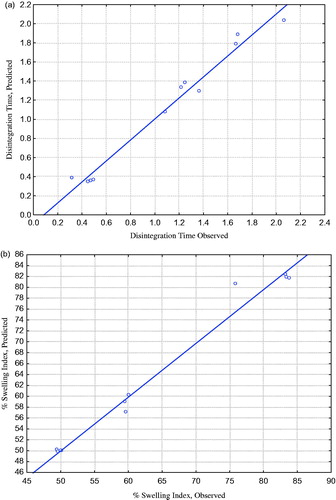
In the ANN used for the prediction process, the architecture 2-10-4 (with 10 neurons in the hidden layer) of an MLP neural network permitted the lowest training and verification errors and it was the best network for prediction of optimal physicochemical physicomechanical responses of pharmaceutically developed wafers of LOR. The training algorithm conjugate gradient descent was used since the training error was 0.044687 and verification error was 0.469528. There was a good predictive performance and the correlation coefficient of the training set was found R2 = 0.9442 (Y1), R2 = 0.9873 (Y2), R2 = 0.9727 (Y3), R2 = 0.9323(Y4) ().
Figure 4. Plot of experimental data against predicted data given by ANN model for (a) disintegration time (b) % swelling index.
This network was then used to construct the response surfaces throughout the experimental range ().
Figure 5. [a–d] Surface plots obtained from optimization of pharmaceutical wafers using ANN.
![Figure 5. [a–d] Surface plots obtained from optimization of pharmaceutical wafers using ANN.](/cms/asset/ce148238-5d88-49ed-9d5d-c84b6af97f5a/idrd_a_930759_f0005_c.jpg)
For validation of the network Input values for test formulations (Test 1, Test 2), generated from optimization technique through RSM, were presented to MLP when network was trained to validate the network.
Comparison of RSM and ANN models
The data obtained from RSM and ANN prediction of different wafer formualtion were presented in . The Student t test carriedout between the predicted results (t value = 0.4335, p value = 0.6693) from the ANN and the experimental results and predicted result from factorial design and experimental results(t value 0.0006374, p value = 0.9995) showed no statistically significant difference between them. The Normalized Error (NE) between the predicted and experimental response variables was employed as an evaluation standard between ANN and RSM. The Normalized Error (NE) value observed with the optimal ANN structure was 0.0994,while it was 0.00087 incase of second-order polynomial equation (RSM) (Subramanian et al., Citation2004).
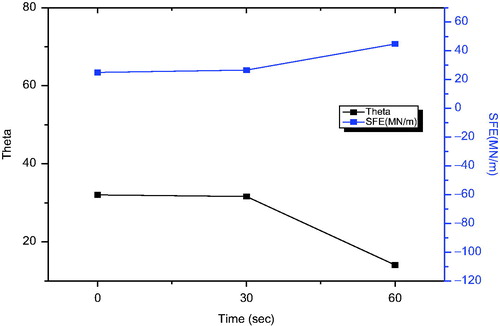
Contact angle measurement study
In the investigation of the contact angle on the surface of the wafer, changed during measurement due to penetration of drops into the surface of the wafer. After 30 s the wafers were wetted a little changing the contact angle 32.07° to 31.63°. But after 60 s the wafers are sufficiently wetted to decrease the contact angle to 14.1° (). Likewise the Surface free energy (SFE) also increased from 63.42(Mn/m) to 70.71 (Mn/m) (). The obtained result allows possible predictions for the wetting behavior of the oral wafers, their disintegration and dissolution in the oral cavity (Garsuch & Breitkreutz, Citation2009).
Figure 6. (a), (b), (c) and (d) show images of optimized drug-loaded wafers during contact angle measurement at different time points.
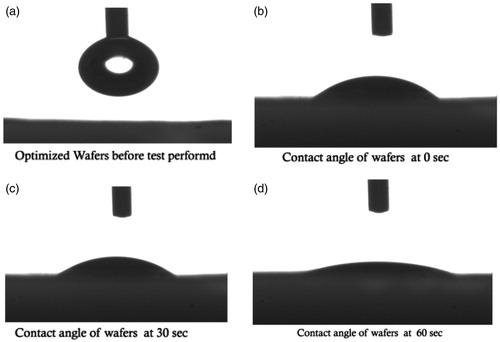
Figure 7. Plot of time versus SFE during contact angle measurement of the optimized wafer.
Pharmacokinetic study
All the HPLC chromatograms () obtained during in vivo study reflected that the IS and analyte was well resolved in this particular bioanalytical method. shows the mean plasma LOR concentration versus time profile attained following oral administration of a solution of LOR and optimized buccoadhesive wafer. The tmax of LOR from oral solution was 90 min, and the peak concentration (Cmax) at that time was 45 ng/ml. In the case of optimized wafer, the Cmax was 160 ng/ml, which was significantly different from that obtained from oral solution. The mean tmax value after administration of optimized wafer was 180 min, which was significantly different from oral solution of LOR, i.e. 90 min (). The elimination rate constant (kel) of the drug from solution was 0.003875 min, and that obtained from the optimized wafer was 0.002545 min. The extent of absorption (bioavailability) was significantly higher with optimized wafer as seen from the AUC0–8 (56 190 ngmin/ml) followed by the solution of LOR (11 160 ng h ml−1) (). When the AUCs obtained from the optimized wafer was divided by the AUC obtained from the LOR solution, the relative bioavailability values for both the formulations were obtained.
Figure 8. HPLC chromatograms obtain during pharmacokinetic study.
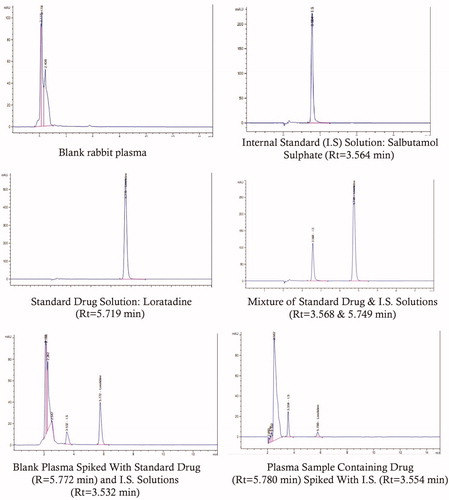
Figure 9. Plasma drug concentration versus time profile of Loratadine in rabbit plasma after administration of drug solution and optimized wafer orally.
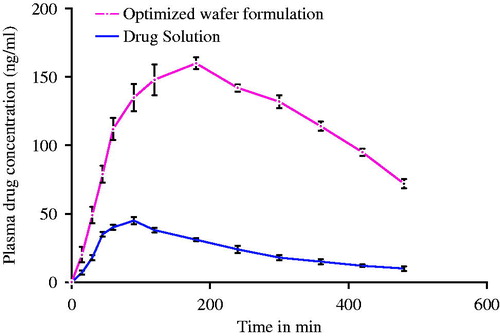
Table 4. Pharmacokinetic parameters of optimized buccoadhesive wafer (shown as Mean, n = 3).
The relative bioavailability from optimized buccoadhesive wafer was high when compared with that of the solution (). The pharmacokinetic results provide proof of concept that Loratadine formulated as a buccoadhesive wafer results in a statistically significant increase in its bioavailability, probably due to absorbed through buccal mucosa and reduction of first-pass metabolism (Noehr-Jensen et al., Citation2006).
Conclusion
Pharmaceutical wafers containing LOR was developed by using solvent casting method with sodium alginate as buccoadhesive polymer and lactose monohydrate as hydrophilic matrix former following design of experiment approach utilizing 32 factorial designs. The effect of the above independent variable on the different physicochemical and physico-mechanical properties of the developed wafers such as buccoadhesive strength, % swelling index, disintegration time and t70% were optimized through RSM and ANN algorithm. The ANN and RSM prediction were in agreement with the experimental results. The study confirmed that both RSM and ANN is useful tool to understand the effect of ingredients on the physicochemical and physicomechanical behavior of buccoadhesive wafers. Though both RSM and ANN models provided good quality predictions in this study, yet the RSM showed a clear superiority over ANN in both data fitting and estimation capabilities. This confirms the disadvantage of ANN which generally requires large amount of training data in comparison with RSM (Ebrahimpour et al., Citation2008). The surface morphology study through SEM exhibited the microstructure of the wafers. In vitro drug release confirms that all experimentally designed wafer formulation has the ability to release drug within few seconds. The release mechanism is found to follow Korsmeyer–Peppas kinetic equation. Contact angle measurement reflected the fast disintegration behavior of the optimized wafer with quick change in its SFE. The pharmacokinetic study of the optimized wafer reveals a significant increase in bioavailability of LOR in rabbit plasma compared to oral solution which confirms the absorption of LOR from buccal route bypassing hepatic first pass metabolism.
Acknowledgements
The authors are grateful to the Department of Metallurgy, Jadavpur University, Kolkata, India for providing SEM facility, Birla Institute of Technology, Mesra, Ranchi, India for providing optical contact angle measurement facility and Girijananda Institute of Pharmaceutical Sciences, Guwahati, Assam, India, for providing TAXT2i Texture Analyzer facility. The authors are also thankful to the Management, Bengal College of Pharmaceutical Sciences and Research, Durgapur, India for providing necessary facilities to carry out the research work.
Declaration of interest
The authors report no conflicts of interest. The authors alone are responsible for the content and writing of this article.
References
- Ahmad FJ, Alam MA, Khan ZI, et al. (2008). Development and in vitro evaluation of an acid buffering bioadhesive vaginal gel for mixed vaginal infections. Acta Pharm 58:407–19
- Antonopoulou M, Papadopoulos V, Konstantinou I. (2008). Photocatalytic oxidation of treated municipal wastewaters for the removal of phenolic compounds: optimization and modeling using response surface methodology (RSM) and artificial neural networks (ANNs). J Chem Technol Biotechnol 87:1385–95
- Barnhart SD. (2008). Thin film oral dosage forms. In: Rathbone M, Hadgraft J, Roberts M, Lane M, eds. Modified release drug delivery technology. 2nd ed. London: Informa Healthcare, 209–16
- Boateng JS, Matthews KH, Auffret AD, et al. (2009). In vitro drug release studies of polymeric freeze-dried wafers and solvent-cast films using paracetamol as a model soluble drug. Int J Pharm 378:66–72
- Bouckaert S, Massart DL, Massart B, Rremon JP. (1996). Optimization of a granulation procedure for a hydrophilic matrix tablet design. Drug Dev Ind Pharm 22: 321–7
- Chakraborty P, Dey S, Parcha V, et al. (2013a). Design Expert Supported Mathematical Optimization and Predictability Study of Buccoadhesive Pharmaceutical Wafers of Loratadine. BioMed Res Int Article ID 197398
- Chakraborty P, Parcha V, Chakraborty DD, et al. (2013b). Mathematical optimization and characterization of pharmaceutically developed novel buccoadhesive wafers for rapid bioactive delivery of Loratadine. J Pharm Invest 43:133–43
- Cho CW, Kim SJ, Yang KH, et al. (2008). Enhanced controlled release of Loratadine from the ethylene-vinyl acetate matrix containing plasticizer. Drug Deliv 15:423–8
- Danckwerts MP. (2003). Intraoral drug delivery: a comparative review. Amer J Drug Del 1:149–224
- Deadman LLF. (1964). New impregnated or coated films. GB 1061557–A
- Ebrahimpour A, Abd Rahman RNZR, Ean Ch’ng DH, et al. (2008). A modeling study by response surface methodology and artificial neural network on culture parameters optimization for thermostable lipase production from a newly isolated thermophilic Geobacillus sp. strain ARM. BMC Biotec 8:96. doi:10.1186/1472-6750-8-96
- El-Kamel A, Sokar M, Naggar V, Al Gamal S. (2002). Chitosan and sodium alginate-based bioadhesive vaginal tablets. AAPS Pharm Sci Tech 4:224–30
- El-Setouhy DA, El-Malak NSA. (2010). Formulation of a Novel Tianeptine Sodium Orodispersible Film. AAPS Pharm Sci Tech 11:1018–25
- Garcia SF, Sanchez MJ, Rodriguez–Delgado MA. (2004). Optimization of the separation of a group of triazine herbicides by micellar capillary electrophoresis using experimental design and artificial neural networks. Electrophoresis 25:1042–50
- Garsuch V, Breitkreutz J. (2009). Novel analytical methods for the characterization of oral wafers. Eur J Pharm Biopharm 73:195–201
- Hariharan M, Bogue A. (2009). Orally dissolving film strips (ODFS): the final evolution of orally dissolving dosage forms. Drug Deliv Technol 9:24–9
- Hoang Thi TH, Lemdani M, Flament MP. (2013). Optimizing the taste-masked formulation of acetaminophen using sodium caseinate and lecithin by experimental design. Int J Pharm 453:408–15. doi: 10.1016/j.ijpharm.2013.05.026
- Hoffmann EM, Breitenbach A, Breitkreutz J. (2011). Advances in orodispersible film for drug delivery. Expert Opin Drug Deliv 8:299–316
- Huitao L, Ketai W, Hongping X, et al. (2002). Application of experimental design and artificial neural networks to separation and determination of active components in traditionalchinese medicinal preparations by capillary electrophoresis. Chromatographia 55:579–83
- Ihme M, Marsden AL, Pitsch H. (2006). On the optimization of artificial neural network for application to the approximation of chemical systems. Center for Turbulence Research Annual Research Briefs 105–18
- Movassaghian S, Barzegar-Jalali M, Alaeddini M, et al. (2011). Development of amitriptyline buccoadhesive tablets for management of pain in dental procedures. Drug Dev Ind Pharm 37:849–54
- Nafee NA, Ismail FA, Boraie NA, Mortada LM. (2003). Mucoadhesive buccal patches of miconazole nitrate:in vitro/in vivo performance and effect of ageing. Int J Pharm 264:1–14
- Noehr-Jensen L, Damkier P, Bidstrup TB, et al. (2006). The relative bioavailability of loratadine administered as a chewing gum formulation in healthy volunteers. Eur J Clin Pharmacol 62:437–45
- Parodi B, Russo E, Caviglioli G, et al. (1996). Development and characterization of a buccoadhesive dosage form of oxycodone hydrochloride. Drug Dev Ind Pharm 22:445–50
- Patel AR, Prajapati DS, Raval JA. (2010). Fast dissolving films (FDFs) as a newer venture in fast dissolving dosage forms. Int J Drug Dev Res 2:232–46
- Subramanian N, Yajnik A, Murthy RSR. (2004). Artificial neural network as an alternative to multiple regression analysis in optimizing formulation parameters of cytarabine liposomes. AAPS Pharm Sci Tech 5:11–19
- Szabados-Nacsa A, Sipos P, Martinek T, et al. (2011). Physico-chemical characterization and in vitro/in vivo evaluation of loratadine:dimethyl-_-cyclodextrin inclusion complexes. J Pharma Biomed Anal 55:294–300