
Abstract
Background: Epirubicin-HCl is highly efficient for breast cancer management at a concentration of 60–90 mg/m2. However, its application is limited due to cumulative dose-dependent cardio-toxicity.
Purpose: The main aim of this study was to formulate breast cancer-targeted liposomal carrier by surface conjugation of transferrin to minimize cardio-toxicity of drug along with improved pharmacokinetic profile.
Method: Liposomes were formulated by ethanol injection method using HSPC, cholesterol and DSPG and later loaded with drug by the ammonium sulfate gradient method. The formulation was characterized for physicochemical properties like size, zeta potential, entrapment efficiency, TEM; in vitro tests like electro-flocculation, hemolysis and drug release; cell line study (MCF-7 cells); in vivo studies including LD50 determination, pharmacokinetic analysis, myocardial toxicity determination and stability.
Results and discussion: Optimized formulation had molar ratio of 60:30:8:2 (HSPC:Chol:DSPG:mPEG-DSPE) with entrapment efficiency ∼83%, particle size below 200 nm and zeta potential about −20 mV. In vitro studies proved non-interfering property and drug release character of formulation while cell line studies demonstrated improvement in cell uptake and thereby increased cytotoxicity of targeted formulation. The IC50 value obtained for epirubicin solution, non-targeted and targeted liposomes was 0.675, 0.532 and 0.192 µg/ml, respectively. Furthermore, in vivo tests validated safety and distribution profile of prepared formulations.
Conclusion: Apt properties of prepared Epirubicin-HCl liposomal formulation warrant its clinical application in breast cancer treatment after further studies.
Introduction
Breast cancer is one of the most prevalent diseases among women worldwide and has become potential threat. It is second most diagnosed disease amidst both sexes. After lung cancer, it is foremost cause of women’s death globally. The median survival time of patients with metastatic breast cancer is 2–3 years without treatment (Winer et al., Citation2001). Thus, proper treatment of breast cancer has nowadays become a necessity.
Anthracyclines belong to a class of most active agents used in the treatment of breast cancer. Average response rate to anthracyclines is approximately 40–50% when used as single agent in breast cancer treatment (Henderson, Citation1991). They act by DNA intercalation and inhibiting topoisomerase II, which further interfere with DNA, RNA and protein synthesis. Epirubicin-HCl, a 4′-epimer of doxorubicin, has several beneficial effects over doxorubicin including improved efficacy, lower toxicity, rapid clearance from plasma resulting in less cumulative dose, and thus can successfully replace doxorubicin in breast cancer treatment. However, Epirubicin-HCl, like other anthracyclines, shows cardiotoxicity (Ryberg et al., Citation2008) when its cumulative dose exceeds 900 mg/m2. Hence, the main objective of this study was to minimize its cardiotoxicity and improve pharmacokinetics to provide the desired drug concentration at intended site.
Stealth liposomes can be developed by surface modification with PEG, which leads to prolonged plasma circulation improving pharmacokinetic profile and reducing clearance by circumventing RES uptake (Kolate et al., Citation2014). But, stealth liposomes create steric barrier on liposomal surface which could hinder liposomal uptake by tumor tissue (Harvie et al., Citation2000). Thus, various ligands or antibodies can be grafted on PEG-conjugated liposomal surface, resulting in its active uptake in tumor cells (Khatri et al., Citation2014).
Human transferrin is serum glycoprotein which transports ferric ions inside cells via receptor-mediated endocytosis. Transferrin receptor overexpression is found in various cancer cells. In addition, its expression increases by 4–5 times (Walker & Day, Citation1986) in malignant breast cells compared to non-neoplastic breast cells, and thus it can be used as a potential target for specific delivery to tumor tissue. Furthermore, surface conjugation of transferrin would lead to accumulation of liposomes inside cancerous tissue, and thus sparing normal cells resulting in improved therapy and minimized adverse effects.
Hence, in this study, Epirubicin-HCl encapsulated stealth liposomes were formulated and surface modified by transferrin. The developed liposomes were examined for hemolytic potential, stability against electrolyte induced flocculation, drug release profile and serum stability. In vitro cell line studies were carried out to find out toxicity profile and intracellular uptake of developed liposomes using MCF-7 cell line. In vivo toxicity and pharmacokinetic behavior were also evaluated using healthy rats and mice. Finally, the formulation was exposed to accelerated stability testing.
Materials and methods
Materials
HSPC, DSPG, mPEG2000–DSPE were acquired as gift sample from Lipoid GmbH (Ludwigshafen am Rhein, Germany); cholesterol, sephadex-G-25, Dowex-50-WX-4, human holo-transferrin, Traut’s reagent, sepharose-CL-4B, Ellman’s reagent, rhodamine-B, bromophenol blue, glycine, tris-base, SDS, β-mercaptoethanol, ammonium persulfate, acrylamide, TEMED and Folin–Ciocalteu’s reagent were purchased from Sigma Aldrich (St. Louis, MO); methanol, chloroform and other analytical reagents were purchased from Spectrochem (Mumbai, India); dialysis membrane-70, fetal bovine Serum (FBS), MTT, Eagle’s-MEM, Antibiotic solution (10 000 units Penicillin, 10 mg Streptomycin and 25 µg Amphotericin B per ml) were procured from Himedia Lab. Pvt. Ltd. (Mumbai, India); Coomassie Blue R-250, Precision Plus unstained marker were acquired from Biorad (Hercules, CA). MCF-7 cell line was obtained from NCCS (Pune, India).
Preparation of liposomes
Preparation of stealth liposomes
Liposomes encapsulating Epirubicin-HCl were formulated by active loading using the ethanol injection method. First, blank liposomes were prepared by dissolving HSPC, cholesterol, DSPG, mPEG2000–DSPE in 0.5 ml ethanol at molar ratio of 60:30:8:2. This solution was added to 1 ml of 250 mM ammonium sulfate solution kept at 60 °C and stirred for 15 min resulting in the formation of multilamellar vesicles (MLV). This MLV preparation was sonicated using probe sonicator for 1 min (Labsonic M, Sartorius, Mumbai, India) keeping 80% amplitude and cycle time 0.8 s to acquire unilamellar liposomal dispersion. Unentrapped ammonium sulfate from liposomal dispersion was removed by gel filtration chromatography using Sephadex-G-25 column.
Formed blank liposomes were loaded with Epirubicin-HCl by ammonium sulfate-gradient method. Epirubicin-HCl, dissolved in 1 ml 10% glucose solution, was added to the liposomal suspension previously heated to 65 °C at drug:phospholipid molar ratio 1:5. Stirring was continued for 2 h at 65 °C to obtain stealth Epirubicin-HCl liposomes. Free drug was separated from liposomal preparation using Sephadex-G-25 column.
Preparation of transferrin conjugated liposomes
For transferrin conjugation, 1 mole% of DSPE–PEG2000–Maleimide was added in ethanolic solution along with previously described lipids and liposomes were formulated as described in the “Preparation of stealth liposomes” section.
Subsequently, transferrin was reacted with traut’s reagent in molar ratio of 10:1 for 1 h at 37 °C in borate buffer (pH = 8.5) to convert it to thiolated form and unreacted traut’s reagent was removed by gel filtration chromatography. The thiolated transferrin was incubated with liposomal dispersion for 24 h at room temperature. Unconjugated transferrin was separated from liposomal formulation by Sepharose-CL-4B column and the eluent collected contained transferrin conjugated liposomes (Gijsens et al., Citation2002).
Physicochemical tests
Size distribution and Zeta potential
Appropriate volume of liposomal formulations was transferred to clear disposable sample cuvettes and measurements were performed using Brookhaven 90Plus Particle Size Analyzer (Brookhaven, Holtsville, NY).
Liposome morphology and lamellarity
Morphology and lamellarity were evaluated using Technai20 Transmission Electron Microscope (Phillips, Eindhoven, Holland). For this, 50 µl of sample was taken on carbon film-coated copper grid and air dried. After staining with uranyl acetate, grid was placed in sample probe, inserted in microscope and observed at 200 kV accelerating voltage with suitable magnification between 25–75 000×.
Entrapment efficiency and drug loading
Free drug, entrapped drug and total drug content in the formulation were determined by dissolving the formulation in methanol (1:10 v/v ratio) and analyzed using HPLC (Shimadzu, Kyoto, Japan). For HPLC analysis, C18 column (Supelco ODS, 250 × 4.6 mm, 5 µm particle size) was used. Drug was eluted with mobile phase (water:acetonitrile – 60:40 and 0.1% TEA, pH 3.0 adjusted with orthophosphoric acid) at flow rate of 0.7 ml/min. Detection was performed using RF-20 A Prominence Fluorescence detector (Shimadzu) at an excitation wavelength of 480 nm and emission wavelength of 560 nm. Area under curve was measured to determine the drug content. Entrapment efficiency and drug loading were determined using Equations (Equation1)(1) and Equation(2
(2) ):
(1)
(2)
Evaluation of transferrin conjugation
Ellman’s test
Ellman’s test (Ellman, Citation1959) was performed to estimate the degree of transferrin thiolation. Ellman’s reagent was prepared by dissolving 4.0 mg of Ellman’s reagent in 1.0 ml reaction buffer (0.1 M sodium phosphate buffer, 1.0 mM EDTA, pH = 8.0). A 2.5 ml reaction buffer and 50 μl Ellman’s reagent were taken in a test-tube and 250 μl transferrin sample was added (for blank, 250 μl reaction buffer was added) to the above-mentioned test-tube. The solutions were incubated at 20 °C for 15 min and absorbance was measured at 412 nm using UV–Vis spectrophotometer. Molar concentration of –SH groups in sample was estimated by the ratio of absorbance and molar extinction coefficient of thiols (14 150 M−1cm−1).
SDS-PAGE
SDS-PAGE was performed for the estimation of transferrin attached to liposomal surface. It was performed according to the Sambrook protocol (Sambrook & Russell, Citation2006). SDS-PAGE electrophoresis chamber (Genaxy Scientific Pvt. Ltd., Delhi, India) was used conferring to manufacturer’s specifications and separation was done on 5% stacking gel and 10% resolving gel. Samples were mixed with loading buffer (100 mM Tris-Cl pH = 6.8, 4% w/v SDS, 0.2% w/v bromophenol blue, 20% v/v glycerol, 200 mM β-mercaptoethanol) and heated at 95 °C for 5 min and then loaded in wells. Electrophoresis was performed in 1 × running buffer at 100 V till tracker dye front was ∼1 cm above end of glass plates. The bands were visualized after staining with commassie Brilliant BlueR-250 under GelDoc™ XR+ Imaging System (BioRad, Berkeley, CA).
Transferrin conjugation assay
This study was performed to quantify fraction of transferrin conjugated to liposomal surface using method described by Lowry et al. (Lowry et al., Citation1951). 0.5 ml of the sample was mixed with 0.7 ml Lowry solution [Solution A (2% Na2CO3 in 0.1 N NaOH) + Solution B (1% Sodium potassium tartrate in H2O) + Solution C (0.5% CuSO4.5H2O in H2O) in ratio of (v:v) of 100:1:1] and incubated at room temperature for 15 min in dark. After incubation, sample was treated with 0.1 ml Folin reagent (diluted 1:1 v/v with water) and again incubated for 30 min in dark. Later, the samples were analyzed at 660 nm using UV–Visible spectrometer. Transferrin conjugation was calculated using calibration curve prepared using BSA as standard.
In vitro characterization
Drug release study
The formulation, equivalent to 3 mg drug, was filled in the dialysis bag (molecular weight cutoff 12 000–14 000 and pore size 2.4 nm) and test was performed for 24 h with continuous stirring using 50% human plasma to evaluate liposomal stability in blood circulation and using phosphate buffer of pH values 5.5, 6.5 and 7.5 to mimic drug release inside cancer cells, around cancer cells and in normal tissues and blood, respectively. Percent drug release was determined using HPLC method.
Electrolyte induced flocculation study
Electrolyte-induced flocculation study was done to evaluate steric stability of prepared liposomes (Subramanian & Murthy, Citation2004). In this study, 1 ml of sodium sulphate solution, prepared in 16.7% sucrose solution, was added to 1 ml appropriately diluted liposomal formulation to obtain final lipid concentration of 1 mg/ml and sodium sulfate concentration of 0.4, 0.8, 1.2, 1.6 and 2.0 M. Absorbance of resultant dispersions was measured at 400 nm on UV–Visible spectrophotometer.
Serum stability study
In this test, 1 ml FBS and 1 ml appropriately diluted blank formulation (distilled water was used as control) were mixed to obtain 50% v/v serum concentration and 1 mM lipid concentration. After incubation at 37 °C for 1 h, the dispersions were analyzed for aggregation by estimating transmittance at 450 nm using UV–Visible Spectrometry. The transmittance of the control sample was considered 100%.
Hemolysis study
Hemolytic potential was determined to check compatibility of different formulations with red blood cells and thereby estimate its safety when used as a carrier for anthracycline drugs. Briefly, blood sample was collected from Wistar rats in heparinized microcentrifuge tubes by retro-orbital sinus puncture. It was centrifuged at 3000 rpm for 5 min and settled erythrocyte pellet was re-dispersed in normal saline to achieve 2% erythrocyte dispersion. Subsequently, 1 ml of 2% erythrocyte dispersion was mixed with 1 ml test samples such that final concentration obtained was from 1 to 1000 nM on lipid basis which was incubated for 1 h at 37 °C. It was centrifuged at 3000 rpm for 5 min and supernatant was estimated for free hemoglobin content by determining absorbance at 545 nm using UV–Visible spectrometry. Also, equivalent free drug concentration for each lipid concentration was used to determine hemolytic potential of free drug, and positive and negative controls were taken by the treatment of RBCs with 1% Triton X-100 and normal saline, respectively. The hemolysis rate was containing 5% CO2 in Jouan IGO150 following equation.
(3)
In addition, solutions obtained by incubating 2% erythrocyte dispersion with formulations equivalent to 1000 nM on lipid basis were observed under microscope (Nikon, Japan) for heme-aggregation study using normal saline treatment as negative control.
Cell-line studies
Cell culture
MCF-7, breast cancer cell line, was maintained in Eagle’s-MEM containing non-essential amino acids. The media was supplemented with 10% FBS and 1% antibiotic solution. Cell line was incubated at 37 °C in humidified atmosphere containing 5% CO2 in Jouan IGO150 incubator (Thermo-Fischer, Waltham, MA). Media was changed every 2–3 days and sub-culturing was done when cell confluency was more than 70–80%.
Cell cytotoxicity study
Tissue culture flasks containing MCF-7 cells were trypsinized and cell suspension was suitably diluted to fixed volume. The cells were counted using hemocytometer using trypan blue as staining dye. Successively, cells were seeded in 96-well plate at density 5 × 10³ cells/well and incubated for 24 h. After incubation, cells were treated separately with drug, drug-loaded liposomes and targeted liposomes at concentration of 0.003, 0.006, 0.03, 0.06, 0.12, 0.3, 0.6, 3, 6 and 30 µg/ml in MEM medium containing 10% FBS and antibiotics. The cells were also treated with blank liposomes which served as a control. The cells along with formulations were further incubated for 24 h. Following that 20 μl of 5 mg/ml MTT solution was added to each well and again incubated for 4 h. Subsequently, culture medium was removed and replaced with 200 µl of DMSO. The reduction of viable cells was determined by colorimetry at 570 nm using ELISA plate reader (Biorad, Berkeley, CA). Cell viability of each group was expressed as relative percentage to that of control cells. IC50 values were calculated using Graphpad Prism software version 6.0 (Graphpad Software Inc., La Jolla, CA).
Cell uptake study
For cellular uptake study, liposomes and targeted liposomes containing rhodamine-B dye and free rhodamine-B dye were used. Cellular internalization in MCF-7 cells was monitored by confocal microscopy. The cells were seeded onto 6-well plates at a density of 2 × 10⁴ cells/well with a glass cover slip at bottom. After 24 h, cells were transfected with rhodamine-B-loaded formulations at final concentration of 50 nM. After 6 h incubation, cells were washed thrice with PBS and fixed by treating with 4% ice cold paraformaldehyde solution for 10 min, followed by nuclei staining with 1 μM DAPI for 10 min. Cover slips were mounted on slides after washing thrice with PBS and observed using confocal laser scanning microscope (LSM 710, Carl-Zeiss Inc., San Diego, CA).
In vivo studies
All in vivo animal studies were approved by Institutional Animal Ethics Committee and animal care was observed as per the guidelines of OECD and Institutional Animal Ethics Committee.
Acute toxicity study
LD50 of all formulations was estimated by fixed dose procedure for the determination of acute toxicity according to OECD guidelines (OECD Guidelines, Citation2008). In this procedure, healthy young Swiss Albino mice were divided into three groups (3 mice per group) each for Epirubicin-HCl solution, Epirubicin-HCl liposomes and targeted Epirubicin-HCl liposomes. Animals were fasted 24 h prior to dosing and weighed. Respective formulations were administered intravenously through tail vein at dose of 15 mg/kg. Animals were observed for signs of morbidity, mortality or other toxic effects. If animals survived then higher dose was administered. Dose escalation was planned in sequence of 15, 30, 60 and 90 mg equivalent Epirubicin-HCl per kg weight. The dose when two or more animals of three animals of same group died was considered as LD50 of formulation.
Pharmacokinetic study
Wistar rats were used for pharmacokinetic study of Epirubicin-HCl formulations. Rats were divided into three groups (3 rats per group) and treated with Epirubicin-HCl solution (1 mg/ml), non-targeted and targeted Epirubicin-HCl liposomes at a dose of 5 mg/kg by intravenous administration. After administration, blood was collected by retro-orbital sinus puncture at 0, 0.5, 1, 2, 4, 8, 12, 24 and 48 h and collected blood was centrifuged at 3000 rpm for 12 min at 4 °C using Remi Centrifuge (Remi equipments Pvt. Ltd., Mumbai, India) to separate plasma. The plasma was stored at −20 °C until assayed. The drug was extracted using acetonitrile and centrifuged at 4000 rpm for 10 min. A 20 µl supernatant was injected in HPLC and analysis was performed as mentioned in the “Entrapment efficiency and drug loading” section. Pharmacokinetic parameters were obtained using Kinetica software (Thermo Fisher Scientific Inc., Waltham, MA).
Myocardial tissue injury test
Wistar rats used for this test were divided into three groups (6 animals per group). Each group was treated with Epirubicin-HCl solution, non-targeted and targeted liposomes, respectively, at a dose of 5 mg/kg on alternate days for 6 days. Saline-treated rats were used as a control treatment. On sixth day blood was collected by retro-orbital sinus puncture. Rats were sacrificed and heart was removed and stored at −20 °C. Blood was centrifuged at 3000 rpm for 12 min to separate the plasma which was used to estimate cardiac markers (LDH and CK-MB) using their respective enzyme detection kits (Reckon Diagnostic Pvt. Ltd., Vadodara, India).
2,3,5-Triphenyl tetrazolium chloride (TTC) test of heart tissue was performed to determine infarct size. For this, frozen heart was cut transversely across left ventricle to get slices of not more than 0.2 cm in thickness and placed in a covered darkened petri dish filled with pre-warmed 1% TTC solution in phosphate buffer. After incubating for 30–45 min at 37 °C, heart slices were immersed in 10% formalin solution which enhanced the color contrast developed. The area of heart section showing infarction was measured using Image-J Software (Bethesda, MD) and percent area was derived.
Stability study
Samples of liposomal preparation were stored in airtight vials in refrigerator and at room temperature. Liposomes were analyzed for change in the particle size and drug entrapment efficiency at the interval of 1 month up to 3 months. Initial drug entrapment after the separation of free drug was considered 100% and entrapment efficiency at each sampling point was reported relative to initial value.
Statistical analysis
All experiments were performed in triplicate unless otherwise specified and data are represented as mean ± standard deviation (SD). Statistical analyses were performed by ANOVA using Graphpad Prism 6.0. Statistically significant difference was considered at p < 0.05.
Results
Preparation and characterization of liposomes
Thin film hydration technique is widely used for the preparation of liposomes (Saffari et al., Citation2013). However, being difficult to scale up this method was not used, hence ethanol injection method was employed. In order to enhance entrapment efficiency, liposomes were formulated by active loading technique. HSPC was used as bilayer forming lipid along with cholesterol providing rigidity. mPEG2000–DSPE was incorporated for PEGylation which would further improve pharmacokinetic profile of formulation. The use of negatively charged lipid (DSPG) in optimized formulation is rationalized as it leads to improved entrapment efficiency by increasing the entrapped volume (Rathod & Deshpande, Citation2010). Various parameters like ammonium sulfate concentration, loading time, loading temperature, etc., were optimized to maximize drug loading in the liposomes. Optimum results were obtained at 250 mM ammonium sulfate concentration and 2 h loading time at 65 °C. Encapsulation efficiency obtained was 83.03 ± 1.56% with drug loading of 0.206:1 in molar ratio which is ∼1.25 mg drug per ml. The formulated liposomes were conjugated with transferrin using DSPE–PEG2000–Maleimide as linker lipid. Conjugation of transferrin to liposomes had negligible effect on encapsulation efficiency and drug loading of liposomes, as conjugation process was performed after complete formation of liposomes.
Size, polydispersity and zeta potential of both non-targeted and targeted liposomes are described in . Formulated non-targeted liposomes had a mean diameter of about 88.6 nm. The mean diameter of targeted liposomes increased to about 133.2 nm, which might be due to coupling of transferrin. Polydispersity indices of both liposomes indicated uniform size distribution of liposomal formulation. Zeta potential values of both liposomal formulations were between −15 and −25 mV which avoids possibility of aggregation.
Table 1. Size, polydispersity and zeta potential of non-targeted and targeted liposomes.
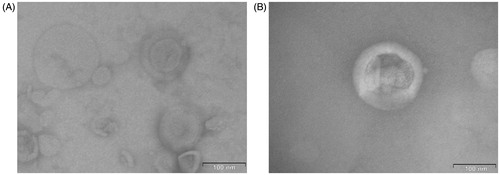
The morphology and lamellarity of liposomes was observed using TEM micrographs which are shown in . All liposomes were found to be spherical and unilamellar and results of size were concordant with results obtained using Brookhaven size analyzer.
Figure 1. TEM images of (A) non-targeted and (B) targeted Epirubicin-HCl liposomes.
Tests for confirmation of transferrin conjugation
As such, transferrin cannot be conjugated with liposomes, so it was first modified using Traut’s reagent to convert transferrin to thiolated transferrin. This resulted in the formation of free thiol group to conjugate with Maleimide groups of DSPE–PEG2000–Maleimide. Thus, Ellman’s test was performed to check degree of thiolation of transferrin. The results showed about 71.24% conversion of transferrin to thiolated form.
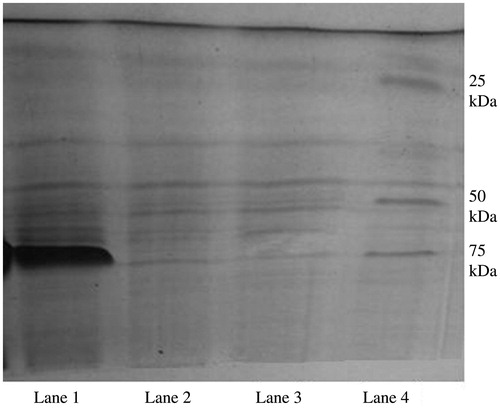
The qualitative and quantitative estimation of transferrin conjugation was done by SDS-PAGE and transferrin conjugation assay, respectively. SDS-PAGE result is depicted in . In SDS-PAGE image, liposomal preparations (lane 2 and 3) gave band at 75 kDa (determined by the use of Precision plus unstained marker in lane 4, which gave three bands at 25, 50 and 75 kDa), which is approximately the molecular weight of transferrin. In addition, band of purified transferrin (lane 1) was obtained at the same position as compared to liposomal formulation lane, and thus it was confirmed that transferrin was attached to liposomes.
Figure 2. SDS-PAGE analysis of transferrin-conjugated liposomes.
The amount of transferrin conjugated to liposomal surface was determined by the transferrin conjugation assay. The calibration curve prepared using BSA was linear with the regression coefficient of 0.9983 and regression equation Y = 0.0041x – 0.1326 in the concentration range of 10–50 ppm. The conjugation of transferrin occurred only after its thiolation, thus thiolated transferrin was conjugated to liposomal surface with high conjugation efficiency of 62.1%.
Drug release study
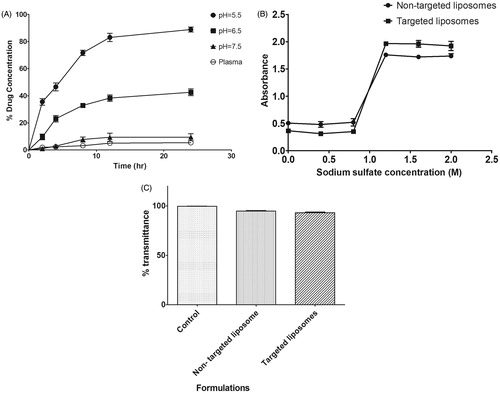
The results for drug release study at various conditions were plotted as % drug released against time and the graph obtained is presented in . It can be seen that maximum drug release occurred at pH = 5.5 (pH of endolysosomal compartment), which was approximately 88.9 ± 1.86% after 24 h. The drug release after 24 h was 42.6 ± 2.56, 9.47 ± 2.58 and 5.4 ± 0.84% at pH = 6.5, 7.5 and in plasma, respectively.
Figure 3. (A) Drug release study of liposomal formulation at pH 5.5, pH 6.5, pH 7.5 and in plasma; (B) plot of absorbance versus sodium sulfate concentration demonstrating electrolyte induced flocculation of the non-targeted and targeted liposomes; (C) serum stability study of formulated liposomes.
Electrolyte induced flocculation study
The effect of increasing sodium sulfate concentration on flocculation stability of liposomal formulations, as depicted by change in absorbance at 400 nm, is demonstrated in . Distilled water was used as a control which contained only liposomal preparation. On increasing sodium sulfate concentration, there was no change in absorbance of liposomal formulations till 1 M Na2SO4. Further increase in sodium sulfate concentration lead to upsurge in the absorbance of liposomal formulation which was possibly due to aggregation of liposomes, as steric barrier of PEG was disrupted by electrolytes (Subramanian & Murthy, Citation2004). This concluded that both formulations were stable up to 1 M Na2SO4.
Serum stability study
depicts % transmittance values obtained with different formulations at 450 nm after their incubation with 50% FBS for 1 h. The transmittance value obtained for non-targeted liposomes was 94.75 ± 0.63% and that for targeted liposomes was 93.22 ± 0.57%. These results showed negligible rise in turbidity with liposomal formulations which ascertained that both liposomal formulations were stable in serum resisting aggregation and size increase.
Hemolysis study
Hemolytic potential of different formulations was evaluated over concentration range of 1–1000 nM of lipid and are represented in . There was continuous increase in hemolytic potential of free drug as concentration increased. From results it was concluded that blank liposomes were negligibly toxic as hemolysis rate was only about 4.64 ± 0.49% at highest concentration. The drug had its own hemolytic potential which was also reported in previous studies (van der Heijden et al., Citation1998), i.e. at highest concentration, hemolytic rate was about 23.08 ± 0.62%. Encapsulation of drug inside liposomes led to marked reduction of its hemolytic potential (i.e. at highest concentration hemolytic potential for non-targeted liposomes was about 4.96 ± 0.28% and that for targeted liposomes was about 4.78 ± 0.41%).
Figure 4. (A) Relative haemolytic potentials of different formulations; (B) heme compatibility study representing the image of RBCs after their incubation with respective formulation for 1 hr.
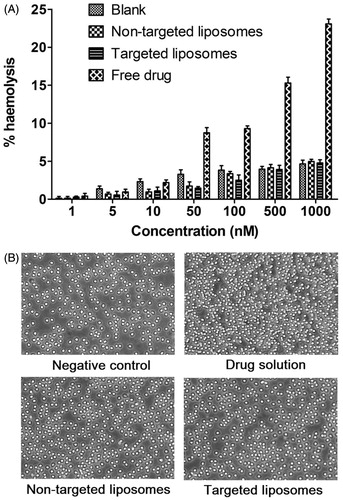
Heme aggregation study was also performed and results are depicted in . From results it was concluded that drug being hemolytic resulted in RBC aggregation and hemolysis to certain extent, while liposomes did not show any of the above-mentioned effects. Thus, safety of liposomal carrier was confirmed and also by encapsulating anthracycline drugs inside liposomal carrier, toxicity of drug could be reduced to considerable extent.
Cell cytotoxicity study
Cytotoxicity of all formulations on MCF-7 cells was determined using MTT assay. shows graph of % cell viability versus concentration of different formulations. Drug concentration which caused inhibition of 50% of MCF-7 cells (IC50) for different formulations was calculated using cell viability curves. IC50 values of free drug, non-targeted liposomes and targeted liposomes for MCF-7 cells were 0.675, 0.532 and 0.192 µg/ml, respectively. IC50 value of targeted liposomes was considerably lower than that of non-targeted liposomes. The sequence in which different formulations were effective based on their IC50 values was: targeted liposomes > non-targeted liposomes > free drug.
Figure 5. (A) Relative cell viability of free drug, non-targeted and targeted liposomal formulations; (B) cell uptake study of different formulations-free rhodamine; non-targeted liposomal formulation and targeted liposomes.
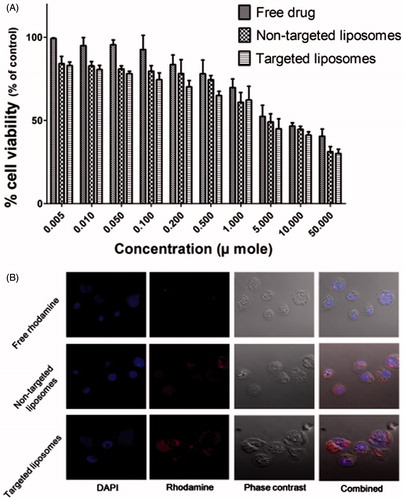
Cell uptake study
Cellular uptake and distribution of different rhodamine-B formulations was examined by confocal microscopy using MCF-7 cells. The results, as depicted in , showed highest fluorescent intensity inside cells for targeted liposomes as compared to non-targeted liposomes while least fluorescent intensity was achieved for free rhodamine-B after 6 h incubation.
Acute toxicity study
LD50 was determined by observing signs of morbidity and mortality in mice after administration of different formulations. LD50 of free drug was about 30 mg/kg which was concordant to previously reported LD50 (31.5 mg/kg) in mice via i.v. route (Epirubicin Hydrochloride Injection, Material Safety Data Sheet, Hospira). LD50 of both liposomal formulations was about 90 mg/kg which was 3-fold higher than that of free drug.
Pharmacokinetics
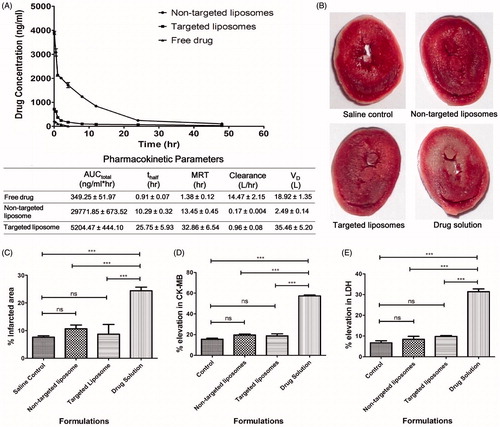
The average plasma concentration versus time profile after i.v. administration of different Epirubicin-HCl formulations at dose of 5 mg/kg and different pharmacokinetic parameters are depicted in . The pharmacokinetics of free drug was characterized with AUCtotal of 349.25 ± 51.97 ng/ml h, thalf of 0.91 ± 0.07 h, plasma clearance of 14.47 ± 2.15 L/h and volume of distribution (VD) of 18.92 ± 1.35 L. Liposomal encapsulation of Epirubicin-HCl significantly altered pharmacokinetic parameters. There was considerable increase in AUCtotal, thalf and MRT while clearance and VD reduced significantly. The surface-conjugated liposomes also showed similar changes but VD increased substantially.
Figure 6. (A) Plasma concentration versus time profile of Epirubicin-HCl after i.v. administration of different formulations along with pharmacokinetic parameters obtained using Kinetica; (B) TTC test for determination of infarct size representing heart section of rats treated with different formulations; (C) effect of Epirubicin-HCl targeted and non-targeted liposomal preparations and drug solution on myocardial infarction compared with saline treated control. (D) Relative rise in CK-MB levels due to treatment with different formulations; (E) relative rise in LDH levels due to treatment with different formulations (***indicates statistically significant difference with p < 0.0001, ns = non-significant).
Myocardial tissue injury study
Epirubicin has one potential drawback of cardiotoxicity (Shan et al., Citation1996), so prepared formulations were evaluated for cardiotoxicity for which two studies were performed: (i) determination of infarcted area and (ii) determination of elevation in cardiac marker levels. Results of TTC test are shown in . The infarcted area was seen as white or pale yellow patch. On integrating infarcted area using Image J software, the percentage infarcted areas for saline control, non-targeted liposomes, targeted liposomes and free drug were 7.625 ± 0.51, 10.67 ± 1.31, 8.69 ± 3.51 and 24.4 ± 1.29%, respectively. Results were analyzed using Graphpad prism software (La Jolla, CA) and shows the analysis of results which depict that there was no significant difference in percent infarction between saline control, non-targeted liposomes and targeted liposomes while there was a significant difference between drug and all other groups (p < 0.001).
The results obtained on estimating cardiac markers levels like CK-MB and LDH in plasma are shown in , respectively. Cardiac markers’ (CK-MB and LDH) levels in saline-treated control rats were considered 100% and relative levels with drug treatment were noted against it. Relative plasma concentrations of CK-MB with non-targeted liposomal formulation, targeted liposomal formulation and free drug were 126.08 ± 6.14, 121.74 ± 12.29 and 369.56 ± 6.14% while that of LDH were 125 ± 14.14, 116 ± 7.07 and 464.9 ± 21.21%, respectively. Elevation of cardiac markers in free drug-treated mice as compared to saline control was statistically significant (p < 0.001) while that in liposomal formulation treated mice was non-significant, demonstrating reduction in the cardiotoxic effect of free drug by liposomal encapsulation.
Stability study
For the evaluation of stability of prepared formulations, ICH guidelines for stability testing was followed [ICH Guideline Q1A(R2), Citation2003]. The parameters evaluated to access the stability of liposomal preparations were particle size and drug content. The results of stability studies are shown in .
Table 2. Change in drug entrapment efficiency and particle size of formulation during stability study.
The liposomal preparation was least affected at storage conditions (5 ± 3 °C) as mean size and drug content in liposomal preparation did not change extensively after 3 months. While liposomal preparation was not stable at room temperature (25 ± 2 °C, 60 ± 5% RH) as formulation got agglomerated within 1 month. Thus, formulations should be stored at cool temperature (2–8 °C).
Discussion
Anthracyclines are considered amid the most effective drugs for breast cancer treatment and are major contributors in adjuvant chemotherapy regimens. Among all anthracyclines, doxorubicin and epirubicin have formed backbone for breast cancer chemotherapy and are widely used in clinical practice (Gianni et al., Citation2009). The major aspect limiting their use is cardiotoxicity (Shan et al., Citation1996). Therefore, the aim of this study was to avoid its cardiotoxic effect by encapsulating inside liposomes. In addition, Epirubicin-HCl must be delivered intracellularly as it shows anticancer activity by intercalating in DNA of cancer cells (Gewirtz, Citation1999). Thus, surface-modified liposomes were prepared by conjugating transferrin which would guide liposomes intracellularly by receptor mediated endocytosis.
Transferrin was conjugated to liposomal surface using DSPE–PEG2000–Maleimide as a linker lipid. HSPC and cholesterol were used as bilayer forming lipids. DSPG was used as it increases drug entrapment and hinders drug leakage through bilayer stabilization (Tari & Huang, Citation1989). Addition of mPEG2000–DSPE in liposomal formulation improved hydrophilicity of liposomal surface, helping liposomes to circumvent RES uptake (Allen et al., Citation1991). Epirubicin-HCl was entrapped inside liposomes employing ammonium sulfate gradient method resulting in encapsulation efficiency of approximately 83%.
The mean vesicle size of liposomes was appropriate for passive targeting of liposomes to tumor cells due to leaky vasculature with pore size of 100–600 nm, resulting in EPR effect (Yuan et al., Citation1995). A narrow polydispersity index for both liposomes indicated uniform liposomal dispersion. Particle size observed using TEM also supplemented the results of dynamic light scattering. In addition, liposomes were spherical in shape with smooth surface. Stability of liposomes against aggregation and coagulation was improved by negative charge on surface by incorporating DSPG in liposomal bilayer, which was further confirmed by measuring zeta potential that came about −20 mV for formulated preparations.
Conversion extent of transferrin to its thiolated form was accessed by Ellman’s test, and it was concluded that appreciable concentration (∼71%) of transferrin was converted to its active thiolated form. Conjugation efficiency of resulting thiolated transferrin was estimated using SDS-PAGE and Lowry’s assay. The results confirmed the presence of transferrin on liposomal surface, and also conjugation efficiency obtained was approximately 62%.
In vitro testing was done to evaluate various formulation parameters which included electrolyte flocculation study, hemolysis study, serum stability and drug release study. Drug release study was carried out to estimate the drug release site. This study showed that drug would get released only below pH 6.5, which can be found in tumor tissue or in endosome intracellularly. Data obtained from drug release study supplemented stability of formulation at physiological conditions. Electro-flocculation study suggested that inclusion of PEG in liposomal bilayer created steric barrier on liposomal surface which inhibited flocculation induced by electrolytes. The results depicted the stability of prepared formulation in the presence of electrolyte (up to 1 M). Hemolysis study demonstrated compatibility of formulations with red blood cells, and thus depicted whether prepared formulation was suitable and non-toxic for systemic administration. Cytotoxicity of formulations was evaluated along with biocompatibility providing additional information regarding safety profile. Formulation with hemolysis extent of less than 5% is considered non-toxic having only negligible hemolytic reactions (Risbud et al., Citation2001). Developed blank liposomes were considered safe and biocompatible as it had hemolysis rate <5% at a concentration of about 1 mM concentration. The low hemolytic potential of blank carriers can be justified by low surface activity due to steric hindrance caused by mPEG2000-DSPE added in formulation (Wang et al., Citation2010). Hemolysis potential of drug-loaded formulations was comparable with blank liposomes, which confirmed that both liposomal preparations were useful to circumvent hemolytic potential of free drug as drug itself was found to be hemolytic. The results of heme aggregation study supplemented the results of hemolysis study. Serum stability studies confirmed the stability of prepared formulations in vivo. The formulations did not show any aggregation or coagulation when injected systemically and shows appreciable stability during circulation.
In vitro cell line studies were done to estimate cell uptake and cytotoxicity of prepared formulation and also to determine the efficacy of transferrin-conjugated liposomes over non-conjugated liposomes. Use of MCF-7 cell line was justified as overexpression of transferrin receptors is reported (Habashy et al., Citation2010). Transferrin-conjugated liposomes were able to significantly improve the intracellular uptake of entrapped drug, and thus efficiently target the MCF-7 tumor cells when compared with non-conjugated liposomes and free drug as apparent from confocal laser scanning microscopy due to increased uptake by receptor mediated endocytosis. In addition, transferrin-conjugated formulation showed highest cytotoxicity to MCF-7 cells which was established from IC50 values obtained on performing MTT assay. Thus, it was confirmed that targeted formulations enhance cytotoxicity of anti-cancer drug as reported in previous reports (Jinturkar et al., Citation2012).
In vivo acute toxicity study demonstrated the significance of liposomal carrier when used for anthracycline drugs. Liposomal carrier was shown to reduce the toxicity of free drug approximately three times. In addition, liposomal encapsulation reduced cardiotoxic potential of drug providing a better alternative for the administration of anthracycline drugs. Reduction in cardio-toxic potential was evaluated in Wistar rats by measuring plasma CK-MB and LDH levels and measuring the infarct size in the heart of treated and control rats using TTC test. Both tests confirmed negligible cardiotoxicity of liposomal preparations as compared to free drug. Thus, limiting factor of anthracyclines, i.e. cardiotoxicity can be overcome by encapsulating drug in liposomes.
In vivo pharmacokinetic study established improvement of plasma profile of Epirubicin-HCl by encapsulating inside liposomes. This approach enhanced circulation time by reducing RES uptake due to the presence of PEG and DSPG which indicates that liposome delivery has upper edge over free drug administration. Enhanced circulation time will in-turn provide increased drug concentration in cancerous tissues by EPR effect (Maeda et al., Citation2001; Torchilin, Citation2011). In addition, targeted liposomes showed lesser AUCtotal than that of non-targeted liposomes, which may be ascribed to its higher volume of distribution and rapid clearance from the systemic circulation as compared to non-targeted liposomes. The higher volume of distribution for the targeted liposomes may be justified by its distribution and accumulation in transferrin receptor expressing peripheral blood mononuclear cells, erythroid cells, endocrine pancreas, seminiferous tubules, cells of pituitary, luminal membranes of the breast, hepatocytes, Kupffer cells of liver and tubules of kidney etc. (Gatter et al., Citation1983) when injected in healthy animal. However, when the targeted formulation is administered in breast cancer patients, the formulation would preferentially accumulate in cancer cells as there is 4–5-fold overexpression of transferrin receptors in malignant breast cells when compared to non-neoplastic breast cells (Tonik et al., Citation1986; Walker & Day, Citation1986).
Finally, formulation was evaluated for stability by performing stability studies at both room temperature and 2–8 °C. There was negligible change in the particle size and drug content of the liposomal formulation after 3 months at 2–8 °C. Thus, it was proved that liposomal preparation was stable at 2–8 °C for 3 months.
Conclusion
In conclusion, it can be stated that prepared liposomal formulations of Epirubicin-HCl had high drug-loading, better physical and biological stabilities, good drug release profile, higher efficacy and low toxicity as compared to Epirubicin-HCl solution. In addition, cardiotoxicity, the major limiting factor for clinical application of Epirubicin-HCl, was reduced by prepared formulation. Furthermore, targeted liposomes with transferrin as a ligand can be used to enhance the intracellular delivery of Epirubicin-HCl, so it can be used to provide an upper edge for breast cancer therapy. This system shows great promise as a drug delivery system for clinical use.
Acknowledgements
Authors would like to acknowledge TIFAC-CORE for providing research facilities and Dr. Vikram Sarabhai Science Block, The M.S. University of Baroda, for providing facilities for cell uptake studies.
Declaration of interest
Authors report no conflict of interests and are responsible for the content of the paper.
References
- Allen TM, Hansen C, Martin F, et al. (1991). Liposomes containing synthetic lipid derivatives of poly(ethylene glycol) show prolonged circulation half-lives in vivo. Biochim Biophys Acta 1066:29–36
- Ellman GL. (1959). Tissue sulfhydryl groups. Arch Biochem Biophys 82:70–7
- Gatter KC, Brown G, Trowbridge IS, et al. (1983). Transferrin receptors in human tissues: their distribution and possible clinical relevance. J Clin Pathol 36:539–45
- Gewirtz DA. (1999). A critical evaluation of the mechanisms of action proposed for the antitumor effects of the anthracycline antibiotics adriamycin and daunorubicin. Biochem Pharmacol 57:727–41
- Gianni L, Norton L, Wolmark N, et al. (2009). Role of anthracyclines in the treatment of early breast cancer. J Clin Oncol 27:4798–808
- Gijsens A, Derycke A, Missiaen L, et al. (2002). Targeting of the photocytotoxic compound AlPcS4 to Hela cells by transferrin conjugated PEG-liposomes. Int J Cancer 101:78–85
- Habashy HO, Powe DG, Staka CM, et al. (2010). Transferrin receptor (CD71) is a marker of poor prognosis in breast cancer and can predict response to tamoxifen. Breast Cancer Res Treat 119:283–93
- Harvie P, Wong FM, Bally MB. (2000). Use of poly(ethylene glycol)-lipid conjugates to regulate the surface attributes and transfection activity of lipid-DNA particles. J Pharm Sci 89:652–63
- Henderson IC. (1991). Chemotherapy for metastatic disease. In: Harris JR, Hellman S, Henderson IC, eds. Breast diseases. 2nd ed. Philadelphia (PA): Lippincott, 604–65
- ICH Guideline Q1A(R2). (2003). Guidance for industry – stability testing of new drug substances and products. Geneva: ICH
- Jinturkar KA, Anish C, Kumar MK, et al. (2012). Liposomal formulations of Etoposide and Docetaxel for p53 mediated enhanced cytotoxicity in lung cancer cell lines. Biomaterials 33:2492–507
- Khatri N, Rathi M, Baradia D, Misra A. (2014). cRGD Grafted siRNA nano-constructs for chemosensitization of gemcitabine hydrochloride in lung cancer treatment. Pharm Res. Early online: 1–13. doi: 10.1007/s11095-014-1351-1
- Kolate A, Baradia D, Patil S, et al. (2014). PEG – a versatile conjugating ligand for drugs and drug delivery systems. J Control Release 192C:67–81
- Lowry OH, Rosebrough NJ, Farr AL, Randall RJ. (1951). Protein measurement with the Folin phenol reagent. J Biol Chem 193:265–75
- Maeda H, Sawa T, Konno T. (2001). Mechanism of tumor-targeted delivery of macromolecular drugs, including the EPR effect in solid tumor and clinical overview of the prototype polymeric drug SMANCS. J Control Release 74:47–61
- OECD Guideline for Testing of Chemicals. (2008). OECD Test Guideline 420: acute oral toxicity-fixed dose procedure: OECD Publishing, Organization for Economic Co-operation and Development. Paris, France: OECD
- Rathod S, Deshpande SG. (2010). Design and evaluation of liposomal formulation of pilocarpine nitrate. Indian J Pharm Sci 72:155–60
- Risbud M, Saheb DN, Jog J, Bhonde R. (2001). Preparation, characterization and in vitro biocompatibility evaluation of poly(butylene terephthalate)/wollastonite composites. Biomaterials 22:1591–7
- Ryberg M, Nielsen D, Cortese G, et al. (2008). New insight into epirubicin cardiac toxicity: competing risks analysis of 1097 breast cancer patients. J Natl Cancer Inst 100:1058–67
- Saffari M, Shirazi HF, Oghabian MA, Moghimi HR. (2013). Preparation and in-vitro evaluation of an antisense-containing cationic liposome against non-small cell lung cancer: a comparative preparation study. Iran J Pharm Res 12:3–10
- Sambrook J, Russell DW. (2006). SDS-polyacrylamide gel electrophoresis of proteins. CSH Protoc 2006 (4). pii: pdb.prot4540. doi: 10.1101/pdb.prot4540
- Shan K, Lincoff AM, Young JB. (1996). Anthracycline-induced cardiotoxicity. Ann Intern Med 125:47–58
- Subramanian N, Murthy RS. (2004). Use of electrolyte induced flocculation technique for an in vitro steric stability study of steric stabilized liposome formulations. Pharmazie 59:74–6
- Tari A, Huang L. (1989). Structure and function relationship of phosphatidylglycerol in the stabilization of phosphatidylethanolamine bilayer. Biochemistry 28:7708–12
- Tonik SE, Shindelman JE, Sussman HH. (1986). Transferrin receptor is inversely correlated with estrogen receptor in breast cancer. Breast Cancer Res Treat 7:71–6
- Torchilin V. (2011). Tumor delivery of macromolecular drugs based on the EPR effect. Adv Drug Deliv Rev 63:131–5
- Van Der Heijden M, Ackland SP, Deveridge S. (1998). Haemolytic uraemic syndrome associated with bleomycin, epirubicin and cisplatin chemotherapy – a case report and review of the literature. Acta Oncol 37:107–9
- Walker RA, Day SJ. (1986). Transferrin receptor expression in non-malignant and malignant human breast tissue. J Pathol 148:217–24
- Wang W, Xiong W, Zhu Y, et al. (2010). Protective effect of PEGylation against poly(amidoamine) dendrimer-induced hemolysis of human red blood cells. J Biomed Mater Res B Appl Biomater 93:59–64
- Winer EP, Morrow M, Osborne CK. (2001). Malignant tumors of the breast. In: Devita VT, Hellman S, Rosenberg RA, eds. Cancer: principles and practice of oncology. Philadelphia, PA: Lippincott Williams & Wilkins, 1651–717
- Yuan F, Dellian M, Fukumura D, et al. (1995). Vascular permeability in a human tumor xenograft: molecular size dependence and cutoff size. Cancer Res 55:3752–6