
Abstract
Triptolide (TP) shows strong anti-tumor activities on various cancer cells, especially on pancreatic cancer. TP inhibits HSP70 expression leading to cell death in pancreatic cancer cells and induces cell death by apoptotic and autophagic pathways. In order to increase the therapeutic index of TP, a novel intravenous TP-loaded delivery system, TP-loaded lipid emulsion (TP-LE), has been developed to treat solid tumor. In the present study, the preparation and characterization of TP-LE were described. The pharmacokinetics and tissue distribution study of TP-LE in mice were also evaluated. Results demonstrated that TP-LE had an average particle size of 154.6 nm, entrapment efficiency (EE%) of 87%, zeta potential of −0.903 mV and autoclaved stability. The pharmacokinetic study showed that blood concentrations of both TP-LE and TP reached a maximum at the end of intravenous administration (1.25 mg/kg) and declined rapidly within the first 10 min with a mean residence time (MRT) of about 10 min. In the tissue distribution study, a preferential accumulation and longer residence time of drug in pancreas were found in TP-LE. The AUC0–60min of TP-LE in pancreas was 2.19 times in comparison to free TP, suggesting that the use of TP-LE conferred improvements in biodistribution, accumulation and therapeutic efficacy in pancreas. Moreover, the concentrations of TP-LE in heart, lung and kidney were lower than that of the TP group, indicating the potential for reduced toxicity of TP-LE. Together, all the results show that TP-LE appears to be a promising formulation for using TP in treating cancer, and more specifically pancreatic cancer.
Introduction
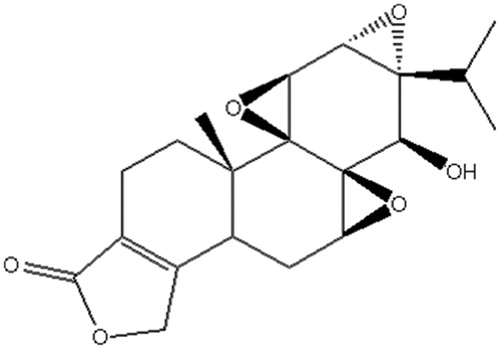
Triptolide (TP), a diterpenoid triepoxide, whose chemical structure is shown in , was first extracted from Tripterygium wilfordii Hook F and characterized in 1972 (Kupchan et al., Citation1972). TP has been used for centuries in traditional Chinese medicine for its multiple pharmacological activities, such as anti-inflammatory, immuno-suppressive, male anti-fertility and anti-tumor activity (Chen, Citation2001; Brinker et al., Citation2007; Li et al., Citation2014). Traditional Chinese medicine has a large advantage in many clinical disease treatments, especially in cancer (Xu et al., Citation2014). Recently, anti-tumor activity of TP has received great attention due to its broad anti-tumor spectrum and potent anti-tumor activity. Some reports indicated that TP can not only inhibit the proliferation of many different types of cancer cells in vitro, but also inhibit the growth and metastasis of solid tumors in vivo, including prostatic cancer, lung cancer, breast cancer, colon cancer and pancreatic cancer. Moreover, it can enhance the anti-tumor effects of cytotoxic agents and chemotherapeutic agents (Lee et al., Citation1999; Chang et al., Citation2000; Chan et al., Citation2001; Yang et al., Citation2003; Wang et al., Citation2009; Liu, Citation2011; Chugh et al., Citation2012).
Figure 1. Structure of triptolide.
Pancreatic cancer is one of the most lethal human malignancies with an all-stage 5-year survival frequency of <5%, and conventional cancer treatments have little impact on the disease course. Furthermore, pancreatic cancer responds poorly to most chemotherapeutic agents (Li et al., Citation2004; Vincent et al., Citation2011; Chugh et al., Citation2012). The current first-line chemotherapeutic agent of choice for pancreatic cancer is gemcitabine, which was approved by the US Food and Drug Administration (FDA) in 1996: gemcitabine confers a median survival advantage of only 6 months, an improvement of only 1 month over its predecessor [5-fluorouracil (5-FU)]. What is exciting is that some literature has reported that TP is effective against pancreatic cancer cells in vitro as well as in vivo (Chugh et al., Citation2012). TP inhibits HSP70 expression leading to cell death in pancreatic cancer cells, as well as growth and loco-regional spread of pancreatic tumors in vivo. Additionally, TP induces cell death in pancreatic cancer cells by apoptotic and autophagic pathways (Phillips et al., Citation2007; Mujumdar et al., Citation2010). TP is considered to hold great promise as a new chemotherapeutic agent. However, the clinical use of TP is restricted to its poor solubility in water and toxic effects toward gastrointestinal, renal, hematopoietic and reproductive systems (Shamon et al., Citation1997; Sun et al., Citation2001).
Recently, alternative approaches have been investigated to load TP into liposomes (Ju, Citation2007), polymeric micelles (Xu et al., Citation2008) and solid lipid nanoparticles (Xue et al., Citation2012). However, most of these approaches have been clinically unsuccessful because of the low EE%, poor physicochemical stability and complicated preparation procedure. Lipid emulsion formed mainly by soybean oil and phospholipids has been found to be safe and excellent drug carriers for antitumor agents due to their high drug loading capacity, suitability for manufacture and stability during long-term storage (Takenaga, Citation1996; Venkateswarlu & Patlolla, Citation2001). Furthermore, literature has reported that regional intra-arterial infusion chemotherapy with solvent of 20% lipid emulsion instead of physiological saline could increase the pancreatic gemcitabine concentration, meanwhile, it could also decrease the serum gemcitabine concentration (Li et al., Citation2009). In another study, the pancreas targeting capability of hydroxycamptothecin was greatly improved, when lipid emulsion was used as drug carrier (Liu et al., Citation2008). Drug-loaded emulsions have also been rapidly developed for their unique properties, low toxicity and reduced local irritation. Simultaneously, lipid emulsions can also enhance the solubilization and stabilization of the incorporated drugs to obtain suited drug release and targeting effect (Floyd, Citation1999; Venkateswarlu & Patlolla, Citation2001; Dan, Citation2005). Therefore, lipid emulsion might be a suitable carrier for i.v. administration of TP.
The objective of the present study was to prepare an intravenous TP-loaded lipid emulsion (TP-LE) with high anti-tumor activity and low toxicity and irritation. The physicochemical characteristics, pharmacokinetics and tissue distribution of TP-LE were evaluated, in comparison with free TP. The long-term goal of this research is to develop an intravenous formulation of TP in treating cancer, and more specifically pancreatic cancer.
Materials and methods
Drugs and reagents
The following materials were purchased from the sources in parentheses: TP (Nanjing Zelang Pharmaceutical Technology Ltd. Co., Nanjing, China), internal standard daidzein (Chinese National Institute for the Control of Pharmaceutical and Biological Products, Beijing, China), long-chain triglycerides (LCT) and medium-chain triglycerides (MCT) (Catic (Tieling) Pharmaceutical Ltd. Co., Tieling, China), soybean phospholipid (Shanghai Advanced Vehicle Technology Ltd. Co., Shanghai, China), Poloxamer 188 (Kolliphor® P 188) (BASF AG, Ludwigshafen, Germany), oleic acid (Tianjin Fuyu Chemical Ltd. Co., Tianjin, China), glycerol, propylene glycol, EDTA and ethyl acetate (Tianjin Bodi Chemical Ltd. Co., Tianjin, China), methanol, acetonitrile and dehydrated alcohol (Tianjin Concord Technology Ltd. Co., Tianjin, China). All chemicals and reagents used were of analytical or chromatographic grade.
Experimental animals
The pharmacokinetic evaluation of TP-LE was performed on mice, while the tissue distribution experiment was also carried out in mice. The mice were purchased from the Experimental Animal Center (Shenyang Pharmaceutical University, Shenyang, China). All the animal experiments mentioned above were evaluated and approved by the University Ethics Committee for the use of laboratory animals and in compliance with the Guidelines for the Care and Use of Laboratory Animals.
Preparation of TP-LE
The preparation of the lipid emulsion containing TP was as follows: First, 0.0125% (w/v) TP and 1.8% (w/v) soybean phospholipid were ultrasonically dissolved in a moderate amount of anhydrous ethanol and then added into the oil phase, which was composed of 7.5% (w/v) soybean oil, 2.5% (w/v) MCT and 0.05% (w/v) oleic acid. The oil phase was dispersed at 80 °C in a water bath with stirring and vaporizing anhydrous ethanol until a uniform system was obtained. At the same time, 2.5% (w/v) glycerol, 0.2% (w/v) F68 and 0.05% (w/v) EDTA were dispersed in water with stirring at 80 °C to form the aqueous phase. Subsequently, the coarse emulsion was prepared by adding the aqueous phase to the oil phase with high-speed shear mixing (FJ-200 High-speed Dispersion Homogenizer, Shanghai Specimen Model Factory, Shanghai, China) at 10 000 rpm for 10 min. Then, the pH was adjusted to 6–7 with 0.1 molL−1 NaOH or HCL, and the volume was made up to 100% with double-distilled water. The final emulsion was obtained by high-pressure homogenization using Niro Soavi NS 10012K homogenization (Niro Soavi S.p.A., Via M.da Erba Edoari, 29/A-43100PARMA, Italy), at 800 bar for eight cycles. Finally, the emulsion was sealed in vials after flushing with nitrogen gas and autoclaved at 121 °C for 10 min.
Characterization of TP-LE
Size, zeta potential and morphology
The particle size and the zeta potential of the TP-LE were determined by using a laser particle size analyzer (Mastersizer 2000, Malvern Instruments Ltd., Worcestershire, England). The emulsion sample was diluted 1:500 with double distilled water immediately before the measurement. The morphology of TP-LE was examined by a transmission electron microscope (JEM-1200EX, Jeol, Japan).
Entrapment efficiency (EE%)
The EE% of TP-LE was obtained by measuring the free TP concentration in the dispersed medium. Ultrafiltration was carried out three times using an ultrafiltration centrifuge tube (provided by Beijing Genosys Tech-Trading Ltd. Co., Beijing, China) operated at 4000 rpm, and for 15 min. The ultrafiltration centrifuge tube mainly consists of a filter membrane with a molecular weight cut-off of approximately 10 000 Da. The centrifuged free drug in the aqueous phase and the content of TP in TP-LE were determined by HPLC (Lu et al., Citation2007)
Stability
The long-term stability of TP-LE was carried out with storage at 20–25 °C for about 6 months by using the appearance, EE% and the content of TP in TP-LE as the indexes. The accelerated stability of TP-LE was evaluated for 3 months at 40 °C by the indexes as described above.
Pharmacokinetic study in mice
One hundred and eight SPF-Kunming mice (male and female, 30 ± 2 g) were randomly divided into two groups A and B. Each of them was fasted for 12 h before the experiment, but with free access to water. Two groups were respectively given TP-LE and TP solution intravenously through a tail vein at the dose of 1.25 mg/kg weight. The TP solution was prepared by dissolving TP in 20% propylene glycol aqueous solution. Blood samples were collected in centrifuge tubes by removing eyeball at 2, 5, 7, 10, 20, 30, 40, 50 and 60 min after dosing: six mice for each point-in-time. The samples were centrifuged at 8000 rpm for 10 min to obtain the plasma. The plasma was stored at −20 °C until further analysis.
Tissue distribution study in mice
Forty-eight SPF-Kunming mice (male and female, 30 ± 2 g) were randomly divided into eight groups. Each of them was fasted for 12 h before the experiment, but with free access to water. Four groups were given TP-LE and the other four groups were given TP solution intravenously through a tail vein at the dose of 1.25 mg/kg weight. At 5, 10, 30 and 60 min after drug administration, heart, liver, spleen, lung, kidney, brain and pancreas were removed, rinsed with physiological saline, weighed accurately and stored at −20 °C until further analysis.
Sample preparation
All the samples were determined by HPLC. The tissues were homogenized with physiological saline in the ratio of 1:1 (g/ml) for liver, kidney, lung, brain and 1:2 (g/ml) for heart, spleen, pancreas to get tissue homogenate samples. Plasma or tissue homogenate samples (100 μl) were transferred to a 1.5 ml EP together with 10 μl IS solution (5 μg/ml). After vortex mixing for 30 s, the samples were extracted with 500 μl ethyl acetate using vortex shaking for 3 min, and centrifuged at 12 000 rpm for 10 min. The upper organic layer was transferred to another tube and evaporated to dryness under N2 flow at 60 °C. The residue was reconstituted in 50 μl of mobile phase, vortex mixed for 30 s and centrifuged at 12 000 rpm for 10 min. The supernatant (20 μl) was injected into the HPLC system.
HPLC instrumentation and conditions
The controls and samples were analyzed by a reversed phase high performance liquid chromatography (HPLC). HPLC analysis was performed using a LC-15C pump (Shimadzu, Kyoto, Japan) coupled with a SPD-10A detector (Shimadzu, Japan), and a LC solution Lite (Shimadzu, Japan) chromatography workstation for data analysis. The separation column was Kromasil C18 (4.6 mm × 250 mm, 5 μm) with a guard column. The mobile phase was composed of acetonitrile–water (35:65, v/v), and the flow rate was 1.0 ml/min. The detection wavelength was set at 220 nm. The column temperature was maintained at 25 °C. An aliquot of 20 μl of the purified sample was injected into the HPLC system for analysis.
Standard solutions and quality control samples
The stock solutions were prepared by dissolving 10.0 mg TP and 10.0 mg daidzein (IS) in 10 ml methanol to prepare stock solutions consisting of 1 mg/ml TP and daidzein, respectively. A series of working standard solutions of TP were prepared by diluting the stock solution with methanol in appropriate ratios to yield six concentrations of 10–2000 ng/ml, 50–800 ng/g and 10–400 ng/g for plasma and tissue samples, respectively. The daidzein solution was diluted with methanol to obtain 5 μg/ml as internal standard solution. Calibration standards were prepared by adding working standard solutions and the IS (10 μl, 5 μg/ml) into 100 μl blank plasma or 100 μl different tissue homogenates. Quality control samples (QCs) were prepared separately in the same way. All solutions were stored at 4 °C.
HPLC validation
A thorough and complete method validation for assaying TP in biological matrices was done in accordance with the current guidance of the FDA and the subsequent 2006 Bio-analytical Method Validation Workshop white paper. The method was validated in terms of specificity, linearity, lower limit of quantification (LLOQ), precision, accuracy, recovery and stability.
Specificity
The specificity of the method was evaluated by analyzing the blank plasma, tissue homogenates (heart, liver, spleen, lung, kidney, brain and pancreas) obtained from six sources. Each blank sample was analyzed for exclusion of potential interference within the time range of analysis under the HPLC condition through the extraction procedure.
Linearity and LLOQ
The linearity was obtained by plotting the peak area ratios of TP to the IS versus nominal concentrations of TP and assessed by weighted least-squares linear regression using 1/x2 as weighting factor. The LLOQ was determined as the lowest concentration point of the standard curve (LLOQ, S/N = 10). It was repeated five times for confirmation of precision and accuracy less than 20%.
Precision and accuracy
Accuracy and precision were evaluated in five replicates at three QC levels on the same day and three batches on three consecutive validation days. The precision and accuracy were expressed by relative standard deviation (RSD) and relative error (RE), respectively. The intra- and inter-day precision (RSD) should not exceed 15% and the accuracy (RE) should be within ±15%. The LLOQ can be analyzed quantitatively by an analytical method with a precision no greater than 20% and accuracy within ±20%.
Recovery
The extraction recoveries were determined by comparing the peak area obtained from biological matrices spiked before extraction with those from biological matrices after extraction. The recovery of TP was determined at low, medium and high concentration, while the recovery of the IS was determined at a single concentration of 5 μg/ml.
Stability
The stability was tested by analyzing five replicates of QC samples at three concentration levels exposed to different conditions: at room temperature for 4 h before sample preparation (short-term stability), at room temperature for 12 h in the autosampler after sample preparation (extracted sample stability), at −20 °C in the freezer for 7 days (long-term stability), three freeze-thaw cycles from −20 °C to room temperature (freeze-thaw stability). The stability was deemed acceptable when the assay values were within the limits of accuracy (±15% RE) and precision (15% RSD).
Data analysis
The pharmacokinetic parameters of TP in mice including area under the plasma-concentration versus time curve (AUC), clearance (CL), MRT and terminal elimination half-life (t1/2) were calculated by the DAS2.0 software (Beijing, China). A non-compartmental method was used to calculate pharmacokinetic parameters of TP. All data were expressed as mean ± SD.
Results and discussion
Characterization of TP-LE
The TP-LE showed a uniform milky appearance () and the morphology of TP-LE by transmission electron microscopy (TEM) is shown in . The mean particle size of TP-LE was 154.6 nm (), and the particle size distribution was relatively narrow with the PDI of 0.009. The zeta potential of TP-LE was −0.903 mV (). The pH value was 6.0. The EE% of TP-LE was 87%. The physicochemical stability was evaluated by the appearance, drug EE% and the content of TP in TP-LE, with the results shown in . The results indicated that there was no significant change in appearance, EE% and drug content during the long-term and accelerated tests. It can be concluded that TP-LE was stable at 20–25 °C over for 6 months and 40 °C over for 3 months, respectively.
Figure 2. Appearance of TP-LE.
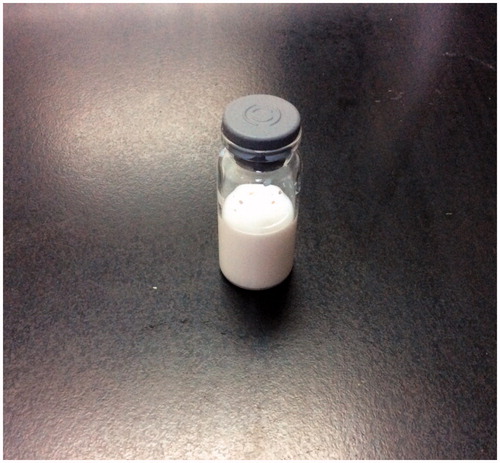
Figure 3. Transmission electron microscopy (TEM) of TP-LE at ×20 000 magnification.
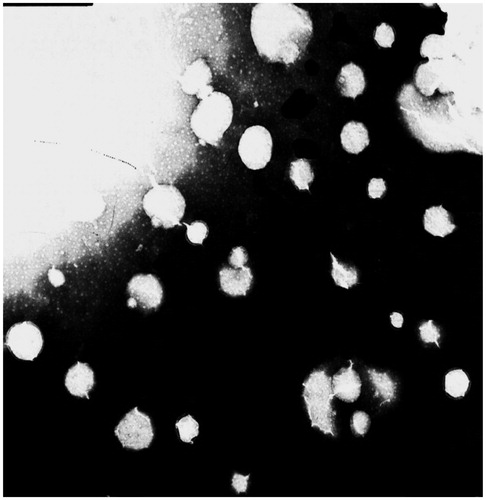
Figure 4. Particle size and distribution of TP-LE.
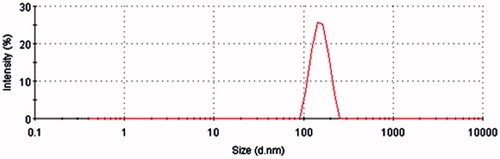
Figure 5. Zeta potential and distribution of TP-LE.
Table 1. Stability data of TP-LE.
Chromatography
Several previous studies have reported some liquid chromatography–tandem mass spectrometry (LC-MS/MS) methods for the determination of TP in biosamples with the LLOQ of 0.5 or 1 ng/ml (Xue et al., Citation2012; Zhuang et al., Citation2013). Compared to the previous studies, the present RP-HPLC detecting system is relatively simple and convenient, and the LLOQ of 10 ng/ml can satisfy our determination requirement. TP in all the biosamples can be detected accurately. In this method, different mobile phase compositions of methanol–water and acetonitrile–water were compared. Acetonitrile, rather than methanol was chosen as the organic modifier because it led to lower column pressure and background noise (Chang et al., Citation2005; Wang et al., Citation2005). This chromatographic condition provided symmetric peak shapes, good sensitivity and suitable retention time for the analyte (10.5 min) and IS (6.9 min). Under the optimized conditions, no significant endogenous interference was observed in all tissue matrices and plasma samples.
Sample preparation
Due to its low solubility in water and high solubility in lipophilicity solvent, liquid–liquid extraction was chosen to extract TP from biological matrix. Several organic solvents were compared as extracting solvents, such as ethyl acetate, chloroform, ethyl ether and dichloromethane. Ethyl acetate appeared to be the best choice, yielding a higher extraction ratio and lower background interference (Shao et al., 2007a).
Method validation
Specificity
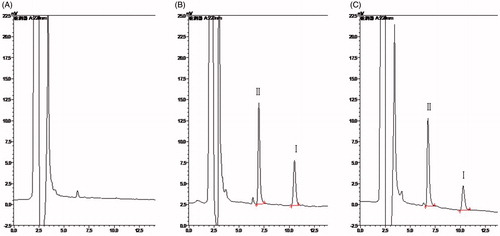
The degree of endogenous interference was assessed by inspection of chromatograms derived from blank plasma and blank tissue homogenate of liver (as a representative sample), blank plasma and blank liver homogenate spiked with TP and IS and samples collected at 5 min after i.v. administration of TP at the dose of 1.25 mg/kg. All the representative chromatograms mentioned above are shown in and , respectively. No significant interfering peaks at or near the retention time of TP and IS were observed, suggesting that the samples were highly purified by the liquid–liquid extraction method which in turn ensured a high selectivity of the HPLC method.
Figure 6. Representative chromatograms of blank plasma (A), plasma sample spiked with TP and IS (B) and plasma sample collected at 5 min after a single i.v. administration of TP at the dose of 1.25 mg/kg (C). Peak I: TP, peak II: IS.
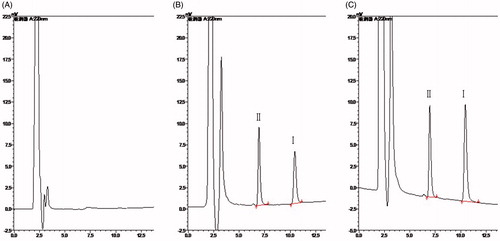
Figure 7. Representative chromatograms of blank liver (A), blank liver tissue spiked with TP and IS (B) and liver tissue collected at 5 min after a single i.v. administration of TP at the dose of 1.25 mg/kg (C). Peak I: TP, peak II: IS.
Linearity and LLOQ
The formulas of the standard curves of the peak area ratio (R) to the concentration (C), the linear range and correlation coefficient (r) of TP in plasma and tissue homogenates are listed in . Standard curves were linear over the ranges 10–2000 ng/ml in plasma, 10–400 ng/g in heart, liver, lung, kidney, brain, pancreas and 50–800 ng/g in spleen with correlation coefficient (r) larger than 0.9907. The LLOQ was defined as the lowest concentration at which both precision and accuracy were less than or equal to 20%. The current assay offered a LLOQ of 10 ng/ml in plasma and 10 ng/g in tissue homogenates.
Table 2. Standard curves of TP in plasma and tissues.
Precision and accuracy
Precision and accuracy of the method were examined by evaluating QC samples at low, medium and high concentrations in five replicates during a single day and by duplicating the experiments on three consecutive days. The intra-day and inter-day precisions were expressed by RSD. The accuracies of the method were determined by calculating the percentage deviation observed in the analysis of QC samples and expressed by RE. Data in suggested that the method was reliable and accurate for TP measurement in the mouse plasma and tissue homogenates.
Table 3. Precision and accuracy data of TP in plasma and tissues.
Recovery
The extraction recoveries were determined by comparing the peak area obtained from biological matrices spiked before extraction with those from biological matrices after extraction. The extraction recoveries of TP in plasma, heart, liver, spleen, lung, kidney, brain and pancreas were within the range of 87.4–94.2%, 86.7–92.3%, 84.3–89.7%, 88.2–93.7%, 82.9–88.4%, 87.7–91.2%, 84.3–89.1%, 87.9–91.4% at low, medium and high concentration levels. And the extraction recoveries of IS in plasma, heart, liver, spleen, lung, kidney, brain and pancreas were 80.1%, 82.4%, 79.6%, 80.3%, 84.1%, 82.7%, 78.6% and 82.9%, respectively. The results showed an acceptable recovery of TP and IS from plasma and tissues, and the method was simple to perform.
Stability
The stability was tested by analyzing five replicates of QC samples at three concentration levels exposed to different conditions: at room temperature for 4 h before sample preparation, at room temperature for 12 h in the autosampler after sample preparation, at −20 °C in the freezer for 7 days, three freeze-thaw cycles from −20 °C to room temperature. The results shown in indicated that this new method for the determination of TP in mouse offered satisfactory stability, and was suitable for large-scale sample analysis.
Table 4. Stability of TP in plasma and tissues (n = 5, mean ± SD, %).
Pharmacokinetic study in mice
The pharmacokinetic behavior of TP-LE was evaluated by determining the concentrations of TP in mice plasma up to 1 h after i.v. administration of TP-LE at the dose of 1.25 mg/kg, while free TP was chosen as a comparison. The mean plasma concentration–time profiles of TP-LE and TP obtained from measurements are shown in and the corresponding pharmacokinetic parameters calculated by the DAS2.0 software program are summarized in . A non-compartmental method was used to calculate pharmacokinetic parameters of TP. All data were expressed as mean ± SD. As seen from the figure, blood concentrations of TP-LE and TP reached a maximum at the end of administration, after which a rapid decline within the first 10 min was observed. Comparison of the pharmacokinetic parameters showed that the TP-LE group had markedly lower AUC than the TP group (p < 0.05), and the AUC of the TP group was 1.24 times higher than that of TP-LE. This phenomenon could be explained by the fact that, after i.v. administration of TP-LE, TP underwent rapid distribution and penetration into tissues, especially in liver, spleen and pancreas. However, the other main parameters, such as MRT, clearance and terminal elimination half-life showed no significant differences (p > 0.05). The MRT was about 10 min, which showed that TP was rapidly eliminated in both formulations. These results were consistent with an earlier report (Shao et al., 2007b).
Figure 8. Plasma concentration–time profiles of TP and TP-LE in mice after i.v. administration of TP and TP-LE at the dose of 1.25 mg/kg (n = 6, mean ± SD).
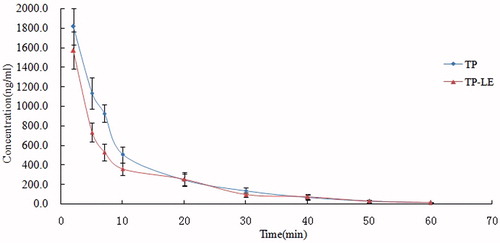
Table 5. Pharmacokinetic parameters of TP and TP-LE in mice after i.v. administration of TP and TP-LE at the dose of 1.25 mg/kg (n = 6, mean ± SD).
Tissue distribution study in mice
The concentrations of TP-LE and TP in mice tissues after i.v. administration of a single dose (1.25 mg/kg) of TP-LE and TP are shown in , while the tissue distribution parameters of the two formulations are listed in . At 5 min post-injection of either TP-LE or TP, the highest concentrations of TP were observed in all the collected tissues with the highest concentration of the TP-LE group being found in the spleen, followed by the pancreas, heart, lung, liver, brain and kidney and the highest concentration of the TP group being found in the spleen, followed by the lung, heart, pancreas, kidney, brain and liver. Meanwhile, the concentration of TP decreased rapidly in 60 min post-injection in all tissues (). Similar results were observed with both formulations in the pharmacokinetic study in mice. However, the tissue distribution pattern showed a significant higher AUC0–60min for TP-LE in liver and pancreas and a lower AUC0–60min in heart, lung and kidney compared to TP, demonstrating that TP-LE altered the distribution behavior of TP in tissues. The AUC0–60min of TP-LE in spleen and brain was slightly higher than that of TP, nevertheless, the differences between them were not significant (p > 0.05). The AUC0–60min for TP-LE was improved by 244% in liver compared to TP. The increased hepatic uptake was mediated by the RES system for the characterization of lipid emulsion. The smaller particle size of TP-LE might have contributed to the enhanced bioavailability. Simultaneously, concentrations of TP-LE in heart, lung and kidney tended to be lower than the TP group with significant differences in AUC0–60min (p < 0.05), indicating the potential for reduced toxicity of TP-LE. These results suggest that the distribution behavior of TP is altered in a lipid emulsion-based delivery system and an improved therapeutic effect may be achieved by TP-LE in liver and pancreas. At the same time, the results also suggest that TP-LE may reduce toxicity to other tissues, such as heart, lung and kidney.
Figure 9. Concentrations of TP-LE (A) and TP (B) in mice tissues at 5, 10, 30 and 60 min after i.v. administration of TP-LE and TP at the dose of 1.25 mg/kg (n = 6, mean ± SD).
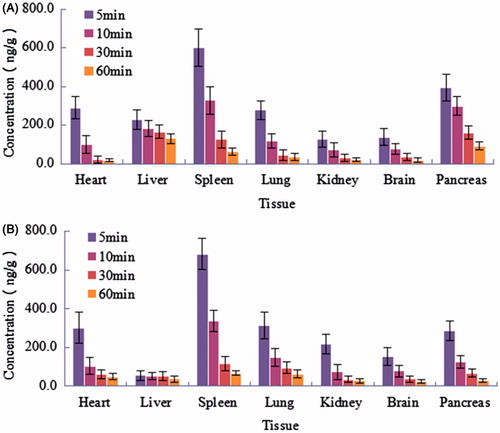
Figure 10. Tissue distribution curves of TP-LE and TP in mice after i.v. administration of TP-LE and TP at the dose of 1.25 mg/kg (n = 6, mean ± SD).
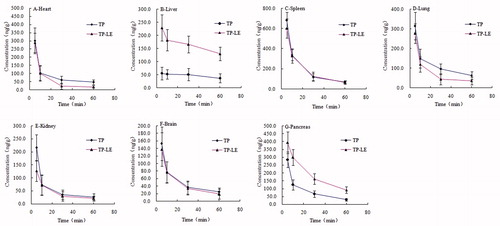
Table 6. Tissue distribution parameters of TP and TP-LE in mice after i.v. administration of TP and TP-LE at the dose of 1.25 mg/kg (n = 6, mean ± SD).
Accumulation effect on pancreas
It is known that an improved therapeutic effect can be achieved by the accumulation of anti-tumor drug in diseased tissue. It can be seen from and the parameters of TP-LE that the AUC0–60min for TP-LE was improved by 119% in pancreas compared to TP, indicating that TP-LE had a preferential accumulation in pancreas. Since the drug was loaded in the oil phase or in the oil–water interfacial film, this structure might be uptaken into pancreas and metabolized by pancrelipase. Then the drug was released and gathered in pancreas, thus playing its anti-tumor role. Moreover, the MRT of TP-LE (38.81 ± 5.13 min) in pancreas was significantly improved in comparison with free TP (27.09 ± 3.09 min), indicating that a relative longer time of anti-tumor pharmacological effect can be achieved in TP-LE. Both of the enhanced concentration and the longer residence time of TP-LE were beneficial for the clinical use of TP-LE to treat pancreatic cancer.
Conclusion
A novel formulation of TP-LE for intravenous administration was developed using an advanced technology of high-pressure homogenization. Determination of the drug content, pH value, particle size, zeta potential, EE% and light microscopy studies was carried out for the evaluation of TP-LE with regard to its physicochemical stability. The in vivo pharmacokinetic and tissue distribution studies demonstrated that TP-LE showed a preferential accumulation of drug in pancreas compared to the TP group. It is beneficial for the therapeutical effect for pancreatic cancer. At the same time, the concentration of TP-LE in heart, lung and kidney was lower than that of the TP group, indicating the potential for reduced toxicity of TP-LE. Therefore, lipid emulsion might be a promising carrier for i.v. administration of TP to achieve an enhanced pancreatic cancer therapy.
Acknowledgements
We wish to acknowledge the support of Pharmacy Laboratory Centre and Animal Centre of Shenyang Pharmaceutical University.
Declaration of interest
The authors report no conflicts of interest.
References
- Brinker AM, Ma J, Lipsky PE, et al. (2007). Medicinal chemistry and pharmacology of genus Tripterygium (Celastraceae). Phytochemistry 68:732–66
- Chan EWC, Cheng SCS, Sin FWY, Xie Y. (2001). Triptolide induced cytotoxic effects on human promyelocytic leukemia, T cell lymphoma and human hepatocellular carcinoma cell lines. Toxicol Lett 122:81–7
- Chang WT, Kang JJ, Lee KY, et al. (2000). Triptolide and chemotherapy cooperate in tumor cell apoptosis. J Biol Chem 276:2221–7
- Chang XL, Chen HB, Zhao XZ, et al. (2005). High-performance liquid chromatography determination of triptolide in vitro permeation studies. Anal Chim Acta 534:215–21
- Chen BJ. (2001). Triptolide, a novel immunosuppressive and anti-inflammatory agent purified from a Chinese herb Tripterygium Wilfordii Hook F. Leukemia Lymphoma 42:253–65
- Chugh R, Sangwan V, Patil SP, et al. (2012). A preclinical evaluation of minnelide as a therapeutic agent against pancreatic cancer. Sci Transl Med 4:156ra139
- Dan LW. (2005). Evolution of parenteral lipid emulsions. Clin Nutr Suppl 1:5–7
- Floyd AG. (1999). Top ten considerations in the development of parenteral emulsions. Res Focus 2:134–43
- Ju XY. (2007). Preparation of triptolide-liposome and its in vivo antitumor activity. Chin JMAP 24:271–4
- Kupchan SM, Court WA, Dailey RG, et al. (1972). Triptolide and tripdiolide, novel antileukemic diterpenoid triepoxides from Terpterygium wilfordii. J Am Chem Soc 94:7194–5
- Lee KY, Chang WT, Qiu D, et al. (1999). PG490 (Triptolide) cooperates with tumor necrosis factor-α to induce apoptosis in tumor cells. J Biol Chem 274:13451–5
- Li D, Xie K, Wolff R, Abbruzzese JL. (2004). Pancreatic cancer. Lancet 363:1049–57
- Li Q, Wang MQ, Duan LX, et al. (2009). Regional arterial infusion chemotherapy with lipid emulsion as a solvent for the treatment of advanced pancreatic cancer: a preliminary clinical study. J Intervent Radiol 18:275–7
- Li XJ, Jiang ZZ, Zhang LY. (2014). Triptolide: progress on research in pharmacodynamics and toxicology. J Ethnopharmacol 155:67–9
- Liu JH, Jiang RG, Wang CL. (2008). Improving pancreas targeting capability of hydroxycamptothecin using lipid emulsion as drug carrier. Chin Tradit Herb Drugs 39:844–7
- Liu Q. (2011). Triptolide and its expanding multiple pharmacological functions. Int Imunopharmacol 11:377–83
- Lu Y, Wang YJ, Tang X. (2007). Formulation and thermal sterile stability of a less painful intravenous clarithromycin emulsion containing vitamin E. Int J Pharm 346:47–56
- Mujumdar N, Mackenzie TN, Dudeja V, et al. (2010). Triptolide induces cell death in pancreatic cancer cells by apoptotic and autophagic pathways. Gastroenterology 139:598–608
- Phillips PA, Dudeja V, McCarroll JA, et al. (2007). Triptolide induces pancreatic cancer cell death via inhibition of heat shock protein 70. Cancer Res 67:9407–16
- Shamon LA, Pezzuto JM, Graves JM, et al. (1997). Evaluation of the mutagenic, cytotoxic, and antitumor potential of triptolide, a highly oxygenated diterpene isolated from Tripterygium wilfordii. Cancer Lett 112:113–17
- Shao F, Wang GJ, Sun JG, et al. (2007a). Pharmacokinetics of triptolide in Beagle dogs. Acta Pharm Sin 42:61–5
- Shao F, Wang GJ, Xie HT, et al. (2007b). Pharmacokinetic study of triptolide, a constituent of immunosuppressive Chinese herb medicine, in rats. Biol Pharm Bull 30:702–7
- Sun X, Zhang SM, Tian CH, et al. (2001). Safety of Tripterygium wilfordii. Chin J New Drugs 10:539–43
- Takenaga M. (1996). Application of lipid microspheres for the treatment of cancer. Adv Drug Deliv Rev 20:209–19
- Venkateswarlu V, Patlolla RR. (2001). Lipid microspheres as drug delivery systems. Ind J Pharm Sci 63:450–8
- Vincent A, Herman J, Schulick R, et al. (2011). Pancreatic cancer. Lancet 378:607–20
- Wang Z, Jin H, Xu R, et al. (2009). Triptolide downregulates Rac1 and the JAK/STAT3 pathway and inhibits colitis-related colon cancer progression. Exp Mol Med 41:717–27
- Wang ZH, Wen J, Xing JB, Guo D. (2005). Determination of triptolide and triptonide in human plasma by high-performance liquid chromatography. Biomed Chromatogr 19:60–2
- Xu LY, Chen HB, Xu HB, Yang XL. (2008). Anti-tumor and immuno-modulation effects of triptolide-loaded polymeric micelles. Eur J Pharm Biopharm 70:741–8
- Xu W, Xing FJ, Dong K, et al. (2014). Application of traditional Chinese medicine preparation in targeting drug delivery system. Drug Deliv Early Online:1–8. doi: 10.3109/10717544.2014.892545
- Xue M, Zhao Y, Li XJ, et al. (2012). Comparison of toxicokinetic and tissue distribution of triptolide-loaded solid lipid nanoparticles vs free triptolide in rats. Eur J Pharm Sci 47:713–17
- Yang S, Chen J, Guo Z, et al. (2003). Triptolide inhibits the growth and metastasis of solid tumors. Mol Cancer Ther 2:65–72
- Zhuang XM, Liu PX, Zhang YJ, et al. (2013). Simultaneous determination of triptolide and its prodrug MC002 in dog blood by LC–MS/MS and its application in pharmacokinetic studies. J Ethnopharmacol 150:131–7