
Abstract
The purpose of this study was to develop Carvedilol nanostructured lipid carriers (CAR-NLCs) using stearic acid and oleic acid as lipid, and to estimate the potential as oral delivery system for poorly water soluble drug. The particle-size analysis revealed that all the developed formulations were within the nanometer range. The EE and loading were found to be between 69.45–88.56% and 9.58–12.56%, respectively. The CAR–NLCopt showed spherical morphology with smooth surface under transmission electron microscope (TEM). The crystallization of the drug in NLC was investigated by powder X-ray diffraction and differential scanning calorimetry (DSC) and revealed that the drug was in an amorphous state in the NLC matrix. The ex vivo gut permeation study showed many folds increment in the permeation of CAR-NLCs compared to Carvedilol suspension (CAR-S). The oral bioavailability study of CAR was carried out using Wistar rats and relative bioavailability of CAR–NLCopt was found to be 3.95 fold increased in comparison with CAR-S. In vivo antihypertensive study in Wistar rats showed significant reduction in mean systolic BP by CAR-NLCopt vis-à-vis CAR-S (p < 0.05) owing to the drug absorption through lymphatic pathways. In conclusion, the NLC formulation remarkably improved the oral bioavailability of CAR and demonstrated a promising perspective for oral delivery of poorly water-soluble drugs. The promising findings in this investigation suggest the practicability of these systems for the enhancement of bioavailability of CAR.
Introduction
Carvedilol, ((±)-1-(carbazol-4-yloxy)-3-[[2-(omethoxyphenoxy) ethyl] amino]-2-propanol) (Chakraborty et al., Citation2009), is a drug showing antioxidant properties used in clinical practice for the treatment of cardiovascular diseases (hypertension, congestive heart failure, or myocardial infarction; Wen et al., Citation2004). The oral bioavailability remains low (e.g. 23%) because of significant first-pass hepatic metabolism by cytochrome P450 (Ubaidulla et al., Citation2007), and also has a short plasma half-life (Dollery, Citation1999). Long-term therapy of hypertension by the Carvedilol oral administration may result in poor patient compliance because of low bioavailability and short plasma half-life, leading to increased frequency of administration. Nanomedicine has been experimented with greatly in the past decade to overcome bioavailability and solubility-related problems. Lipid particles have been a subject of great interest within the researchers due to their ability to evade the hepatic first-pass metabolism and enhance intestinal permeability (Ramasamy et al., Citation2012; Tran et al., Citation2014). Lipid-based drug delivery systems have the capability to improve the solubility and bioavailability of orally administered poorly water-soluble and/or lipophilic drugs (O’Driscoll & Griffin, Citation2008). Lipid nanoparticles with solid particle matrix are derived from o/w emulsions by simply replacing liquid lipid (oil) by a solid lipid. Carvedilol nanostructured lipid carriers (CAR-NLCs) have a solid matrix blended with a liquid lipid (oil) to form an unstructured matrix that improved the drug loading and reduced drug expulsion from the matrix during storage (Zhuang et al., Citation2010; Beloqui et al., Citation2013). Due to the differences in the structures of the solid and liquid lipids, formation of a perfect crystal is distorted. Thus, the mixture accommodates the drug in molecular form or in amorphous clusters (Muller et al., Citation2007). The lipids employed in these are usually biocompatible and biodegradable with low toxicity as opposed to the polymeric nanoparticles (Muller et al., Citation1996; Kumar, Citation2000). NLCs show high drug loading for both lipophilic and hydrophilic drugs, also promote oral absorption of encapsulated drug via selective uptake through lymphatic route or payer’s patches (Fundaro et al., Citation2000; Chen et al., Citation2001). They rarely undergo blood clearance via the reticuloendothelial system (Muller et al., Citation2000; Kaur et al., Citation2008). NLC also showed sustained release of the drug from the lipid matrix which results in the prolongation of the drug concentration within the therapeutic window (Xie et al., Citation2011). Hence, NLC is becoming one of the best selected drug delivery system among the researchers. Therefore, the aim of the present work was to evaluate NLC as a tool for enhancement of the oral bioavailability of a poorly water-soluble drug, CAR. Thus, the work embarks upon the development of CaR-NLCs using a rational blend of lipid excipients, surfactants, and cosurfactants to enhance the oral bioavailability. The prepared NLCs were characterized for in vitro physiochemical performance, solid-state compatibility, in vivo pharmacokinetics, and antihypertensive potential in order to get a best possible formulation.
Materials and methods
Material
Carvedilol with a purity of 99.26% was kindly gifted by Wockhardt Research Center, Aurangabad (Maharashtra, India). Gelucire (39/01, 50/13), cetylpalmitate, Compritol 888, and tripalmitin were obtained as gift samples from Gattefosse, Mumbai, India. Stearic acid and Tween 80 were purchased from LobaChemie Pvt. Ltd., Mumbai, India. Linseed oil was purchased from Pure Chem Labs, Pune; olive oil was a product of Figaro, Madrid, Spain. All other reagents and chemicals obtained were of analytical grade.
Animals
Wistar rats (180–200 g) were used for this study and were fed standard rat chow, water, and were maintained on a12-h light/dark cycle. The experimental protocol (Approval number – 869) was reviewed and approved by the Institutional Animal Ethics Committee (IAEC), Jamia Hamdard, New Delhi. The study was performed in accordance with the guidelines of the Committee of the Purpose of Control and Supervision on Experimental Animals (CPCSEA), India.
Methods
Preformulation studies
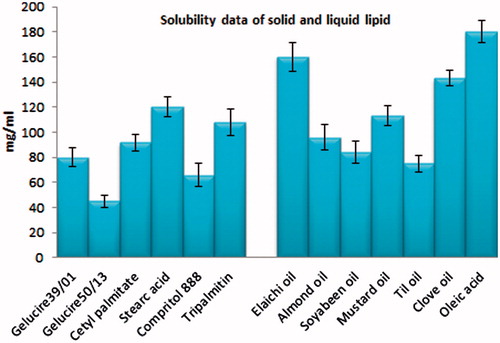
The study was performed to determine the solubility of CAR in the components to be used in the formulation. An array of solid lipids (gelucire 39/01, gelucire 50/13, cetylpalmitate, stearic acid, Compritol 888, and tripalmitin), liquid lipids (elaichi oil, almond oil, soybeen oil, mustard oil, clove oil, till oil, and oleic acid), and surfactants (Tween 80) are subjected to this study to select the most compatible out of each category. A known amount of CAR was added to a measured quantity of each solid lipid. The minimum amount of molten lipid required to solubilize the drug was noted visually within 24 h. The end point of the solubility study was the formation of clear solution of molten lipid. For the selection of liquid lipid, excess drug was added to a known volume of the various liquid lipids and mixed for 2 min and sonicated for 10 min to dissolve the drug. The contents were then centrifuged at 5000 rpm for 15 min, and supernatants were collected. The aliquots of supernatant were diluted appropriately and analyzed at 242 nm using a UV spectrophotometer (Shimadzu 1800, Kyoto, Japan).
Formulation of CAR-loaded NLCs
Carvedilol-loaded NLCs were prepared using by microemulsion followed the probe sonication technique. In this method, the aqueous phase was prepared by mixing water with Tween 80 (surfactant) and PEG4000 (cosurfactant). Separately, different concentration of lipid phase (stearic acid:oleic acid) was heated (at 80 °C) in a beaker and added dropwise in aqueous phase with constant stirring. The mixture was then allowed to stir for 20 min to form a stable emulsion. Further, this pre-emulsion was subjected to probe sonication for three cycles and cooled for the NLCs to solidify as depicted in . The NLC dispersion was subjected to freeze-drying using a freeze-dryer (Heto dry winner, Denmark), chamber pressure (20 pa), and cold trap temperature (−120 °C) in the entire process to obtain solid form of the NLCs. Prior to the drying process, the NLC dispersion was frozen in a freezer for 4 h. The frozen samples were subjected to the freeze drying process for 8–12 h. Mannitol (3%) was added as a lyoprotectant to avoid the lysis of the nanoparticles (Jia et al., Citation2010).
Table 1. Composition of different Carvedilol-loaded NLC formulation.
Particle size
Particle size analysis was performed by dynamic light scattering (DLS), also known as photon correlation spectroscopy, using a particle size analyzer (Zetasizer, HAS 3000; Malvern Instruments, Malvern, UK). Prior to the measurements, the NLCs dispersion was diluted using Milli-Q water to yield a suitable scattering intensity. DLS data were analyzed at 25 °C and with a fixed light incidence angle of 90 °C. The mean size and the polydispersibility index (PDI) were determined as a measure of the width of the particle size distribution.
Encapsulation efficiency
The encapsulation efficiency (EE) of NLCs was determined as the amount of CAR encapsulated in percent related to the total amount of drug added to the system. The encapsulation efficiency was determined by centrifugation technique. A known volume of CAR-NLCs dispersion was centrifuged at 5000 rpm (Remi centrifuge, Mumbai, India) for 30 min. The supernatant was separated, filtered using membrane filter, and was diluted appropriately. The amount of CAR was assayed at 242 nm using a spectrophotometer and encapsulation efficiency calculated using the equation below:
Drug loading
Drug loading of NLC was determined as amount of loaded drug in percent related to the lipid phase (matrix lipid and drug). A known volume of CAR-NLCs dispersions were transferred to the upper chamber of centrifuge tubes fitted with an ultrafilter (Pall Life Sciences, Mumbai, India). Then it was centrifuged at 5000 rpm (Remi centrifuge, Mumbai, India) for 15 min. The separated NLC was solubilized in appropriate medium and was filtered through 0.45-μm PTFE (polytetrafluoroethylene) membrane filter. The aqueous and organic filtrates were diluted appropriately, and the amount of CAR was estimated at 242 nm using a UV spectrophotometer; loading was calculated using below equation:
In vitro release kinetics
The study was used to measure the amount of drug released in specific time interval using semipermeable cellulose membrane. The cellulose membrane (up to 12 000 Da) was mounted between donor and receptor compartment of diffusion cell. The both samples (CAR-NLCs and CAR-S) containing CAR equivalent to 5 mg were placed in donor cell. The receptor medium consisted of 10 ml of phosphate buffer:PEG400(7:3) as release media with stirring rate and temperature of 300 rpm and 37 °C, respectively. At appropriate intervals, 1 ml aliquots of the receptor medium were withdrawn and immediately replaced with an equal volume of fresh media. The sample was filtered, diluted, and the amount of drug release was determined at 242 nm using UV spectrophotometer. The analyzed data were fitted into different kinetic models such as zero order, first order, Higuchi, Hixson–Crowell, and Korsmeyer–Pappas model (Citation1983), and best fit model was determined on the basis of regression coefficient (R2) value.
Ex vivo transport study
The transport study of CAR-NLCs versus CAR-S was performed as per the reported method using diffusion cell having area of 1.4 cm2 (Liu et al., Citation2011; Ranpise et al., Citation2014). The study was performed using phosphate buffer:PEG400 at pH 7.4 (7:3) as the receptor media. A small quantity of NLCs (equivalent to 5 mg of CAR) was placed on the stomach mucosal surface, and after a specific time interval, sampling was performed (0.5, 1, 2, 3, 4, 5, 6, 7, 8, 9, 10, 12, and 24 h) by removing the media from receptor compartment and replacing it with fresh medium. The collected sample was filtered and diluted, further analyzed using HPLC (Rizwan et al., Citation2009). The mean cumulative amount transported across the intestine at each time point was calculated.
Morphological feature
The morphology of CAR-NLCopt was observed using transmission electron microscope (TEM) attached with a camera (Morgagni 268-D, Netherlands), with an accelerating voltage of 60–80 kV at 1550× magnification. A drop of NLC dispersion was diluted with double-distilled water and placed on a copper grid, the excess was drawn-off with a filter paper. The sample was subsequently stained with 1% solution of phosphotungstic acid for 30s. The image was magnified and focused on a layer of photographic film microscope (Fei Electron Optics), and viewed using Soft Imaging Viewer software.
Differential scanning calorimetry
The possibility of any interaction between CAR and excipients was assessed by carrying out thermal analysis of the formulation using DSC (Perkin Elmer, Uberlingen, Germany). The analysis was performed on the pure CAR, stearic acid, and lyophilized CAR-NLC. The each sample was weighed accurately and kept in aluminum pans and scanned between 30 °C and 400 °C at a heating rate of 10 °C/min and cooling rate of 40 °C/min under nitrogen. An empty aluminum pan was used as reference in the study.
X-ray diffraction study
Drug and excipients used in formulation were subjected to X-ray crystallographic studies. The powder X-ray diffraction patterns were recorded using Tert Pan X-ray diffractometer (CW 3040/60, Holland). A voltage of 35 kV and a current of 30 mA for the generator were used with Cu as the tube anode material. The samples were exposed to a Cu–Kα radiation over a range of 2θ angles from 5° to 70° at the rate of 0.25 s time per step.
In vivo absorption behavior study
Wistar rats (n = 6) in two groups were used in the study as mentioned as Group 1 (CAR-S), and Group 2 (CAR-NLCopt) were administered same dose of Carvedilol using oral feeding sonde (dose 5 mg/kg). The blood samples were collected from the retro-orbital plexus of rat at 0 h pre dose, and 1, 2, 3, 4, 6, 8, 12, 24, 36 h post dose. The blood samples were collected in di-sodium EDTA-coated tube and mixed thoroughly in order to prevent blood clotting. Samples were centrifuged at 7000 rpm for 20 min at 4 °C. Separated plasma was transferred into prelabeled tubes and stored in a refrigerator until the completion of analysis. Plasma samples were processed by liquid–liquid extraction method.
The pharmacokinetic parameters were calculated by a noncompartment method using GraphPad software. The maximum plasma concentration (Cmax) and time to reach maximum concentration (Tmax) were estimated directly from the observed concentration versus time profiles. The area under the curve of plasma concentration versus time up to the last quantifiable time point, AUC0–t, was obtained by the linear trapezoidal method. The AUC0–t was extrapolated to infinity (AUC0–∞) by adding the quotient Clast/Kel, where Clast represents the last measured concentration and Kel represents the apparent terminal rate constant. The elimination rate constant (Ke) was calculated by regression analysis from the slope of the line, and the half-life (t1/2) was obtained by 0.693/Ke. The statistical significance of the differences between the formulations was analyzed by the Student’s t-test using GraphPad InStat 3 software. A difference below the probability level of 0.05 was considered statistically significant.
HPLC analysis of Carvedilol
HPLC system (Shimadzu., Japan) equipped with Supelco 516 (C18 column, 250 × 4.6 mm, I.D 5 μm) and binary pump (LC-10A VP) with detector SPD-10AVP were used in this study. The sample was injected using Rheodyne injection valve with a 20-μl loop. The flow rate of 1 ml/min was used to flow mobile phase, and detection was done at 242 nm. The extraction was performed by taking 100 μl of plasma standard or sample and was made alkaline by the addition of 100 μl of 0.05 M sodium bicarbonate and vortexed for 2 min; to these sample, 5 ml dichloromethane was added and vortexed for 5 min and then centrifuged at 5000 rpm for 10 min. The organic layer was separated and evaporated to dryness. The residues were reconstituted with 100 μl of mobile phase, and were filtered through 0.22-μm membrane filter prior to injection. The sample was injected into HPLC system, and drug concentration in plasma was evaluated (Gehr et al., Citation1999).
In vivo antihypertensive study
The rats were acclimated to the procedure of blood pressure measurement daily for 1 week. The rats were divided into four groups (Group 1 – control; Group 2 – hypertensive control; Group 3 – CAR-S; and Group 4 –CAR-NLCopt). Hypertension was induced in rats by administering methylprednisilone acetate subcutaneous injection (DEPO-MEDROL, Pfizer) in dose of 20 mg/kg/week, once a week for two weeks (Aqil et al., Citation2004). The studies were carried out using small Animal Tail Noninvasive Blood Pressure system (NIBP 200A; Biopac System, Inc., Goleta, CA) based on cuff-tail technique. On 0 day, blood pressure of all treated groups was measured (except Group 1) to check hypertension, and on day 1 Group 1 (control) and Group 2 (hypertensive control) of rats were given plain water. The Group 3 and Group 4 were given CAR-S and CAR-NLCopt (5 mg/kg) using oral feeding sonde. The oral dosing was performed by intubation using an 18-gauge feeding needle (the volume to be fed was 0.4 ml in all cases). Blood pressure was measured on an interval of 0, 1, 2, 4, 8, 12, 24, and 48 h. The blood pressure was measured using a noninvasive BP instrument by tail-cuff method, without external preheating (Bunag, Citation1973). The comparative mean percentage reduction in blood pressure of CAR-NLCopt and CAR-S was used to measure blood pressure of each rat. Statistical analysis of the collected data was performed using two-way ANOVA test.
Results and discussion
On the basis of maximum solubility of CAR in solid and liquid lipids, stearic acid (121.45 mg/g) and oleic acid (104.56 mg/ml) were selected as solid lipid and liquid lipid, respectively (). Tween 80 (5%) and PEG4000 (10%) were selected as surfactant and as cosurfactant, respectively on the basis of stability of prepared formulation with different surfactants.
Figure 1. Solubility of CAR in various solid and liquid lipids.
Particle size analysis
The mean size of lipid particles were found in the range of 165.11–204.54 nm (). The particle size statistics show that the variation in particle size depends on the amount of lipid in the formulation. The PDI used as a measure of a unimodal size distribution was within the acceptable limits for all the formulations. Usually, a small value of PDI indicates a homogenous population, while a larger PDI (>0.3) means a high heterogeneity in particle size (Zhang et al., Citation2012).
Table 2. Physicochemical evaluation parameters of Carvedilol NLC formulations.
Encapsulation efficiency
An important parameter with respect to NLCs as drug carriers is their capacity for drug encapsulation. As summarized in , CAR shows highest entrapment of 88.56 ± 2.47% in the formulation (F3) and lowest in the formulation (F6) 69.45 ± 3.53 as compared to the rest of the formulations. The higher encapsulation was observed by increasing oil content, the percentage of encapsulated drug increases as the drug shows more solubility in lipid blend. The high EE% values observed in this study indicate that the lipid and surfactant compositions employed were satisfactory for CAR-NLC.
Drug loading
The drug loading was done for all the developed formulation. Each preparation was evaluated for the total and free drug. The DL for CAR-NLCs dispersions were found to be in the range of 9.58 ± 1.21–12.56 ± 0.56% while lyophilized CAR-NLC showed lesser than the dispersion. The lower value of DL for lyophilized NLC than NLC dispersion may be due to destruction of nanoparticle structures during freezing and dehydration process of lyophilization. The high value of these parameters can be explained on the basis of high solubility of CAR both in the oil (oleic acid) and in the lipid (stearic acid).
In vitro release kinetics
The drug release from NLC versus suspension was plotted against time as shown in . Drug release from CAR-NLCopt was biphasic showing burst release (23.42% in 2 h) followed by sustained release, 77.56% drug release in the next 22 h. The initial burst release occurred due to the presence of the free CAR in the external phase and on the surface of the NLC. The burst release rate was affected by the change of concentration of lipid and surfactant in external phase. When the lipid concentration increased, the initial burst release rate decreased this may be due to the higher concentration of drug presence in the inner core (Priyanka & Sathali, Citation2012; Tsukamoto et al., Citation2013). The lipophilic nature of the CAR could be the reason for sustained release of the drug from internal lipid phase after initial burst release. Drug suspension was just taken to show that enhancement of solubility of drug by any means does not have any effect on the achievement of sustained release profile of the drug. In order to propose the possible release mechanism, the release data were evaluated to check the goodness of fit for various kinetic models (Higuchi, Citation1963; Korsmeyer, Citation1983; Peppas, Citation1985). The goodness of fit was evaluated by R2 (correlation coefficient) values and model showing the highest value of R2 was considered as the best model for release kinetics (). The highest value of the correlation coefficient (R2 = 0.964) was observed for Korsmeyer–Peppas model (1983), followed by the first-order (R2 = 0.943), Higuchi’s (R2 = 0.913) and zero-order (R2 = 0.887) models. The correlation coefficients obtained after fitting the in vitro release data to the respective model equations indicate that best fit is obtained with Korsmeyer–Peppas model.
Figure 2. In vitro release profile of CAR-NLC versus CAR-S. Each value represents the mean ± SD (n = 3).
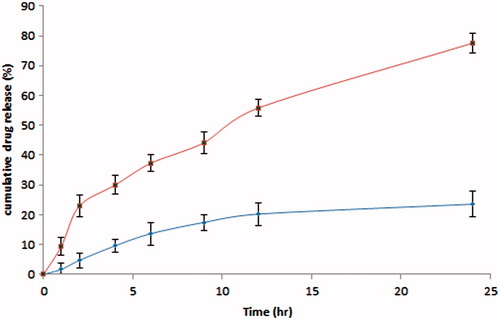
Table 3. In vitro release model fitting in terms of linear regression coefficient.
Ex vivo transport study
The cumulative amount of CAR permeated from suspension was 511.45 ± 34.23 μg and was significantly increased to 934.38 ± 41.67 μg, with F3 (p < 0.01; ). The permeation was significantly higher for CAR-NLCs compared to CAR-S (p < 0.01). The flux was also significantly increased in comparison to suspension, and the enhancement ratio was found to be well above 1 indicates improved permeation. Thus, diffusion of the NLCs seems possible with their lower particle size and high adhesion due to very high surface may explain the increase in permeation. Due to the lipid natures of the NLCs, they penetrate and remain localized for a longer period of time. To summarize, the promising results reveal the potential of NLC for improved absorption of CAR across the biological membrane.
Morphological feature
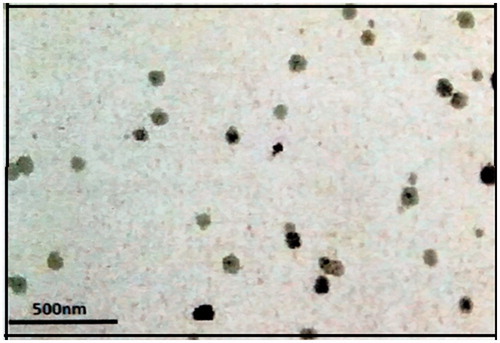
In order to investigate the morphology of the CAR-NLC, TEM was used. depicted the image of CAR-NLC, which is almost spherical and nonadherent to each other on a scale. The image shows uniform size distribution of NLC having coarsely spherical shape, displaying sealed structure. As indicated in the figure, particle diameters were consistent with the results obtained by DLS characterization and depicted a mono-dispersed spheroid-like appearance with a distinct boundary between each particle.
Figure 3. Surface morphology of CAR-NLCopt using TEM.
Differential scanning calorimetry
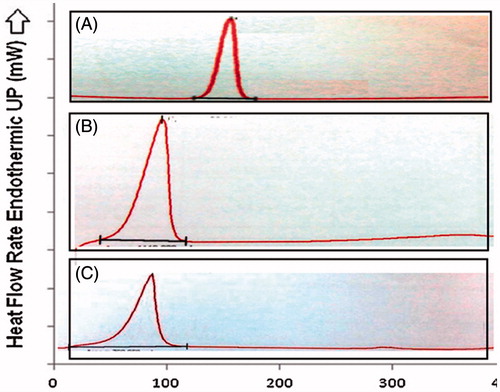
The DSC thermograms of pure CAR, stearic acid, and lyophilized CAR-NLC are shown in . The thermal curve of CAR () and stearic acid () showed an endothermic peak at 66.28 °C and119.28 °C, respectively. The melting endothermic peak of the lyophilized CAR-NLC () shifted to a lower temperature (61.94 °C). The decrease in melting temperature of NLC compared with stearic acid alone has been attributed to their small size (nanometer range) the dispersed state of the lipid and the presence of surfactants. This indicated that CAR was not in the crystalline state, but rather present in amorphous state and drug was completely entrapped within the nanoparticles (Agnihotri & Vavia, Citation2009; Raj et al., Citation2015).
Figure 4. DSC image of CAR-NLC and its ingredients. (A) CAR, (B) CAR-NLC, (C) stearic acid.
X-ray diffraction study
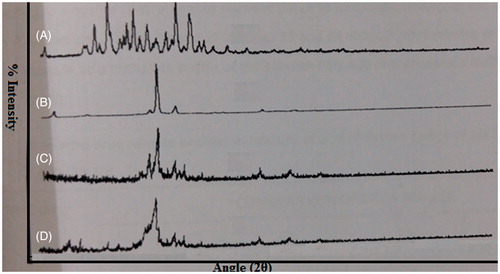
To find out the physical state of CAR, stearic acid, blank NLC was compared with that obtained XRD diffractogram of lyophilized CAR-NLC. The diffraction pattern of CAR showed that it is highly crystalline in nature as indicated by its numerous distinctive peaks with the major characteristic diffraction pattern appearing at a diffraction angle. The XRD interpretation of CAR-NLC formulation shows more of an amorphous nature as compared to the pure CAR as seen in . Some sharp peaks were also observed which may be due to the presence of mannitol in the NLCs which is crystalline in nature. The principal peak of CAR was absent in NLC formulation, may be due to incorporation of CAR between parts of crystal lattice of the lipid leading to change in the crystallinity of Carvedilol. Further, it was observed that the lipid matrix is less crystalline; it may be expected that the amorphous portion would accommodate drug as there would be enough space where the drug would be incorporated, compared with their physical mixture.
Figure 5. Powder X-ray diffraction image of CAR-NLC and its ingredients. (A) Carvedilol, (B) stearic acid, (C) placebo NLC, (D) lyophilized CAR-NLC.
In vivo absorption behavior study
The in vivo absorption study was performed with formulation of lower particle size with high entrapment, loading with release, and permeation was selected as CAR-NLCopt. Among six CAR-NLCs, formulation (F3) was selected as CAR-NLCopt and further evaluated for in vivo study. The experimental results showed a significant difference between the absorption profiles of CAR-NLCopt and that of CAR-S (). At each time point, the plasma concentration of CAR-NLCopt was much higher than that from CAR-S (). The peak concentration (Cmax) of CAR in treated rats was 1068.09 ± 36.94 ng/ml, which was significantly improved over many fold compared with that of free CAR-S (304.65 ± 23.89 ng/ml). In addition, the Tmax of CAR was at 1.5 h after oral administration of CAR-NLCopt, with shortened t1/2 in comparison to CAR-S. In particular, the AUC0–t value in rats treated with CAR-NLCopt (8881.028 ± 387.51 ng h/ml) was enhanced over that of CAR-S (2243.74 ± 274.11 ng h/ml; p < 0.01). The significantly enhanced oral absorption of CAR-NLCopt was consistent with that after the direct delivery into the intestine, which indicated that the intestinal absorption was predominant in the improved oral absorption. However, in this work, the results indicated that the CAR-NLCopt was much more effective than CAR-S, which could result from the enhanced permeability by the involved surfactant, uptake in the intestine, and the sustained release of drug. The intact CAR-NLC could be absorbed in the intestine, which could prolong the residence of CAR in systemic circulation. The rapid absorption could attribute to the increased aqueous solubility of CAR after incorporating into NLC and their nanometric size effect.
Figure 6. Comparative plasma concentration versus time curve of CAR-NLCopt and CAR-S after oral administration in rats. Each value represents the mean ± SD.
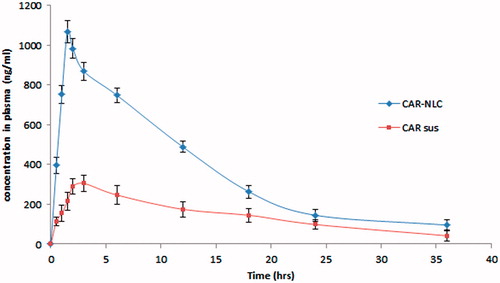
Table 4. In vivo absorption profile of CAR-NLCopt and CAR-S to rats after oral administration (5 mg/kg).
In vivo antihypertensive study
The blood pressure was checked at different time intervals and the effect of treatment on blood pressure level of hypertensive rats is shown in . At 0 h, all the groups of rats except normal control group showed a significant increase in blood pressure. The significant decrease in systolic blood pressure was observed in CAR-NLCopt treated rats as compared to CAR-S (p < 0.001). The CAR-NLCopt showed significant reduction in blood pressure of 17.85% over CAR-S (4.16%). The significant reduction in blood pressure, due to fact that, the CAR-NLCopt released the drug gradually over a longer period of time, resulted in prolonged control of hypertension. The lowest blood pressure attained by the CAR-S treated rat attained at 4 h (123.55 ± 9.22 mm Hg) whereas, the CAR-NLCopt showed greater results in reduction of blood pressure up to 8 h (107.21 ± 9.45 mm Hg) and up to 115.55 ± 8.11 mm Hg for 12 h. After 24 h, the blood pressure of CAR-NLCopt treated group still remained below the hypertensive range, whereas CAR-S treated group came back to the hypertensive state. This significant enhancement in antihypertensive activity was achieved due to the greater amount of the drug reaches the systemic circulation. This clearly indicated that NLCs promote oral absorption of encapsulated drug via selective uptake through lymphatic route or payer’s patches (Charman, Citation2000; Porter & Charman, Citation2001). The entire study puts forward superiority of CAR-NLC as compared to the conventional formulation (CAR suspension). So, the result of the present study demonstrated that NLCs as a drug carrier overcomes the limitation of low bioavailability and promotes oral absorption of encapsulated drug.
Table 5. Comparative antihypertensive effect of CAR-NLCopt and CAR-S on mean BP in MPA-induced hypertensive rats.
Conclusion
NLCs of CAR were successfully formulated by employing emulsification-probe sonication technique using stearic acid and oleic acid as the lipid phases. The formulated NLCs with lowest particle size and highest encapsulation efficiency, loading efficiency, and drug release were selected for in vivo study. The in vivo absorption study gives significant increase in bioavailability than suspension and pharmacodynamic study showed that NLCs reduces the blood pressure for longer period. The overall investigations present an alternate drug delivery system for increasing the CAR bioavailability through the NLCs methodology.
Declaration of interest
The authors report no declarations of interest.
References
- Agnihotri SM, Vavia PR. (2009). Diclofenac-loaded biopolymeric nanosuspensions for ophthalmic application. Nanomedicine 5:90–5
- Aqil M, Ali A, Sultana Y, Parvez N. (2004). Matrix type transdermal drug delivery systems of metoprolol tartrate: skin toxicity and in vivo characterization. Ethiop Pharm J 22:27–35
- Beloqui A, Solinis MA, Gascon AR, et al. (2013). Mechanism of transport of saquinavir-loaded nanostructured lipid carriers across the intestinal barrier. J Control Release 166:115–23
- Bunag RD. (1973). Validation in awake rats of a tail cuff method for measuring systolic blood pressure. J Appl Physiol 34:279–82
- Chakraborty S, Shukla D, Jain A, et al. (2009). Assessment of solubilization characteristics of different surfactants for carvedilol phosphate as a function of pH. J Colloid Interface Sci 335:242–9
- Charman WN. (2000). Lipids, lipophilic drugs, and oral drug delivery-some emerging concepts. J Pharm Sci 89:967–78
- Chen DB, Yang TZ, Lu WL, Zhang Q. (2001). In vitro and in vivo study of two types of long circulating solid lipid nanoparticles containing paclitaxel. Chem Pharm Bull 49:1444–7
- Dollery C. (1999). Therapeutics drugs. Edinburgh: Churchill Livingstone, 75–80
- Fundaro A, Cavalli R, Bargoni A, et al. (2000). Non-stealth and stealth solid lipid nanoparticles (SLN) carrying doxorubicin: pharmacokinetics and tissue distribution after i.v. administration to rats. Pharmacol Res 42:337–43
- Gehr TWB, Tenero DM, Boyle DA, et al. (1999). The pharmacokinetics of carvedilol and its metabolites after single and multiple dose oral administration in patients with hypertension and renal insufficiency. Eur J Clin Pharmacol 55:269–77
- Higuchi T. (1963). Mechanism of sustained-action medication. Theoretical analysis of rate of release of solid drugs dispersed in solid matrices. J Pharm Sci 52:1145–9
- Jia L, Zhang D, Li Z, et al. (2010). Nano-structured lipid carriers for parenteral delivery of silybin: biodistribution and pharmacokinetic studies. Colloids Surf B Biointerfaces 80:213–18
- Kaur IP, Bhandari R, Bhandari S, Kakkar V. (2008). Potential of solid lipid nanoparticles in brain targeting. J Control Release 127:97–109
- Korsmeyer RW, Gurny R, Doelker EM, et al. (1983). Mechanism of solute release from porous hydrophilic polymers. Int J Pharm 15:25–35
- Kumar MNR. (2000). Nano and microparticles as controlled drug delivery devices. J Pharm Sci 3:234–58
- Liu D, Liu Z, Wang L, et al. (2011). Nanostructured lipid carriers as novel carrier for parenteral delivery of docetaxel. Colloids Surf B Biointerfaces 85:262–9
- Muller RH, Maassen S, Weyhers H, Mehnert W. (1996). Phagocytic uptake and cytotoxicity of solid lipid nanoparticles (SLN) sterically stabilized with poloxamine 908 and poloxamer 407. J Drug Target 4:161–70
- Muller RH, Mader K, Gohla S. (2000). Solid lipid nanoparticles (SLN) for controlled drug delivery – a review of the state of the art. Eur J Pharm Biopharm 50:161–77
- Muller RH, Petersen RD, Hommoss A, Pardeike J. (2007). Nanostructured lipid carriers (NLC) in cosmetic dermal products. Adv Drug Deliv Rev 59:522–30
- Nisharani S, Ranpise NS, Korabu SS, Ghodake VN. (2014). Second generation lipid nanoparticles (NLC) as an oral drug carrier for delivery of lercanidipine hydrochloride. Colloids Surf B Biointerfaces 116:81–7
- O’Driscoll CM, Griffin BT. (2008). Biopharmaceutical challenges associated with drugs with low aqueous solubility- the potential impact of lipid-based formulations. Adv Drug Deliv Rev 60:617–24
- Peppas NA. (1985). Analysis of Fickian and non-Fickian drug release from polymers. Pharm Acta Helv 60:110–11
- Porter CJH, Charman WN. (2001). Intestinal lymphatic drug transport: an update. Adv Drug Deliv Rev 50:61–80
- Priyanka K, Sathali AA. (2012). Preparation and evaluation of montelukast sodium loaded solid lipid nanoparticles. J Young Pharm 4:129–37
- Raj R, Mongia P, Ram A, Jain NK. (2015). Enhanced skin delivery of aceclofenac via hydrogel-based solid lipid nanoparticles. Artif Cells Nanomed Biotechnol. [Epub ahead of print]. DOI: 10.3109/21691401.2015.1036997
- Ramasamy T, Khandasami US, Ruttala H, Shanmugam S. (2012). Development of solid lipid nanoparticles enriched hydrogels for topical delivery of anti-fungal agent. Macromol Res 20:682–92
- Ranpise NS, Korabu SS, Ghodake VN. (2014). Second generation lipid nanoparticles (NLC) as an oral drug carrier for delivery of lercanidipine hydrochloride. Colloids Surf B Biointerfaces 116:81–7
- Rizwan M, Aqil M, Azeem A, et al. (2009). Study of the degradation kinetics of carvedilol by use of a validated stability-indicating LC method. Chromatographia 70:1283–6
- Tran TH, Ramasamy T, Cho HJ, et al. (2014). Formulation and optimization of raloxifene-loaded solid lipid nanoparticles to enhance oral bioavailability. J Nanosci Nanotechnol 14:4820–31
- Tsukamoto T, Hironaka K, Fujisawa T, et al. (2013). Preparation of bromfenac-loaded liposomes modified with chitosan for ophthalmic drug delivery and evaluation of physicochemical properties and drug release profile. Asian J Pharm Sci 8:104–9
- Ubaidulla U, Reddy MVS, Ruckmani K, et al. (2007). Transdermal therapeutic system of carvedilol: effect of hydrophilic and hydrophobic matrix on in vitro and in vivo characteristics. AAPS PharmSciTech 8:E1–8
- Wen X, Tan F, Jing Z, Liu Z. (2004). Preparation and study the 1:2 inclusion complex of carvedilol with beta-cyclodextrin. J Pharm Biomed Anal 34:517–23
- Xie S, Zhu L, Dong Z, et al. (2011). Preparation, characterization, and pharmacokinetics of enrofloxacin-loaded solid lipid nanoparticles: influences of fatty acids. Colloids Surf B Biointerfaces 83:382–7
- Zhang L, Han L, Sun X, et al. (2012). The use of PEGylated liposomes to prolong the circulation lifetime of salvianolic acid B. Fitoterapia 83:678–89
- Zhuang CY, Li N, Wang M, et al. (2010). Preparation and characterization of vinpocetine loaded nanostructured lipid carriers (NLC) for improved oral bioavailability. Int J Pharm 394:179–85