Abstract
Bovine chondrocytes were seeded into scaffolds of a high molecular weight chitosan and alginate with a pore size of 50–350 μm with or without catechin. In polymerase chain reaction (PCR), unlike type II, collagen type I was no longer expressed at day 14. The DNA content increased until day 8 and began declining, indicating cell detachment. The GAG content increased during the first 12 days. The percentage of round and collagen type II immunoreactive cells increased over the time. Catechin has some protective properties on chondrocytes seeded on the alginate-chitosan scaffolds during the first 12 days by means of DNA and chondrocyte morphology (p < 0.05).
Keywords::
Introduction
Carrier matrices for chondrocyte transplantation to defect sites are still a scientific interest. Following expansion or without expansion in 2 dimensional cultures, chondrocytes are seeded into biological or synthetic carrier matrices and implanted into lesioned sites of articular cartilage (Keeney et al. Citation2011). The success of a carrier matrix is depended on its biocompatibility, biodegradability, affinity to chondrocytes, and capacity to preserve chondrocytic phenotype (Glowacki Citation2000). Biological and synthetic matrices including agarose, alginate, chitosan, collagen gels and sponges, fibrin, hyaluronan, polyethylene oxide, polylactic acid and others have been used as carrier matrices for regeneration of hyaline cartilage (Chang et al. Citation2005, Kisiday et al. Citation2002). Although these materials seem to promote the chondrocytic phenotype, the outcome is often inconsistent and irreproducible (Li and Zhang Citation2005).
Alginate is a polysaccharide composed variable amounts of β-1-4 mannuronic acid and its C-5 epimer, α-L-glucuronic acid. It can be extracted from algae and produced in desired features and chain structures (Draget et al. Citation1997, Rowley et al. Citation1999). Alginate can form polyelectrolyte gels in the presence of divalent cations (Ca, Mg) and polycations (chitosan, polyethylenimine, polylysin). The swelling capacity and pore size are important features for a scaffold as these parameters are determinants of cell viability as well as transfer of molecules within the scaffold (Gombotz and Wee Citation1998, Illum Citation1998, Tiyaboonchai et al. Citation2003). Importantly, alginate is biocompatible, biodegradable, inexpensive and suitable for chondrocyte attachment (Li and Zhang Citation2005).
Chitosan is another natural polymer commonly used in bioengineering (Suh and Matthew Citation1999). Chitosan has a good capacity of biocompatibility and biodegradability (Kim et al. Citation2008). With respect to cartilage tissue engineering, chitosan-based carriers allow matrix synthesis by chondrocytes and deposition of synthesized matrix in vitro and in vivo (Hoemann et al. Citation2005). Due to its polycationic feature and thus binding ability, chitosan can also be used as a crosslinker to other biomaterials (Chung et al. Citation2000). The alginate-chitosan scaffolds seem to be more effective to protect chondrocytic phenotype (Li and Zhang Citation2005). The alginate-chitosan scaffolds can be synthesized in neutral pH and allow uniform deposition of proteins and bioactive molecules (Li et al. Citation2005).
Catechin (epigallocatechin gallate ECG) is a water soluble natural polyphenolic compound that has anti-inflammatory and strong anti-oxidative effects and capacity to capture free radicals (Kapoor et al. Citation2004). Recent studies showed that catechin augments angiogenesis and contributes to regulation of nitric oxide synthetase and cyclogenase enzymes (Kapoor et al. Citation2004). Catechin has no toxic effects, but exerts protective effects on chondrocytes (Adcocks et al. Citation2002, Havsteen Citation2002, Singh et al. Citation2002, Sin and Kim Citation2005). It slows down collagen and proteoglycan degradations (Adcocks et al. Citation2002, Sin and Kim Citation2005, Kuttan et al. Citation1981, Madhan et al. Citation2007), inhibits expression of cyclooxygenase-2 (COX-2) and prostaglandin E2 (PGE2) synthesis in chondrocytes (Heinecke et al. Citation2010) and regulates the G0/G1 phase of cell cycles and NF-kappa B expression (Bae et al. Citation2010). In addition, catechin interferes with synthesis of degradation enzymes such as collagenase and elastase in damaged tissues (Havsteen Citation2002). Catechin inhibited expression of tumor necrosis factor-alpha and matrix metallprotenases-13 in vitro (Rasheed et al. Citation2009). Another study found that catechin inhibits interleukin- 1β-induced expression of matrix metalloproteinase-1 and -13 in human chondrocytes (Ahmed et al. Citation2004).
It is well known that no ideal scaffold has been fabricated yet for cartilage tissue engineering. As mentioned above alginate-chitosan matrix has some capacities to preserve the chondrocytic phenotype and to promote chondrocyte survival (Li and Zhang Citation2005, Li et al. Citation2005). It has been reported that loading bioactive molecules such as transforming growth factor β1 (Li and Zhang Citation2005) and RGD-protein (Hsu et al. Citation2004) can improve alginate-chitosan matrices to some extent. The beneficial effects of catechin on chondrocyte metabolism may promote chondrocytic phenotype and survival in a suitable carrier matrix. The aim of the present study was to fabricate and evaluate a porous alginate-chitosan scaffold and to investigate beneficial effects of catechin on chondrocytes seeded into scaffolds.
Materials and methods
Fabrication of porous scaffold
Scaffolds were prepared as follows: 500 mg of a high molecular chitosan (Sigma-Aldrich, Germany) was dissolved in 100 ml of freshly prepared acetic acid solution (1% in pure water), and 1 g of CaCl2 (Serva, Israel) was added. Then, 10 ml of 5% alginate solution (pH: 7.4) (Sigma-Aldrich, Germany) with or without catechin (75 μg/ml) was dropped into the beaker at a speed of 10 ml per hour while stirring at a speed of 200 cycles/min. The newly formed scaffolds were further stirred for 30 minutes. Upon soaking the surface water by filter papers, the scaffolds were then placed in a −196°C liquid nitrogen tank to obtain a porous structure. The frozen porous scaffolds were then placed into a lyophylizator for 24 hours at −56°C to remove excess water. The scaffolds were then kept in an incubator at 50°C to remove any remaining water and placed in desiccators until use. The scaffolds were autoclaved at 121°C for an hour prior to use in 3 dimensional (3D) cell cultures.
Determination of scaffold swelling ratio
The swelling capacity of the scaffolds was determined using a method by Fenercioğlu (Citation2003). Briefly, upon determining the dry weight, scaffolds were kept in physiologic saline for different lengths of time. After removing the excess surface water by a filter paper, scaffolds were weighed. The swelling ratio was calculated using the following equation: Swelling ratio (%) = wet weight-dry weight/dry weight × 100. The test was repeated with three different samples.
Determination of catechin release from scaffolds
The catechin-loaded scaffolds were placed in a 20 ml flask. Upon adding 5 ml of 0.15 M NaCl, the scaffolds were stirred slowly avoiding any harm to scaffolds. Collecting 1 ml of liquid containing no scaffolds into eppendorf tubes, the amount of catechin was measured in a UV-VIS spectrophotometer (Shimadzu 1700, Japan) at 280 nm. The liquid samples were poured back into the flask after measuring the catechin amount. The same procedure was repeated every 15 minutes at the beginning and then every day for 21 days. After that the release study was stopped as the scaffold structural deformation was conspicuous. The amount of catechin released from the scaffolds was calculated according to the graphs of the standard previously prepared after measuring spectrophotometrically. The amount of catechin released was calculated using the formula obtained from the standard solution: Y = 0.0018X. The release rate was calculated using the following equation: Release rate (%) = amount of catechin recovered/amount of catechin initially loaded × 100.
Scanning electron microscopy for pore size
The scaffolds were rinsed in PBS (pH 7.4) and kept in a solution of 2% gluteraldehyte and 0.6% paraformaldehyte at 4°C for 24 hours. The fixed scaffolds were dehydrated through a series of graded acetone, dried in a critical point dryer and coated with gold-palladium. The coated scaffolds on stubs were then analyzed by a scanning electron microscope (SEM) (Jeol JSM5600, Japan) for general features and pore diameter. The test was repeated with three different samples.
Chondrocyte culture
Articular cartilage was harvested under aseptic conditions from the knee joint of young calves that had died following various reasons. The articular surface seemed healthy with no evidence of any joint diseases. Cartilage samples were placed in PBS (pH 7.4) and minced into pieces approximately 1 mm. Cartilage pieces were incubated overnight in serum-free liquid medium containing 10% collagenase II (Sigma- Aldrich, Germany) and 10% trypsin-EDTA (Amresco, Israel). Upon washing with sterile physiologic saline, isolated chondrocytes were then incubated at 37°C in Dulbecco's modified Eagle's medium (DMEM) containing 10% fetal calf serum (FCS) and 1% antibiotic. The culture medium is completely replaced every other day. When chondrocytes reached confluence, they were detached by trypsin-EDTA. The chondrocyte suspensions were placed in 15 ml tubes and centrifuged at 3000 rpm for 4 minutes.
Chondrocyte seeding
Chondrocytes were seeded into catechin loaded and unloaded scaffolds at a density of 100.000 per scaffold. Chondrocyte-seeded scaffolds were then kept in a carbon dioxide incubator and then examined for DNA and GAG contents at days 0, 3, 5, 8, 12, 14, and 18 as well for collagens types I and II by PCR analysis, cell attachment with scanning electron microscopy, histology and immunohistochemical analyses at days 3, 5, 8, and 14.
Scanning electron microscopic evaluation of chondrocyte loaded scaffolds
As also described above for the pore size, a previously used protocol (Gille et al. Citation2005) was followed in general. Chondrocyte-loaded scaffolds were processed for SEM and coated with a thing film of gold-palladium. Using the Jeol SEM, chondrocyte attachment and chondrocyte general morphology were examined. The test was repeated with three different samples.
Quantification of total DNA
For DNA quantification, a previously used method was followed (Hsu et al. Citation2004). Briefly, the Hoechst 33358 dye (Sigma-Aldrich, Germany), previously prepared in pure water at a concentration of 1 mg/ml, was further diluted in TNE buffer (0.01 M Tris, 0.2 M NaCl, and 0.001M EDTA, pH 7.4) to achieve a final concentration of 0.1 μg/ml. Then, 2.25 ml of diluted Hoechst 33358 dye was poured into a tube containing 250 μl of papain-digested scaffold suspension. Using a fluorescence spectrophotometer (Jasco FP 700, Japan), fluorescence was measured at 365 nm excitation and at 458 nm fluorescence emission. The DNA content was calculated using the formula obtained from the standard, which was a commercially purchased fetal calf thymus DNA (Amresco, Israel): Y = 2,8425X. The R2 value obtained from the measurement of commercial fetal calf thymus DNA at the fluorescence spectrophotometer was found to be 0.9922. Measurements were collected from three different samples for every time point.
Determination of glycosaminoglycan content
The total sulfated GAG content was determined quantitatively by the 1,9-dimethylmethylene blue (DMMB) method. Briefly, the DMB dye solution was prepared as previously described (Enobakhare et al. Citation1996). Chondrocyte seeded scaffolds (1 g) were digested in a solution containing 300 μg/ml papain (Amresco, Israel), 2 nM EDTA (Amresco, Israel), and 2 mM N-acetyl L-cysteine (Sigma-Aldrich, Germany) at 65°C for 1 hour. Then, 250 μl of solution containing digested scaffolds were poured into a tube and then 2.5 ml of DMB dye solution was added. Upon mixing in a vortex, samples were read at 535 nm using a spectrophotometer (Jasco FP 700, Japan). Using a commercial chondroitin sulfate (Sigma-Aldrich, Germany) as a standard, the GAG content was calculated using the following formula obtained from the standard: Y = 0,061X. The R2 value of the graph obtained from the measurement of commercial chondroitin sulfate at 535 nm was found to be 0.9773. Measurements were collected from three different samples for every time point.
Polymerase chain reaction
Polymerase chain reaction (PCR) analyses were conducted on total RNA isolated from chondrocytes in 2 dimensional (2D) cultures as well as those in 3D cultures. The procedure was basically same except, the 3D culture was applied further treatment prior to RNA isolation: 300 μg/ml of papain digested scaffold suspension was sonicated for 15 minutes, homogenized, and then centrifuged at 5000 rpm. Then the supernant containing disrupted chondrocytes were further digested with 0.625 U/ml collagenase (Sigma-Aldrich, Germany). For RNA isolation, an Rneasy Mini Kit (Qiagen 74104) was used based on manufacturer's recommendations. Using a commercial cDNA Synthesis Kit (Roche 1596 594), cDNA was synthesized in accordance with the manufacturer's recommendations. Primers (Metis, Ankara) were as follows: Forward collagen type I- 5’-cca tcc aaa cca ctg aaa-3 , Reverse collagen type I- 5’-tga cga gac caa gaa ctg-3 , Forward collagen type II- 5’-tct ggc aaa gat ggt gct aat gg-3 , Reverse collagen type II- 5’-tct tct tgg gaa cgt ttg ctg g-3 , Forward β2 Microglobulin- 5’-ctc gcg cta ctc tct ctt tct gg-3 , and Reverse β2 microglobulin- 5 -gct tac atg tct cga tcc cac tta a-3 .
PCR conditions were 34 cycles of 60 seconds at 94°C, 30 seconds at 54°C, 30 seconds at 72°C. Then samples were then kept at 4°C for 10 minutes to cool. RT-PCR products were separated by electrophoresis on an agarose gel (Prona 101674PR), stained with Sybr Green I (Sigma S9430), and documented by a gel documentation system (Uvitec).
Histology of chondrocyte seeded scaffolds
Chondrocyte seeded scaffolds, incubated in 3D cultures for different time periods, were fixed in a commercial fixative named Immunofix (Bio-optica, Italy). The fixed scaffolds were dehydrated and cleared in graded alcohol series and xylol and embedded in paraffin. 7 μm thick sections were cut using a rotary microtome and placed on poly-lysin coated glass slides. Deparaffinized sections were stained with toluidine blue for GAG presence and hematoxylin&eosin for morphology. Chondrocyte morphology was analyzed and round cells were counted in 10 random microscope fields using the 20X objective of a light microscope (Olympus BX-51). The final data were expressed as percentage of round cells. Measurements were collected from three different samples for every time points.
Immunostaining
Following routine deparaffinization and rehydration procedures, sections were incubated in a blocking serum (Scytek Lab, USA) for 10 minutes to prevent non-specific bindings. Then, sections were incubated either with monoclonal anti-bovine collagen type I (Santa-Cruz, USA, dilution rate of 1:100) or monoclonal anti-bovine collagen type II (Santa-Cruz, USA; dilution rate 1:250) for 50 minutes at room temperature. Then, sections were incubated with a FITC attached anti-mouse antibody (Chemicon; USA; dilution rate of 1:64) for 30 minutes at room temperature. The sections were then incubated with propodium iodide (PI) (Sigma-Aldrich, Germany) for 30 minutes for nucleus staining. Upon covering with a water-based glue (Scytek Lab, USA), sections were immediately analyzed using an inverted microscope (Leica DMIL, Germany) and photographed (Leica DF320, Germany). Using the 20X objective of a light microscope, 10 random fields were analyzed for the presence of immunoreactivity, and data were expressed as percentage of immunoreactive cells. Measurements were collected from three different samples for every time point.
Statistical analyses
Data were presented as mean ± standard deviation and analyzed with Shapiro-Wilk test if they were normally distributed. Upon confirming normality, data were analyzed with Repeated Measures ANOVA. If there was a difference, data were further analyzed with Bonferroni test for post-hoc comparison. A p value of ≤ 0.05 was considered as significant. For statistical analyses, MS-Excel 2003 and SPSS for Win. Ver. 15.0 (SPSS Inc., Chicago, IL, USA) programs were used.
Results
Determination of scaffold swelling ratio
The swelling ratio of the scaffold prepared from the high molecular chitosan (500 mg/100 ml) and 5% alginate was presented in . The swelling ratio dramatically increased during the first 3 hours. Swelling also continued after the first 3 hours, but not as high as during the first 3 hours. The swelling ratio exhibited almost no change after the 8th hour of the test.
Table I. The swelling ratio of the scaffold prepared from the high molecular chitosan (500 mg/100 ml) and 5% alginate.
Scanning electron microscopy for pore size
The pore diameter of the scaffold varied between 50 and 350 μm (a). The SEM pictures of the surface and cut-surface of the scaffolds were shown in Figures 2a and 2b, respectively.
Figure 1. Scanning electron microscope pictures of the high molecular chitosan (500 mg/100 ml) and 5% alginate. A. The surface of the scaffold with a pore size approximately 50–350 μm. B. The cut surface of the scaffold. C. Chondrocytes (arrows) are well attached to the scaffold. D. Chondrocyte attachment (arrow) to the wall of the pores. E. Chondrocytes are covered the entire scaffold surface on the 3rd day of the culture. F. Empty surface areas devoid of chondrocytes are visible on the surface.
Catechin release from the scaffold
The catechin release rate from the scaffold is presented in . Catechin release increased during the first 5 days of incubation and then began declining. Catechin release continued with fluctuations between days 5 and 13. No conspicuous structural degenerations of the scaffold occurred by day 19 at which 80–85% of catechin was released. We stopped the assay at the 21st day of incubation at which scaffold degradation became conspicuous.
Figure 2. Catechin release from the scaffold prepared from solution of the high molecular chitosan (500 mg/100 ml) and 5% alginate.
Scanning electron microscopy of chondrocyte-seeded scaffolds
Scanning electron microscopy pictures of the chondrocyte-seeded scaffolds were taken on days 3, 5, 8 and 14. The chondrocyte attachment was well on the surface (c) as well as onto the accessible pore walls (d). In scaffolds with and without catechin, the surface of the scaffolds were fully covered with well attached chondrocytes on day 3 (e). Over time the number of chondrocytes on the surface seemed to decline as the empty spaces on the surface were quite visible at day 14 (f). We avoided giving the number of chondrocytes attached to surface counted at a certain magnification as inside of the scaffold cannot be depicted well.
DNA content
presents DNA measured in 1 g of scaffold. There are significant differences for DNA content among different time points in both groups (p < 0.05). Starting from day 0, the DNA content increased up to the 8th day of incubation and then began declining. The decrease is likely related to cell detachment from the surface and pore walls. The detached cells were likely to be discharged during the medium change of the culture. Importantly, the amount of DNA content was higher in group II at any time points, but only days 3, 8 and 12 showed statistical significance (p < 0.003, p < 0.033 and p < 0.001, respectively).
Table II. DNA content measured in 1 g of scaffold during the incubation period.
GAG content
The amount of GAG content increased during the first 12 days in scaffolds either with or without catechin and then slightly decreased (). The decline in GAG content in scaffolds either with or without catechin was not as dramatic as in DNA content. Although scaffolds with catechin had higher amount of GAG content at all time points except day 0, the differences were not statistically significant (p > 0.05).
Table III. GAG content measured in 1 g of scaffold during the incubation period.
Phenotype characterization with PCR
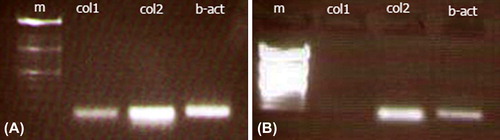
Ribonucleic acid was isolated from all samples. The amplified cDNA in 2 dimensional culture at the 7th day of the culture, prior to loading into the scaffolds, yielded in a strong band for collagen type II and a weaker band for collagen type I (a). The collagen type I band was shown until day 8 of 3D culture of the scaffolds of both groups, but it was no longer expressed at day 14 in either group (b).
Figure 3. Agarose gel documentation PCR analyses of collagen type I and collagen type II. A. A strong collagen type II band and a weaker collagen type I bands were expressed until the 8th day of the culture. The gel picture belonged to the chondrocyte seeded scaffolds devoid of catechin at the 5th day. B. The collagen type I band was no longer at the 14th day. The gel picture belonged to the chondrocyte-seeded scaffolds loaded with catechin at the 14th day. M = DNA marker; col1 = collagen type I, col2 = collagen type II; b-act = β2-microglobulin.
Histological evaluation
In both groups, the scaffold samples stained with toluidine blue showed that all cells expressed metachromatic staining that was mainly located in the cytoplasm (a). At day 14, the number of chondrocytes was lower; however, strong metachromatic staining is still the feature of chondrocytes (b). Some metachromatic staining around the close surroundings of chondrocytes adhered or embedded in the scaffold pore walls was observed in, but the metachromatic staining was not convincing enough.
Chondrocytes were observed as they were attached to the pore walls or some embedded in the walls and even on day 14 there were a number of well attached cells (c). The percentage of round cells, indicting the chondrogenic morphology, is presented in . The changes in the percentage of round shapes over time were significant in both groups (p < 0.01) and became the most dominant cell shape by day 14. The percentage of the round shape chondrocytes in catechin-loaded scaffolds was significantly higher on days 5, 8 and 14 (p < 0.05) compared to scaffolds without catechin.
Figure 4. Histology of the chondrocyte seeded scaffolds. A. Chondrocytes are attached to scaffolds well and exhibited metachromatic staining. B. At the 14th day of the culture, chondrocytes with metachromatic staining can be seen C. Chondrocyte attachments onto the wall pore (arrows), D. Collagen type II immunoreactive chondrocytes (arrows) and non-immunoreactive chondrocytes (arrow head). Toluidine blue staing (A and B), hematoxylin&Eosin (C) and Collagen type immunoflourecence with FITC maker and propidium iodide nuclear staining. Bar = 80 μm in A, B, and C and = 160 μm.
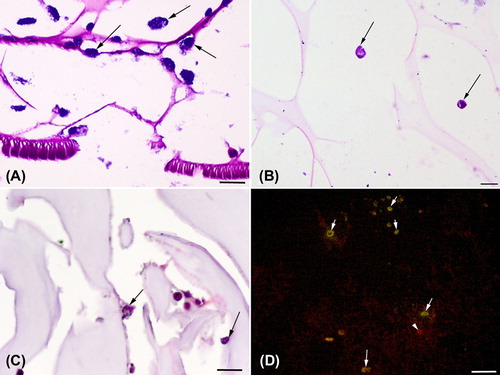
Table IV. The percentage of round chondrocytes at different time point in alginate-chitosan scaffolds.
Immunostaining
No convincing collagen type II immunoreactivity was observed in either group at any time points. On the other hand, collagen type II immunoreactive chondrocytes were observed in both groups (c). presents the percentage of collagen type II immunoreactive chondrocytes. The increase in the percentage immunoreactive chondrocytes was statistically significant among different time points (p < 0.001), but there was no differences between scaffolds with or without catechin at any time points (p > 0.05).
Table V. The percentage of collagen type II immunoreactive chondrocytes at different time point in alginate-chitosan scaffolds.
Discussion
One of the aims of this study was to fabricate a porous alginate-chitosan scaffold that can facilitate catechin release for a longer period of time so that we can test possible catechin effects on chondrocytes in a 3 dimensional environment at different time points. We fabricated scaffolds using various concentrations (100–500 mg/100 ml) of high and low molecular chitosan and alginate solutions (1–5%) and evaluated them for catechin release and structural integrity. The best result was obtained with the high molecular weight chitosan (500 mg/100 ml) and 5% alginate solution as the catechin release can still be detected at the 19th day with no detectable loss of structural integrity of the scaffold. The other scaffolds either lost the structural integrity or released catechin totally in a short period of time.
The porous structure is a desired feature in scaffolds as pores allow material transport within the scaffold that enables cells to reach nutrients. During the characterization studies, we measured the pore size as 50–350 μm, a preferred range for cell growth (Li and Zhang Citation2005, Hsu et al. Citation2004) for scaffolds to be used in cartilage engineering. Ideal scaffolds are expected to allow cell survival, material transport to inside to outside, deposition of newly synthesized matrix beside biocompatibility and self degradation after retention of the integrity for some period of time (Glowacki Citation2000, Chang et al. Citation2005, Kisiday et al. Citation2002). In addition to above, scaffolds to be used in hyaline cartilage engineering should also promote chondrocyte phenotype. Induction of collagen type II expression is one of the parameters to show chondrogenic potential of a tested material (Chung et al. Citation2011). Li and Zhang (Citation2005) claimed that alginate-chitosan porous scaffolds are suitable for chondrocyte attachment, cell proliferation and collagen type II synthesis. The alginate-chitosan scaffold we fabricated in this study is also suitable for cell attachment as revealed by SEM analyses. PCR analyses as well as histology and immunoflourecence examinations also indicated that the alginate-chitosan scaffolds we fabricated promoted hyaline chondrocyte phenotype. In PCR analyses, expression of collagen type I disappeared at day 14, indicating a complete redifferentiation of dedifferentiated cells. Likewise, the percentage of round cells and collagen type II immunoreactive cells increased over time. Furthermore, the amount of DNA increased especially during the first 5 days of 3D culture. Although the increased DNA content was eventually decreased during the second half of the 3D culture, the amount of DNA at the day of the last measurement, day 18, was at least two times higher that of day 0 in scaffolds with or without catechin. Thus, the alginate-chitosan matrix we fabricated through this study seems to promote cell proliferation to a certain degree. The decrease in DNA content is likely related to cell detachment from the surface and pore walls. The detached cells were eventually discharged during the medium change of the culture. In Li and Zhang (Citation2005) study, proliferation of HTB-94 cells, human chondrosarcoma cell line, continued for a longer time in the alginate-chitosan scaffold at least until the 21st day of the culture. In our study, we used chondrocytes isolated from articular cartilage of young calves. Further studies should be conducted to determine if there is a significant difference between HTB-94 cells and regular chondrocytes by means of cell attachment and proliferation in alginate-chitosan scaffolds.
Catechin is beneficial in degenerative joint disease due to the fact that it exerts some protective properties on chondrocytes even at very low concentrations (Adcocks et al. Citation2002, Ahmed Citation2010) It was reported that 20 μmol of catechin can inhibit proteoglycan and type II collagen breakdown in vitro (Adcocks et al. Citation2002). The inhibitory effect was even potentiated when catechin used in combination with avocado soybean unsaponifiables. Another in vitro study concluded that catechin used at various concentrations (20–160 μM) inhibited collagenase activity in a dose-depended manner (Madhan et al. Citation2007). Catechin (100–200 μM) inhibits interleukin-1β- induced expression of matrix metalloproteinase-1 and -13 in human chondrocytes (Ahmed et al. Citation2004). Another study concluded that catechin (25–200 μM) inhibited expressions of TNF-α and of matrix metalloproteinase-13 in glycation end product-activated human chondrocytes. In a relatively recent study, Heinecke et al. (Citation2010) tested various concentrations (4–400 ng/ml] of catechin in vitro, and they found that catechin inhibited COX-2 expression and PGE2 syntheses in chondrocytes. In our study, to decide catechin concentrations to be used in the experiment we tried very low concentrations in 2D and 3D cultures. As we did not observe any effects on cell proliferations and GAG synthesis, we decided to use 75 μg/ml at which we observed some effects on some parameters to show chondrogenic potentials. In the present study, we investigated catechin effects on bovine chondrocytes seeded on the alginate-chitosan matrix chondrocytic adaptation and survival in three dimensional cultures. We found that the amount of DNA increased especially during the first 5 days in scaffolds with or without catechin. Importantly, the amount of DNA was always higher in catechin loaded scaffolds at any time points; however, the difference was significant only at days 3, 8 and 12 and tends to be significant at day 5. Thus, we think that catechin seems to have some protective properties, especially during the first 12 days of the 3D culture, on chondrocytes seeded on alginate-chitosan scaffolds.
As also employed in the present study, GAG content is another parameter to show chondrogenic potentials (Valonen et al. Citation2010). We determined the GAG content using dimethylene blue method, in which dimethylene blue reacts with sulfate groups of glycosaminoglycans, resulting in color changes that can be determined spectrophotometrically at 535 nm wavelength (Enobakhare et al. Citation1996). In our study, the GAG content increased over time in scaffolds with or without catechin although it seemed to be steady or even declined to a small degree after day 12. However, the degree of decline in GAG content was not as dramatic as in DNA content. The drop in DNA content began after day 5 in scaffolds devoid of catechin and after day 8 in catechin loaded scaffolds, suggesting that the alginate-chitosan scaffold we fabricated through this study promotes GAG synthesis in bovine chondrocytes. Catechin seems to have some effects on GAG synthesis in chondrocytes especially during the first 12 days. However, the catechin effects on GAG content did not turn out to be statistically significant.
One of the characteristics of hyaline chondrocytes is their typical round shape, and thus, the carrier matrices to be used in cartilage engineering are expected either to protect or to facilitate regaining the round chondrocyte morphology (Mohan and Nair Citation2010). The porous alginate-chitosan scaffold fabricated in this study was successful to meet this criterion as the percentage of round chondrocytes was significantly higher on day 14 compared to that of day 3. Catechin seems to have some chondrogenic effects on chondrocytes as the percentage of round chondrocyte is higher catechin-loaded scaffolds.
Metachromatic dyes such as toluidine blue, alcian blue, safranin O are used to localize GAG presence and often used to determine chondrogenic capacity as chondrocytes synthesize GAG in bulk quantity (Lee et al. Citation2004). In our study, chondrocytes had cytoplasmic metachromatic staining, but metachromasia around the chondrocytes especially those embedded in alginate-chitosan matrix is either absent or very limited. Thus, we raised a question if the alginate- chitosan matrix we fabricated is not suitable for deposition of newly synthesized GAG.
Collagen type II expression is a frequently used parameter to show chondrogenic phenotype (Chung et al. Citation2011, Mahmoudifar and Doran Citation2010). Presence of a strong collagen type II amplification band in PCR analysis conducted prior to seeding onto scaffolds indicated that most chondrocytes had been preserving the chondrogenic phenotype prior to seeding. However, presence of a weaker collagen type I band also indicated that some chondrocytes were in a state of differentiation that lasted at least until the 8th day of the 3D culture. However, collagen type I expression in PCR analysis was totally disappeared at day 14 in the scaffolds with or without catechin. Likewise, immunostaining studies indicated that the percentage of collagen type II immunoreactive cells gradually increased over time, suggesting the alginate-chitosan scaffold is able to promote the chondrogenic phenotype. Collagen type I expression in immunofluorescence examination was not convincingly observed although PCR analyses indicated some expression at days 3, 5 and 8 of the 3D culture. This may indicate a low rate of differentiation. Catechin may have some effect on collagen type II expression by chondrocytes as the percentage of collagen type II immunoreactive cells was slightly higher in catechin-loaded scaffolds; however, such an effect was not convincing enough as no statistically significant differences occurred at any time points of the 3D culture.
In conclusion, the scaffold with a pore size of 50–350 μm fabricated using the high molecular weight chitosan and 5% alginate crosslinked by calcium chloride is effective promoting chondrogenic phenotype. Once it is relased from the carrier matrix, catechin exerts some protective properties, especially during the first 12 days of 3D culture, on chondrocytes seeded on the alginate-chitosan scaffolds.
Declaration of interest
This study was conducted by a grant provided by the Scientific and Technical Research Council of Turkey (Tubitak Project no: 107O681).
References
- Adcocks C, Collin P, Buttle DJ. 2002. Catechins from green tea (Camellia sinensis) inhibit bovine and human cartilage proteoglycan and type II collagen degradation in vitro. J Nutr. 132:341–346.
- Ahmed S, Wang N, Lalonde M, Goldberg VM, Haqqi TM. 2004. Green tea polyphenol epigallocatechin-3-gallate (EGCG) differentially inhibits interleukin-1 beta-induced expression of matrix metalloproteinase-1 and -13 in human chondrocytes. J Pharmacol Exp Ther. 308:767–773.
- Ahmed S. 2010. Green tea polyphenol epigallocatechin 3-gallate in arthritis: progress and promise. Arthritis Res Ther. 12:208.
- Bae JY, Han DW, Matsumura K, Wakitani S, Nawata M, Hyon SH. 2010. Nonfrozen preservation of articular cartilage by epigallocatechin-3- gallate reversibly regulating cell cycle and NF-kappaB expression. Tissue Eng Part A. 16:595–603.
- Chang CH, Lin FH, Kuo TF, Liu HC. 2005. Cartilage tissue engineering. Biomed Eng Appl Basis Comm. 17:1–11.
- Chung CW, Kang JY, Yoon IS, Hwang HD, Balakrishnan P, Cho HJ, et al. 2011. Interpenetrating polymer network (IPN) scaffolds of sodium hyaluronate and sodium alginate for chondrocyte culture. Colloids Surf B Biointerfaces. 88:711–716.
- Chung TW, Yang J, Akaike T, Cho KY, Nah JW, Kim SI, Cho CS. 2000. Preparation of aljinate/galactosylated chitosan scaffold for hepatocyte attachment. Biomaterials. 23:2827–2834.
- Draget K, Skjak-Braek G, Samidsrod D. Alginate based new materials. Int J Biol Macromol. 1997;21:47–55.
- Enobakhare BO, Bader DL, Lee DA. 1996. Quantification of sulfated glycosaminoglycans in chondrocyte/aljinate cultures, by use of 1,9-dimethylmethylene blue. Anal Biochem. 243:189–191.
- Fenercioğlu ŞM. 2003. (In Turkish) Alginate Based Gels. Ankara: Hacettepe University.
- Gille J, Meisner U, Ehlers EM, Muller A, Russlies M, Behrens P. 2005. Migration pattern, morphology and viability of cells suspended in or sealed with fibrin glue: a histomorphologic study. Tissue Cell. 37:339–348.
- Glowacki J. 2000. In vitro engineering of cartilage. J Rehabil Res Dev. 37:171–177.
- Havsteen BH. 2002. The biochemistry and medical significance of the flavonoids. Pharmacol Ther. 96:67–202.
- Heinecke LF, Grzanna MW, Au AY, Mochal CA, Rashmir-Raven A, Frondoza CG. 2010. Inhibition of cyclooxygenase-2 expression and prostaglandin E2 production in chondrocytes by avocado soybean unsaponifiables and epigallocatechin gallate. Osteoarthritis Cartilage. 18:220–227.
- Hoemann CD, Sun J, Legare A, McKee MD, Buschmann MD. 2005. Tissue engineering of cartilage using an injectable and adhesive chitosan-based cell-delivery vehicle. Osteoarthritis Cartilage. 13: 318–329.
- Hsu SH, Whu SW, Hsieh SC, Tsai CL, Chen DC, Tan TS. 2004. Evaluation of chitosan-aljinate-hyaluronate complexes modified by an RGD-containing protein as tissue-engineering scaffolds for cartilage regeneration. Artif Organs. 28:693–703.
- Illum L. 1998. Chitosan and its use as a pharmaceutical excipient. Pharm Res. 15:1326–1331.
- Kapoor M, Howard R, Hall I, Appleton I. 2004. Effects of epicatechin gallate on wound healing and scar formation in a full thickness incisional wound healing model in rats. Am J Pathol. 165:299–307.
- Keeney M, Lai JH, Yang F. 2011. Recent progress in cartilage tissue engineering. Curr Opin Biotechnol. 22:734–740.
- Kim IY, Seo SJ, Moon HS, Yoo MK, Park IY, Kim BC, Cho CS. 2008. Chitosan and its derivatives for tissue engineering applications. Biotechnol Adv. 26:1–21.
- Kisiday J, Jin M, Kurz B, Hung H, Semino C, Zhang S, Grodzinsky AJ. 2002. Self-assembling peptide hydrogel fosters chondrocyte extracellular matrix production and cell division: implications for cartilage tissue repair. Proc Natl Acad Sci USA. 99:9996–10001.
- Kuttan R, Donnelly PD, Di Ferrante N. 1981. Collagen treated with (+) catechin becomes resistant to the action of mammalian collagenase. Experientia. 37:221–223.
- Lee JE, Kim SE, Kwon IC, Ahn HJ, Cho H, Lee SH, et al. 2004. Effects of a chitosan scaffold containing TGF-beta1 encapsulated chitosan microspheres on in vitro chondrocyte culture. Artif Organs. 28: 829–839.
- Li Z, Ramay HR, Hauch KD, Xiao D, Zhang M. 2005. Chitosan-aljinate hybrid scaffolds for bone tissue engineering. Biomaterials. 26: 3919–3928.
- Li Z, Zhang M. 2005. Chitosan-alginate as scaffolding material for cartilage tissue engineering. J Biomed Mater Res A. 75:485–493.
- Madhan B, Krishnamoorthy G, Rao JR, Nair BU. 2007. Role of green tea polyphenols in the inhibition of collagenolytic activity by collagenase. Int J Biol Macromol. 41:16–22.
- Mahmoudifar N, Doran PM. 2010. Extent of cell differentiation and capacity for cartilage synthesis in human adult adipose-derived stem cells: comparison with fetal chondrocytes. Biotechnol Bioeng. 107:393–401.
- Mohan N, Nair PD. 2010. A synthetic scaffold favoring chondrogenic phenotype over a natural scaffold. Tissue Eng Part A. 16:373–384.
- Rasheed Z, Anbazhagan AN, Akhtar N, Ramamurthy S, Voss FR, Haqqi TM. 2009. Green tea polyphenol epigallocatechin-3-gallate inhibits advanced glycation end product-induced expression of tumor necrosis factor-alpha and matrix metalloproteinase-13 in human chondrocytes. Arthritis Res Ther. 11: R71.
- Rowley JA, Madlambayan G, Mooney DJ. 1999. Alginate hydrogels as synthetic extracellular matrix material. Biomaterials. 20:45–53.
- Sin BY, Kim HO. 2005. Inhibition of collagenase by naturally occurring flavonoids. Arch Pharm Res. 28:1152–1155.
- Singh R, Ahmed S, Islam N, Goldberg VM, Haqqi TM. 2002. Epigallocatechin-3-gallate inhibits interleukin-1beta-induced expression of nitric oxide synthase and production of nitric oxide in human chondrocytes: suppression of nuclear factor kappaB activation by degradation of the inhibitor of nuclear factor kappaB. Arthritis Rheum. 46:2079–2086.
- Suh J-FK, Matthew HWT. 1999. Application of chitosan based polysation biomaterials in cartilage tissue engineering. A review. Biomaterials. 21:2589–2598.
- Tiyaboonchai W, Woiszwillo J, Sims RC, Middaugh CR. 2003. Insulin containing polyethylenimine-dextran sulfate nanoparticles. Int J Pharm. 255:139–151.
- Valonen PK, Moutos FT, Kusanagi A, Moretti MG, Diekman BO, Welter JF, et al. 2010. In vitro generation of mechanically functional cartilage grafts based on adult human stem cells and 3D-woven poly(epsilon-caprolactone) scaffolds. Biomaterials. 31:2193–2200.
- Wee S Gombotz WR. 1998. Protein release from aljinate matrices. Adv Drug Deliv Rev. 31:267–285.