Abstract
Oxidative stress is a risk factor for chronic diseases and was previously shown to be independently associated with obesity. The authors investigated the relationship between body mass index (BMI), age and oxidative stress on 2190 subjects undergoing a health care examination. Total antioxidant status (TAS), total peroxides (TOC) and autoantibodies against oxidized LDL (oLAb) were used as oxidative stress biomarkers in addition to serum lipoproteins, bilirubin and uric acid. Gender-specific differences were observed for age, BMI, serum concentrations of bilirubin, low-density lipoprotein (LDL), uric acid and TAS, all of which were higher in males (p < 0.001), while high-density lipoprotein (HDL), HDL/LDL ratio and TOC were higher in females (p < 0.001). Total cholesterol (p < 0.05) and LDL were increased (p < 0.05), while HDL was decreased (p < 0.05) in overweight and obese subjects. This was accompanied by increased uric acid and TAS concentrations. Lowest oLAb titers were detected in obese subjects. In extremely obese subjects, increased TOC and decreased TAS were observed in spite of high uric acid levels. These results demonstrate that oxidative stress increases with increasing BMI and age, as a sequel to an impaired antioxidant status, the consumption of oLAbs, an increase of peroxides and uric acid and a disadvantaged lipid profile.
Introduction
Due to almost constant and plentiful availability of food in the Western world, a significant part of the day is spent in the postprandial state, during which vasodilation is impaired in hyperlipidemic and hyperglycemic patients. Other atherogenic factors include decreased physical activity due to a sedentary lifestyle, an unfavorable fatty acid profile in low-density lipoprotein (LDL) as well as lipid hydroperoxides present in the diet. Among other predisposing factors, oxidative stress is associated with obesity and chronic inflammation and is known to be a key factor in the loss of lean body mass and impaired immune function during aging [Citation1–3]. In addition, body mass index (BMI) has been identified as being independently associated with oxidative stress in an American population [Citation4].
Obesity and overweight have been defined as an abnormal or excessive fat accumulation that constitutes a risk to health. A routinely used tool to estimate the amount of adipose tissue is the BMI, while the waist–hip ratio (WHR) is used as an indicator for the individual distribution of adipose tissue, which correlates positively with the intra-abdominal fat accumulation. Both variables show a distinct evolution with age. BMI increases until the age of 40–50 years, followed by a decline thereafter, while WHR increases throughout the life span.
Visceral obesity is associated with the development of insulin resistance, increased lipoprotein synthesis, oxidative stress and a higher risk of developing non-insulin-dependent diabetes mellitus. Hemorrheological functions like decreased fibrinolysis, high blood viscosity and increased erythrocyte aggregability are associated with changes in lipid metabolism. Therefore, an increased BMI might lead to endothelial dysfunction, which is a risk factor for plaque formation and the development of thrombosis [Citation5,Citation6].
Obesity is a state of chronic oxidative stress and obese patients tend to have significantly decreased levels of antioxidants [Citation7]. The association between age, BMI and oxidative stress may indicate contributing factors in the development of chronic diseases related to obesity such as diabetes or cardiovascular disease [Citation8,Citation9]. Numerous methods have been developed for application to body fluids to measure lipid peroxidation products and lipid peroxidation-induced tissue damage. In particular, it was reported that malonaldehyde-high performance liquid chromatography, F2-isoprostanes and 4-hydroxynonenal-enzyme linked immuno assay (HNE-ELISA) could be considered as the most reliable methods to reveal lipid peroxidation in human plasma samples [Citation10–14]. Besides that, the most important way to study oxidative stress is a combination of complementary methods [Citation15].
In the present study, we evaluated the association between oxidative stress and BMI categories in subjects ranging from underweight to extremely overweight (obese – class II) as defined by the World Health Organization (WHO). In this respect, we also considered age, gender, lipids, bilirubin, uric acid and total antioxidant status (TAS), which may affect oxidative stress status either through enhancement or attenuation. For this reason, we used several biomarkers at distinct stages in the course of the lipid peroxidation cascade, i.e. TAS as a screening method to indicate antioxidative capacity, total peroxides (TOC) as primary lipid peroxidation breakdown products and the titer of autoantibodies against oxidized LDL of IgG type (oLAb) as an immunological biomarker against oxidative stress. We hypothesized a gradual increase in oxidative stress and lipid peroxidation with increasing BMI as a consequence of hyperlipidemia and a decrease in antioxidants, which might be associated with diseases like diabetes, coronary heart disease or cancer.
Methods and procedures
Subjects
We screened 2190 subjects (907 males and 1283 females, aged 43 ± 13 years and 41 ± 12 years, respectively) who underwent a health care examination, including a complete medical history, clinical chemistry and electrocardiogram, and gave informed consent to participate in the study. The study protocol was approved by the local ethics committee.
BMI was calculated as weight (kg)/height (m2). Subjects were further divided into five BMI categories as recommended by the WHO (http://apps.who.int/bmi/index.jsp?introPage=intro_3.html): BMI-1 (underweight: BMI < 18.50), BMI-2 (normal range: BMI = 18.50–24.99), BMI-3 (overweight: BMI = 25.00–29.99), BMI-4 (obese – class I: BMI = 30.00–34.99) and BMI-5 (obese – class II: BMI = 35.00–39.99). A subgroup analysis was performed.
Collection of blood samples and preparation
Blood was drawn under resting conditions in a sitting position (Vacuette®, Greiner BioOne, Kremsmünster, Austria). Samples were centrifuged 30 min after collection at 2000g for 10 min. Serum was kept at –20°C until analysis, for a maximum of 4 weeks.
Clinical chemistry
Routine methods were used to determine bilirubin, uric acid and serum lipoproteins (high-density lipoprotein (HDL), LDL and total cholesterol) using reagents from Roche Diagnostics (Graz, Austria) and measured on a Hitachi 902 analyzer (Roche Diagnostics, Graz, Austria).
Total antioxidant status
TAS was measured using a colorimetric assay (Randox Laboratories Ltd., Crumlin, UK). The chromogen ABTS® (2,2′-azino-di[3-ethylbenzthiazoline sulphonate]) was incubated with metmyoglobin and hydrogen peroxide to produce the ABTS radical cation, which is detectable at 37°C due to its blue-green color at 600 nm. The assay is based on the fact that the formation of the radical cation is suppressed by antioxidants in the sample proportionally to their concentration [Citation16]. Results were expressed as mmol/L. Samples were analysed on a Hitachi 902 analyzer (Roche Diagnostics, Graz, Austria).
Total peroxides
Serum total peroxide concentrations were determined with a rapid enzymatic in vitro diagnostic assay, TOC® (Labor Diagnostic Nord, Nordhorn, Germany) as previously described [Citation17]. The assay system is based on a peroxide/peroxidase reaction using 3,5,3′,5′-tetramethylbenzidine (TMB) as substrate. Results were calculated from the linear hydrogen peroxide standard curve. Peroxide levels were specified as µmol H2O2 equivalents.
Determination of autoantibodies against oxidized LDL
Titers of oLAb were measured in serum with a commercial enzyme immunoassay supplied by Biomedica (Vienna, Austria) according to the method of Tatzber and Esterbauer [Citation18]. This ELISA is based on the binding reaction of the 1:50 diluted samples to the LDL previously oxidized by cupric ions and bound to the microtiter wells. Detection was done by binding a secondary, peroxidase-coupled anti-IgG antibody, which permitted colorimetric detection of this enzyme with TMB as substrate. Results were expressed as mU/ml.
Statistics
Statistical analysis was performed using the Sigma-Stat and Sigma-Plot package (SPSS, Erkrath, Germany). One-way analysis of variance was used to analyze differences in the different variables between BMI categories. Bonferroni correction was used to correct for multiple testing. When normality testing failed, the Kruskal–Wallis one-way analysis of variance on ranks was used. All pairwise multiple comparison procedures were done with Dunn’s method. The Mann–Whitney Rank Sum Test was used for gender-specific differences. Results are presented as mean ± SD unless otherwise stated.
Results
BMI, age and gender
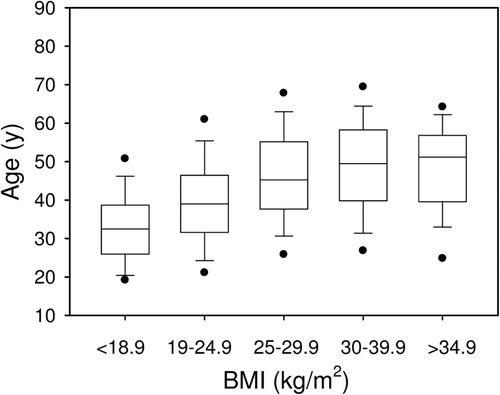
BMI increased significantly with age from BMI-1 to BMI-3 but was in the same range from BMI-3 to BMI-5 (). After Bonferroni correction, age was not statistically different between males (43 ± 13; range 17–83) and females (41 ± 12; range 17–79).
Figure 1. Relationship between BMI and age.
Bilirubin
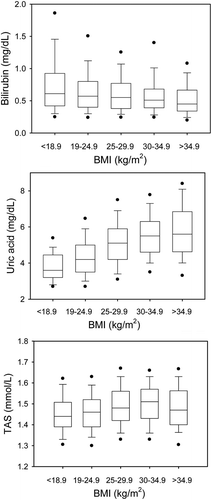
Bilirubin was significantly higher in BMI-1 compared to BMI-4 and BMI-5 (p < 0.001), although it was within normal limits (, upper panel).
Figure 2. Bilirubin, uric acid and TAS in relation to BMI categories.
Uric acid
Uric acid increased from BMI-1 to BMI-5 (, middle panel). Significant differences were found between BMI-1 versus BMI-3, BMI-4 and BMI-5, and further between BMI-2 versus BMI-3, BMI-4 and BMI-5 and, finally, BMI-3 versus BMI-5.
Total antioxidant status
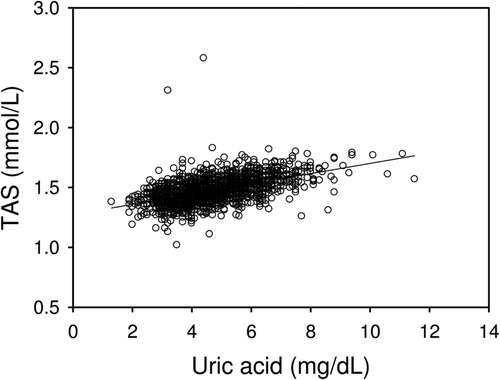
TAS concentrations increased from BMI-1 to BMI-4 and were significantly higher in BMI-3 and BMI-4 versus BMI-1 and BMI-2 (, lower panel). In linear regression analysis, TAS correlated significantly with uric acid (r = 0.503; p < 0.001) ().
Figure 3. Linear correlation between TAS and uric acid.
Total cholesterol
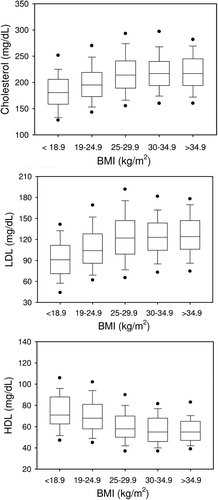
Total cholesterol concentrations increased significantly from BMI-1 to BMI-3, but did not show any further statistically significant difference between BMI-3 to BMI-5 (, upper panel). Linear regression analysis revealed a highly significant correlation of total cholesterol with LDL cholesterol (r = 0.868, p < 0.001).
Figure 4. Lipid status (total cholesterol, LDL, HDL) related to BMI categories.
LDL cholesterol
Given the fact that LDL correlates with total cholesterol, we also observed a significantly linear increase in LDL from BMI-1 to BMI-3. LDL levels did not differ significantly between BMI-3 to BMI-5 (, middle panel).
HDL cholesterol
HDL cholesterol was inversely correlated to LDL cholesterol (r = –0.130, p < 0.001), i.e. highest HDL cholesterol concentrations were observed in BMI-1, which were significantly higher than in all the other BMI categories. HDL cholesterol concentrations in BMI-2 were lower compared to BMI-1 but were still higher (p < 0.001) than those in BMI-3, BMI-4 and BMI-5. The latter were associated with the lowest HDL cholesterol concentrations (, lower panel).
Total peroxides
Total serum peroxide concentrations were in the same range from BMI-1 to BMI-4 but were more than twice as high in BMI-5, which was significantly different from all other BMI categories (, upper panel). In linear regression analysis, peroxide concentrations correlated negatively with uric acid concentrations (r = 0.165, p < 0.001). Peroxides and TAS were negatively correlated with each other (r = –0.171, p < 0.001, Pearson product moment correlation).
Figure 5. Lipid peroxidation biomarkers (peroxides and oLAb) in relation to BMI categories.
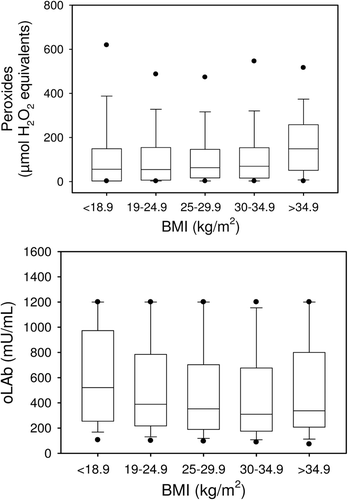
oLAb
The immunological oxidative stress biomarker oLAb decreased from BMI-1 to BMI-4 (, lower panel) and was significantly different between BMI-1 versus BMI-3 and BMI-4 and further between BMI-2 versus BMI-4.
Gender-specific differences
Comparison between males and females revealed several significant gender-specific differences, i.e. BMI, bilirubin, LDL cholesterol, uric acid and TAS were higher in males than in females. On the other hand, HDL cholesterol, the ratio of HDL to LDL cholesterol and TOC were significantly higher in females than in males ().
Table I. Baseline characteristics of the study sample including sex-specific differences.
Discussion
Aging was shown to be associated with an increase of BMI and WHR [Citation19], which is consistent with the results of the present study, indicating an increase from BMI-1 to BMI-3. In the present study, plasma lipids and lipoproteins were significantly correlated with age, BMI and oxidative stress both in males and females. Although the HDL cholesterol levels in females were significantly increased than in males, we observed a decrease in HDL cholesterol with rising BMI in both genders. These results are in agreement with a previous report [Citation20], which additionally indicated a higher risk of hypertension as well as lower cardiovascular fitness in obese and overweight subjects. This is of importance given the key role of HDL as a major carrier of lipid hydroperoxides in human blood [Citation21].
In subjects with the lowest BMI (BMI-1, BMI < 18.50 kg/m2), we observed the highest bilirubin levels (although within normal limits), while obese subjects (BMI-4: BMI = 30.00–34.99 kg/m2, and BMI-5: BMI = 35.00–39.99 kg/m2) showed the lowest levels of this end product of heme catabolism. This is consistent with a previous report [Citation22] that found an inverse association between adiposity and bilirubin. Bilirubin, as an endogenous antioxidant, was shown to be 20 times more effective than the vitamin E homologue trolox in preventing LDL oxidation [Citation23]. In addition, high serum bilirubin concentrations were protective against coronary heart disease [Citation24].
Although males exhibited significantly higher uric acid levels, this purine breakdown product increased with BMI in both genders. Uric acid has been reported to be a very potent endogenous antioxidant and is correlated with the total antioxidant capacity [Citation25]. This was confirmed in the present study (). Uric acid might be increased as a compensatory mechanism to counteract oxidative stress in aging and atherosclerosis [Citation26]. Although uric acid levels are increased in obesity, this seems to be insufficient to compensate for increased oxidative stress as reported previously [Citation25]. In overweight (BMI-3: BMI = 25.00–29.99 kg/m2) and obese subjects (BMI-4) TAS was increased and associated with increased uric acid levels.
In contrast, in extremely obese (BMI-5) subjects, TAS was lower in spite of very high uric acid levels, indicating the consumption of antioxidants due to an excess of reactive oxygen species (ROS) and/or low intake of exogenous antioxidants [Citation27,Citation28]. In addition, in subjects of the BMI-5 category, TOC were roughly doubled as compared to all other BMI categories, indicating explicit oxidative stress in extremely obese subjects. This is a crucial finding with respect to a previous report [Citation29], indicating that uric acid is a risk factor for population samples with increased cardiovascular disease (CVD) risk, because these elevated levels might occur in parallel with ROS.
A high level of body fat accumulation is positively associated with sedentary lifestyle, a state of mild inflammation and increased serum iron concentrations [Citation30]. Inflammation and redox active iron play a key role in the hydroxyl-radical generating Fenton reaction [Citation31,Citation32]. This pro-oxidant state might explain that BMI-5 subjects were associated with peak levels of TOC, which are breakdown products of oxidized polyunsaturated fatty acids and proteins. These peroxides are precursor metabolites of F2-isoprostanes [Citation10] that correlate with each other [Citation33]. This finding corresponds to increased lipid hydroperoxides in obese individuals as reported previously [Citation34]. Low-grade inflammation in obese subjects has already been shown in a study from Japan [Citation35], and associations with TOC were also reported for patients with myocardial infarction [Citation36]. It is noteworthy, that peroxide levels in females were higher by a factor of 3 compared to those of males. This interesting finding corresponds to increased isoprostane levels in females, as previously reported by Keaney et al. [Citation4] and Block et al. [Citation37].
Autoantibodies against oxidized LDL seem to provide a protective mechanism against oxidative stress, as indicated by an inverse relationship between carotid intima-media thickness and plasma concentrations of oxidized LDL (oxLDL) in healthy subjects [Citation38,Citation39]. This biomarker was also shown to be associated with performance in competitive sports [Citation40]. Therefore, oLAbs are an immunological response against oxidized LDL and indicate the occurrence of lipid peroxidation in vivo. oLAb thus has been suggested as a biomarker for the evaluation of in vivo LDL oxidation in the clinical setting of high-risk carotid atherosclerosis [Citation41]. We observed an inverse relationship between oLAb titers and age and a significant decrease in oLAb in BMI-4 subjects, i.e. obese subjects. This was further accompanied by an increase in the disadvantageous lipoproteins total cholesterol and LDL, and a decrease in HDL. This is in accordance with the concept that the immune response might be anti-atherogenic rather than pro-atherogenic as offered by the report of Shoji et al. [Citation39], showing an inverse relationship between circulating oxidized LDL and antibody titers against oxidized LDL in healthy subjects, as well as by Tinahones et al. [Citation42] showing that females and young persons have a higher prevalence of increased levels of antibody titers against oxidized LDL.
In conclusion, the data presented demonstrate that even BMI-3 (i.e. overweight) subjects are at risk for oxidative stress and associated biochemical modifications, e.g. a less favorable ratio of LDL to HDL as well as increased uric acid levels and a decreased oLAb titer. Furthermore, oxidative stress worsens with increasing stages of obesity and especially BMI-5 (obese – class II) subjects are exposed to excess ROS and have an elevated risk for cardiovascular disease as indicated by twice as high levels of TOC, a compensatory increase in uric acid (in spite of a simultaneous decrease in TAS) and a decrease in protective oLAb as a consequence of their binding to respective epitopes. Therefore, males with increasing age and BMI are of particular risk to oxidative stress [Citation43], which was shown to be additionally associated with insulin resistance [Citation44], low sperm concentration [Citation45] and erectile dysfunction [Citation46].
Acknowledgements
The first author (WW) dedicates this work to his parents. Language editing was done by Eugenia Lamont. The authors gratefully acknowledge the scientific advice and support of Günter Jürgens and Karl Öttl.
Declaration of Interest: The authors have no competing interests to declare.
References
- Grimble RF. Inflammatory response in the elderly. Curr Opin Clin Nutr Metab Care 2003;6:21–29.
- Hopps E, Noto D, Caimi G, Averna MR. A novel component of the metabolic syndrome: the oxidative stress. Nutr Metab Cardiovasc Dis 2010;20:72–77.
- Frohnert BI, Sinaiko AR, Serrot FJ, Foncea RE, Moran A, Ikramuddin S, Choudry U, Bernlohr DA. Increased adipose protein carbonylation in human obesity. Obesity (Silver Spring) 2011;19:1735–1741.
- Keaney JFJr, Larson MG, Vasan RS, Wilson PW, Lipinska I, Corey D, Massaro JM, et al.; Framingham Study. Obesity and systemic oxidative stress: clinical correlates of oxidative stress in the Framingham Study. Arterioscler Thromb Vasc Biol 2003;23:434–439.
- Serrano Rios M. Relationship between obesity and the increased risk of major complications in non-insulin-dependent diabetes mellitus. Eur J Clin Invest 1998;28:S14–S17.
- Ferrannini E, Camastra S. Relationship between impaired glucose tolerance, non-insulin-dependent diabetes mellitus in obesity. Eur J Clin Invest 1998;28:S3–S7.
- Vincent HK, Innes KE, Vincent KR. Oxidative stress and potential interventions to reduce oxidative stress in overweight and obesity. Diabetes Obes Metab 2007;9:813–839.
- Norris AL, Steinberger J, Steffen LM, Metzig AM, Schwarzenberg SJ, Kelly AS. Circulating oxidized LDL and inflammation in extreme pediatric obesity. Obesity (Silver Spring) 2011;19:1415–1419.
- Urakawa H, Katsuki A, Sumida Y, Gabazza EC, Murashima S, Morioka K, Maruyama N, et al. Oxidative stress is associated with adiposity and insulin resistance in men. J Clin Endocrinol Metab 2003;88:4673–4676.
- Montuschi P, Barnes PJ, Roberts LJ 2nd. Isoprostanes: markers and mediators of oxidative stress. FASEB J 2004;18:1791–1800.
- Zarkovic N. 4-hydroxynonenal as a bioactive marker of pathophysiological processes. Mol Aspects Med 2003;24:281–291.
- Spickett CM, Wiswedel I, Siems W, Zarkovic K, Zarkovic N. Advances in methods for the determination of biologically relevant lipid peroxidation products. Free Radic Res 2010;44:1172–1202.
- Borovic S, Rabuzin F, Waeg G, Zarkovic N. Enzyme-linked immunosorbent assay for 4-hydroxynonenal-histidine conjugates. Free Radic Res 2006;40:809–820.
- Esterbauer H, Schaur RJ, Zollner H. Chemistry and biochemistry of 4-hydroxynonenal, malonaldehyde and related aldehydes. Free Radic Biol Med 1991;11:81–128.
- Prior RL, Cao G. In vivo total antioxidant capacity: comparison of different analytical methods. Free Radic Biol Med 1999;27:1173–1181.
- Rice-Evans C, Miller NJ. Total antioxidant status in plasma and body fluids. Meth Enzymol 1994;234:279–293.
- Tatzber F, Griebenow S, Wonisch W, Winkler R. Dual method for the determination of peroxidase-activity and total peroxides – Iodide leads to a significant increase of peroxidase-activity in human sera. Anal Biochem 2003;316:147–153.
- Tatzber F, Esterbauer H. Free Radicals IX: Autoantibodies to oxidized low density lipoprotein. London: Richelieu Press; 1995. pp 245–267.
- Jankowska EW, Medras M, Rogucka EA. Body mass index, waist/hip ratio and androgen-estrogen activity in younger versus older Polish men. Aging Male 2000;3:177–184.
- Mar Bibiloni M, Martínez E, Llull R, Maffiotte E, Riesco M, Llompart I, Pons A, Tur JA. Metabolic syndrome in adolescents in the Balearic Islands, a Mediterranean region. Nutr Metab Cardiovasc Dis 2011;21:446–454.
- Bowry VW, Stanley KK, Stocker R. High density lipoprotein is the major carrier of lipid hydroperoxides in human blood plasma from fasting donors. Proc Natl Acad Sci USA 1992;89:10316–10320.
- Madhavan M, Wattigney WA, Srinivasan SR, Berenson GS. Serum bilirubin distribution and its relation to cardiovascular risk in children and young adults. Atherosclerosis 1997;131:107–113.
- Wu TW, Fung KP, Yang CC. Unconjugated bilirubin inhibits the oxidation of human low density lipoprotein better than Trolox. Life Sci 1994;54:477–481.
- Onat A, Can G, Ornek E, Cicek G, Ayhan E, Dogan Y. Serum gamma-glutamyltransferase: Independent predictor of risk of diabetes, hypertension, metabolic syndrome, and coronary disease. Obesity (2 June) 2011. doi:10.1038/oby.2011.136.
- Mikami T, Yoshino Y, Ito A. Does a relationship exist between the urate pool in the body and lipid peroxidation during exercise? Free Radic Res 2000;32:31–39.
- Nieto FJ, Iribarren C, Gross MD, Comstock GW, Cutler RG. Uric acid and serum antioxidant capacity: a reaction to atherosclerosis? Atherosclerosis 2000;148:131–139.
- Lindschinger M, Nadlinger K, Adelwöhrer N, Holweg K, Wögerbauer M, Birkmayer J, Smolle KH, Wonisch W. Oxidative stress: potential of distinct peroxide determination systems. Clin Chem Lab Med 2004;42:907–914.
- Stanger O, Semmelrock HJ, Wonisch W, Bös U, Pabst E, Wascher TC. Effects of folate treatment and homocysteine lowering on resistance vessel reactivity in atherosclerotic subjects. J Pharmacol Exp Ther 2002;303:158–162.
- Lippi G, Montagnana M, Franchini M, Favaloro EJ, Targher G. The paradoxical relationship between serum uric acid and cardiovascular disease. Clin Chim Acta 2008;392:1–7.
- Kuno T, Hozumi M, Morinobu T, Murata T, Mingci Z, Tamai H. Antioxidant vitamin levels in plasma and low density lipoproteins of obese girls. Free Radic Res 1998;28:81–86.
- Sies H, Stahl W, Sevanian A. Nutritional, dietary and postprandial oxidative stress. J Nutr 2005;135:969–972.
- Davì G, Guagnano MT, Ciabattoni G, Basili S, Falco A, Marinopiccoli M, Nutini M, et al. Platelet activation in obese women: role of inflammation and oxidant stress. JAMA 2002;288:2008–2014.
- Winklhofer-Roob BM, Meinitzer A, Maritschnegg M, Roob JM, Khoschsorur G, Ribalta J, Sundl I, et al.; VITAGE Study Group. Effects of vitamin E depletion/repletion on biomarkers of oxidative stress in healthy aging. Ann N Y Acad Sci 2004;1031:361–364.
- Brown LA, Kerr CJ, Whiting P, Finer N, McEneny J, Ashton T. Oxidant stress in healthy normal-weight, overweight, and obese individuals. Obesity (Silver Spring) 2009;17:460–466.
- Suzuki K, Ito Y, Ochiai J, Kusuhara Y, Hashimoto S, Tokudome S, Kojima M, et al.; JACC Study Group. Relationship between obesity and serum markers of oxidative stress and inflammation in Japanese. Asian Pac J Cancer Prev 2003;4:259–266.
- Nikolic-Heitzler V, Rabuzin F, Tatzber F, Vrkic N, Bulj N, Borovic S, Wonisch W, et al. Persistent oxidative stress after myocardial infarction treated by percutaneous coronary intervention. Tohoku J Exp Med 2006;210:247–255.
- Block G, Dietrich M, Norkus EP, Morrow JD, Hudes M, Caan B, Packer L. Factors associated with oxidative stress in human populations. Am J Epidemiol 2002;156:274–285.
- Fukumoto M, Shoji T, Emoto M, Kawagishi T, Okuno Y, Nishizawa Y. Antibodies against oxidized LDL and carotid artery intima-media thickness in a healthy population. Arterioscler Thromb Vasc Biol 2000;20:703–707.
- Shoji T, Nishizawa Y, Fukumoto M, Shimamura K, Kimura J, Kanda H, Emoto M, et al. Inverse relationship between circulating oxidized low density lipoprotein (oxLDL) and anti-oxLDL antibody levels in healthy subjects. Atherosclerosis 2000;148:171–177.
- Schippinger G, Fankhauser F, Abuja PA, Winklhofer-Roob BM, Nadlinger K, Halwachs-Baumann G, Wonisch W. Competetive and seasonal oxidative stress in elite alpine ski racers. Scand J Med Sci Sports 2009;19:206–212.
- Chiesa R, Melissano G, Castellano R, Astore D, Marone EM, Grossi A, Maggi E, et al. In search of biological markers of high-risk carotid artery atherosclerotic plaque: enhanced LDL oxidation. Ann Vasc Surg 1998;12:1–9.
- Tinahones FJ, Gómez-Zumaquero JM, Garrido-Sánchez L, García-Fuentes E, Rojo-Martínez G, Esteva I, Ruiz de Adana MS, et al. Influence of age and sex on levels of anti-oxidized LDL antibodies and anti-LDL immune complexes in the general population. J Lipid Res 2005;46:452–457.
- Cakatay U, Aydin S, Yanar K, Uzun H. Gender-dependent variations in systemic biomarkers of oxidative protein, DNA, and lipid damage in aged rats. Aging Male 2010;13:51–58.
- Karolkiewicz J, Pilaczynska-Szczesniak L, Maciaszek J, Osinski W. Insulin resistance, oxidative stress markers and the blood antioxidant system in overweight elderly men. Aging Male 2006;9:159–163.
- Sekhavat L, Moein MR. The effect of male body mass index on sperm parameters. Aging Male 2010;13:155–158.
- Blumentals WA, Gomez-Caminero A, Joo S, Vannappagari V. Is erectile dysfunction predictive of peripheral vascular disease? Aging Male 2003;6:217–221.