
Abstract
Aims and Methods: This was a 6-month, open label, multinational, observational study in hypogonadal men treated with daily titrated dose of 50, 75, or 100 mg 1% testosterone gel (AndroGel®) in community practice. Primary outcome was effect of treatment on hypogonadal symptoms and quality of life as assessed by Aging Males’ Symptoms (AMS) scale. Secondary objectives included erectile dysfunction (International Index of Erectile Function [IIEF]), fatigue (Multidimensional Fatigue Inventory [MFI]), and surrogates for body composition (waist circumference, body mass index [BMI]).
Results: Seven hundred and ninety-nine of the 1053 men enrolled had follow-up data at 6 months, 81.2% had ≥1 testosterone value in the normal range during the study. Substantial and significant improvements were observed in mean AMS score (−29%), IIEF score (+115.7%), and MFI scores (−21.5%). Further beneficial effects were significant decreases in mean BMI (−0.8 kg/m2) and waist circumference (−3.3 cm). Younger age quartiles showed greater improvements in AMS, MFI, BMI, and waist circumference than older quartiles. IIEF scores, however, did not differ significantly by age category.
Conclusions: Substantial improvements in hypogonadal symptoms, quality of life, fatigue, erectile dysfunction, and libido/sexual desire were observed. Adverse drug reactions were experienced by 7.5% of the safety population over the 6-month study period.
Introduction
Male hypogonadism is a clinical syndrome resulting from failure of the testes to produce physiological levels of testosterone (T) caused by the disruption at one or more levels of the hypothalamic–pituitary–gonadal axis [Citation1]. A morning total testosterone level below approximately 10.4 nmol/L (300 ng/dL) is considered to be below normal and has a greater likelihood of causing symptoms [Citation1]. The International Society of Andrology (ISA), International Society for the Study of the Aging Male (ISSAM), and the European Association of Urology (EAU) recommend that levels above a threshold of 12 nmol/L (346 ng/dL) are normal; whereas levels below 8 nmol/L (231 ng/dL) demonstrate overt hypogonadism [Citation2]. This study was primarily designed to investigate the effect of a 1% testosterone gel (T gel) on (1) the symptoms of hypogonadism and quality of life, as assessed by the Aging Males’ Symptoms (AMS) scale [Citation3] after 6 months of therapy under real life, standard clinical practice, as opposed to a strict clinical trial scenario, and (2) to perform subgroup analyses based on the age quartiles of the patients.
Several studies have shown an increase in hypogonadism with advancing age [Citation4–8]. According to a recent European Commission report, the share of the population in the 27 European Union member countries aged 65 years or older is anticipated to increase from 17.1% in 2008 to 30.0% in 2060, and the number of people aged 80 years or older is projected to increase from 21.8 million to 61.4 million over the same time period [Citation9]. As male hypogonadism increases with age, and the population of older men increases, physicians are more likely to see these men appearing for treatment.
Hypogonadism is associated with various symptoms and disease states that have significant effects on morbidity and mortality, as well as on quality of life. Symptoms include reduced libido, erectile dysfunction, fatigue, depression, changes in body composition, and in severe, long-standing cases, osteoporosis [Citation10]. It has been shown that low total T and sex-hormone–binding globulin are associated with an increased risk of developing the metabolic syndrome (MetSyn) [Citation11]. Several studies have revealed that the components of MetSyn, which include hypertension, hyperlipidemia, diabetes, and obesity, are more prevalent among hypogonadal men than men with normal T levels [Citation11–14]. The Hypogonadism in Males study revealed that the odds ratios for hypogonadism were 1.47 in men with hyperlipidemia, 1.84 in men with hypertension, 2.09 in men with diabetes, and 2.38 in obese men, compared with men without these conditions [Citation7].
Testosterone replacement therapy (TRT) is indicated in males for conditions associated with a deficiency or absence of endogenous testosterone (primary, and secondary or hypogonadotropic hypogonadism) [Citation1,Citation15,Citation16]. TRT has been shown to improve sexual function, decrease body fat, increase lean muscle mass and function, increase bone mass [Citation17–23], and enhance survival [Citation24] in hypogonadal men. In addition, it may have beneficial effects on mood [Citation18,Citation20,Citation23,Citation25].
AndroGel® (AbbVie, North Chicago, IL, also marketed by various companies in different countries under the name Androtop® and Testogel®; manufactured by Besins, Paris, France) is a 1% hydroalcoholic T gel that provides continuous transdermal delivery of T for 24 h following a single topical application to the shoulders, upper arm, and/or abdomen. It is approved for the treatment of hypogonadism [Citation26–28].
The primary objective of the Energy, Sexual desire, and body PropoRtions with AndroGel® testosterone 1% gel therapy (ESPRIT) study was to evaluate the effect of 6 months of 1% T gel therapy on the symptoms of hypogonadism and quality of life, as assessed by the AMS scale. It was conducted as an observational study under the real life conditions of clinical practice. Further objectives were to evaluate the effect and time-to-onset of improvement in libido/sexual desire, erectile dysfunction, fatigue, and body proportions of participants. The tolerability of the 1% T gel was also assessed.
Methods
The study asked each participating physician to collect data for all newly diagnosed hypogonadal subjects who had not previously been treated with T, and for whom the physician had decided to prescribe 1% T gel. The study design was previously published [Citation29].
The participating physicians were urologists, endocrinologists, and general practitioners, who had an interest in TRT and were in community clinical practices. Each physician selected a minimum of three patients. The intention was to understand what happens in real life, as opposed to in a formal, clinical trial environment. The study has the ClinicalTrials.gov identifier NCT01143818.
A total of 1053 subjects were chosen by 222 centers between 17 December 2007 and 18 January 2010. Physicians in eight countries participated: Canada, Russia, Croatia, Germany, Slovenia, Saudi Arabia, Romania and the United Arab Emirates. This was an open-labeled study with no control group, and all comparisons were measured as changes from baseline, with a starting dose of 50 mg T per day.
Selection criteria
To be eligible, each subject had to be male, aged 18 years or older, newly diagnosed as hypogonadal, and not previously treated with T. Hypogonadism had to be confirmed by clinical presentation and by biochemical/laboratory tests according to the ISA, ISSAM, and EAU international guidelines current at the time of the study [Citation15]. The 1% T gel was prescribed in accordance with local Summary of Product Characteristics (SPC) (labeling). Subjects were excluded if they had contraindications to T treatment (e.g., carcinoma of the breast, or known, or suspected prostate cancer), or if they were unwilling or unable to sign an informed consent form. All subjects could withdraw from participation at any time, for any reason, and without penalty or loss of the benefits of medical care. A physician could withdraw a patient if it was deemed to be in their best medical interest. Subjects could be terminated from the study due to adverse or serious drug reactions, lack of efficacy, withdrawn consent or for administrative or protocol violation.
Ethics
The study plan was submitted to independent Institutional Review Boards and/or Independent Ethics Committees (IEC) and/or other specific committees for approval prior to starting the study, as required by local regulatory provisions, and the Declaration of Helsinki. An informed consent form was completed by all participants.
Treatment
Topical AndroGel 1% T gel (in sachets) was prescribed according to local SPC (labeling), with a starting dose of 50 mg of T per day. The T gel was applied to the clean, dry, intact skin of shoulders and upper arm, and/or abdomen. To ensure proper dosing, serum T was measured at intervals and doses were adapted to maintain serum levels in the normal range. If the T level was below the normal range, the daily T gel dose could be increased from 50 mg to 75 mg, and from 75 to 100 mg. If the serum T level exceeded the normal range, the daily dose was decreased. If the serum T consistently exceeded the normal range, then the therapy was discontinued. T levels were assessed in the morning, and “normal,” “low,” and “high” levels for total and/or free T were reported on the subject’s form at each visit. These categories were based on the normal range of the investigator’s lab. A category of “not available” was also included.
Outcome measures
Efficacy measurements were scheduled in accordance with the local standard of practice and included the following:
An inclusion/baseline assessment visit
One visit 4 weeks after starting 1% T gel treatment
One visit 3 months after starting the treatment
A final evaluation visit 6 months after starting 1% T gel treatment
All visits were to occur within a ± 4 day window of the intended date.
Five efficacy measures were used. The primary outcome was the AMS scale. Secondary efficacy variables were the International Index of Erectile Function (IIEF) and the Multidimensional Fatigue Inventory (MFI) scale, body mass index (BMI), and waist circumference. Scales were used in order to evaluate symptoms in an objective manner. The changes from baseline to month 6 in total score and in the various domains for each of the measures were analyzed. The change in AMS total score was also analyzed by age quartiles (≤45, 45–53, 53–61, and 61–99 years) and by age group (<50 years and ≥50 years).
A “responder” was defined as a patient with one or more documented total T level within the normal, eugonadal range (per their local lab) while receiving 1% T gel. A “nonresponder” was a patient who had no documented total T level within the normal eugonadal range while receiving 1% T gel.
AMS
The AMS is a self-administered scale designed to assess the symptoms of aging in males, to evaluate quality of life over time, and to measure effects of pre- and postandrogen therapy [Citation3]. Subjects rate symptoms from none (0) to extremely severe (5) for 17 items in three domains: psychological (5 items), somatic (7 items), and sexual (5 items). Total scores range from 17 (minimum) to 85 (maximum).
IIEF
The IIEF is a 15-item scale that evaluates five domains: erectile function, orgasmic function, sexual desire, intercourse satisfaction, and overall satisfaction [Citation30]. The scores range from 0 to 5 on each item with a lower score indicating greater dysfunction. The total score of the IIEF could not be greater than 75 points.
MFI
The MFI is a validated, 20-item scale to assess fatigue (general, physical, and mental), reduced activity, and reduced motivation [Citation31]. Five subscales contain four statements that are rated on a 5-point scale from “yes, that is true,” to “no, that is not true.” Each subscale has a maximum value of 20 and a minimum value of 4. Higher scores on each scale indicate more fatigue severity/reduced activity/reduced motivation. The MFI total score cannot be greater than 100 points or less than 20.
BMI and Waist Circumference
BMI in kilogram per square meter and waist circumference in centimeters were measured at each visit.
Safety measurements
Suspected adverse drug reactions (ADRs) were reported during final visits and follow-up. Suspected ADRs were characterized by severity as mild, moderate, or severe.
Statistical analyses
Statistical analyses were performed using SAS® software (Cary, NC). The last observation carried forward method was used. The percentage and absolute changes between baseline and post baseline visits were analyzed using a paired difference t-test, and 95% confidence intervals were calculated. The data were summarized by responder status.
Results
A total of 1053 subjects in 222 centers were enrolled in the study. The number of subjects in each country was 340 from Canada, 267 from Russia, 134 from Croatia, 91 from Germany, 87 from Slovenia, 69 from Saudi Arabia, 54 from Romania and 11 from the United Arab Emirates.
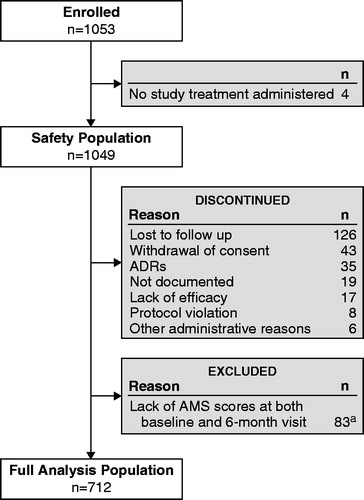
Four (0.4%) patients were excluded from the safety population (n = 1049) because no study treatment was administered.
A total of 337 subjects were not included in the full analysis population as they lacked AMS scores at both baseline and 6-month visits. Seven hundred ninety-nine (77.3%) subjects completed the study. Seven hundred and twelve (67.6%) subjects (with AMS scores at both baseline and 6 months) were included in the full analysis population. shows the flow of subjects through the study.
Figure 1. Flow chart of subject disposition. ADR, adverse drug reaction; AMS, Aging Males’ Symptoms scale. aAn overall total of 337 subjects lacked AMS scores at both baseline and the 6-month visit. This number includes all those who discontinued the study in addition to the 83 who completed the study, but lacked AMS scores.
As this was an observational study, laboratory tests and examinations could not be mandated. Thus, a category of “not available” was also included when reporting data.
Baseline characteristics
summarizes the baseline demographics and characteristics of the analyzed population. Population demographics were similar in both responders (578/712, 81.2%) and nonresponders (134/712, 18.8%) with the exception of smoking. There were more smokers in the responder category (136/550, 24.7%) than in the nonresponder category (16/124, 12.9%). With respect to the subjects’ medical history, abdominal obesity was most frequently reported (in 431/666 (64.7%) of all subjects). Systolic and diastolic blood pressure measures were almost identical in both responder and nonresponder groups; however, there were more subjects with elevated blood pressure in the responder group (322/545, 59.1%) than in the nonresponder group (56/120, 46.7%). Subjects with normal blood pressure but on hypertensive medication were included in the elevated blood pressure category. Reduced high-density lipoprotein cholesterol (HDL-C) (<40 mg/dL or 1.03 mmol/L, or undergoing drug treatment for reduced HDL-C) was reported in about half of the subjects. Elevated triglycerides (≥150 mg/dL or 1.7 mmol/L, or undergoing drug treatment for elevated triglycerides) were reported in about 40% of the subjects.
Table 1. Baseline demographics and characteristics of responders and nonresponders.
Most subjects were being treated by a phosphodiesterase type 5 (PDE5) inhibitor (578/666, 86.8%), insulin or oral hypoglycemics (528/678, 77.9%), and/or lipid lowering products (466/666, 70.0%). Antihypertensives were used in 402/681 (59.0%).
According to the National Cholesterol Education Program Expert Panel on Detection, Evaluation, and Treatment of High Blood Cholesterol in Adults (NCEP/ATP III) criteria [Citation32], in which three of the five measurements were present, MetSyn was present in half of the subjects (345/683, 50.5%).
Testosterone
The mean baseline morning total T level cannot be summarized as the blood was taken in multiple different laboratories with different normal ranges and assay techniques. For all patients included, the attending physician had to check that the hypogonadism was present as confirmed by clinical features and biochemical tests according to international guidelines.
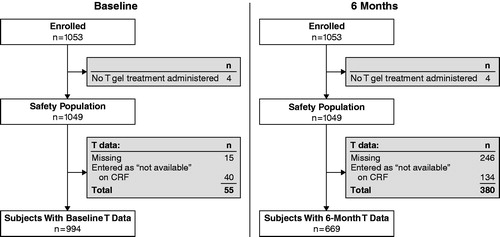
Out of 1053 enrolled subjects, 1049 received at least 1 dose of 1% T gel. Fifty-five subjects had no T data at baseline (the treating physicians did not provide T data for 40 subjects and 15 physicians recorded the T level on the case report form as “missing”); leaving 994 subjects with baseline T levels recorded (). Of these 994 subjects, 831 (83.6%) had low T and 158 (15.9%) had normal T levels. After 6 months of treatment, 669 subjects had their T levels recorded and 380 had no T data. Out of these 669 subjects, 113 (16.9%) had low T and 535 (80%) had normal T levels. Conclusions are similar for the morning free T and calculated free T values.
Figure 2. Flow chart showing T data at baseline and after 6 months of treatment. CRF, case report form; T, testosterone.
There were few changes in T dosage reported at each follow-up visit (less than 8.7% of subjects). At the 4-week visit, the dosage was increased to 75 mg for 26/681 patients (3.8%), to 100 mg for 8/681 patients (1.2%), and decreased to 25 mg for 7/681 patients (1.0%). At the 3-month visit, the dosage was increased to 50 mg for 2/689 patients (0.3%), to 75 mg for 21/689 (3.0%), and to 100 mg for 17/689 (2.5%).The dosage decreased to 50 mg for 2/689 patients (0.3%) and to 25 mg for 9/689 patients (1.3%). The predominant reasons given for changing the dosage were to adjust the patient’s T level, to provide hypogonadal symptom relief, or a combination of both. Suspected ADRs were given as the reason for changing the dosage for 2/681 (0.3%) patients at the 4-week visit and 3/689 (0.4%) patients at the 3-month visit.
Changes in AMS total score
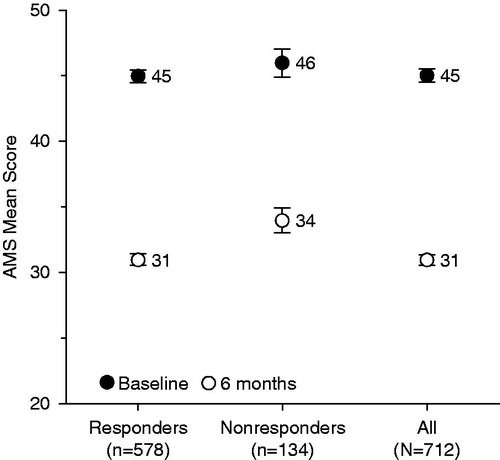
shows the change in mean AMS total scores over 6 months according to responder status. In both groups, AMS total score decreased significantly (p < 0.0001 for both); not surprisingly, the change over 6 months was greater in the responders than nonresponders. However, mean absolute change was −14.7 ± 12.0 for responders and −12.1 ± 11.9 for nonresponders (p = 0.0285), and mean relative changes were −30.3% ± 22.3% for responders and −23.7% ± 23.3% for nonresponders (p = 0.0024). This responder/nonresponder difference effect was significant for each AMS subscore (psychological, somatic, and sexual). The difference, though, was small among groups, with the responders and nonresponders showing a difference of only three points, and responders and the overall group showing no difference.
Figure 3. Change in mean AMS total scores over 6 months according to responder status. AMS, Aging Males’ Symptoms scale. Error bars are standard error of mean.
At baseline, the mean total AMS scores were not significantly different between patients aged <50 years (46 ± 12) and those aged ≥50 years (45 ± 12). AMS scores decreased significantly over 6 months in both age groups, although the decrease in men aged <50 years was significantly greater (mean absolute change −16.1 ± 11.9) compared with the ≥50 year group ( −12.6 ± 11.7, p = 0.0001). The relative change was also significantly greater in the <50 year age group (−33.4% ± 21.1% versus −25.5% ± 22.9%, p < 0.0001).
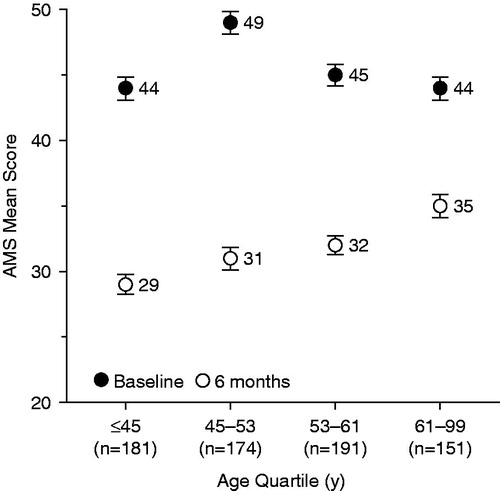
shows the 6-month changes in mean AMS total scores according to age quartile. At baseline, mean AMS scores were significantly different between age quartiles (p = 0.0005). The absolute mean and relative mean decreases between baseline and 6-month visits were significantly different between age groups (p < 0.0001). The decreases tended to be more marked in younger than in older subjects.
Figure 4. Change in mean AMS total scores over 6 months according to age quartile. AMS, Aging Males’ Symptoms scale. Error bars are standard error of mean.
Changes in IIEF total score
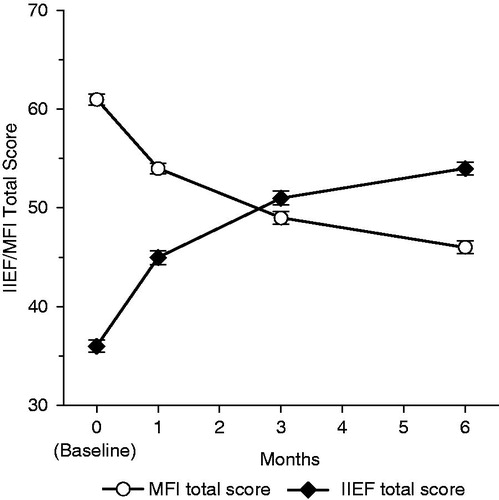
shows the change in the mean IIEF total score over 6 months of treatment for responders and nonresponders. In both responders and nonresponders, mean total IIEF scores increased significantly (p < 0.0001 in both) over 6 months. The 6-month increase shown by responders was not significantly greater than that shown by nonresponders for either mean absolute change (18.2 ± 18.5 versus 16.9 ± 16.8, p = 0.7726) or mean relative change (117.7% ± 234.8% versus 106.8% ± 185.2%, p = 0.4807). The mean increase in IIEF score became significant as early as 1 month after initiation of the treatment (9.4 ± 14.2), a relative increase of 64.8% over baseline (p < 0.0001) for the overall population (). This early improvement was also observed for each IIEF subscore (erectile function, orgasmic function, sexual desire, intercourse satisfaction, and overall satisfaction). The IIEF erectile function subscore showed the greatest increase over 6 months of all the subscales, showing a mean relative increase of 124.5% ± 387.2% after 1 month and 214.7% ± 533.3% at 6 months. The overall satisfaction subscale showed the next greatest change, with a mean increase of 104.1% ± 123.5% at 6 months.
Figure 5. Change in IIEF total scores over 6 months according to responder status. IIEF, International Index of Erectile Function. Error bars are standard error of mean.
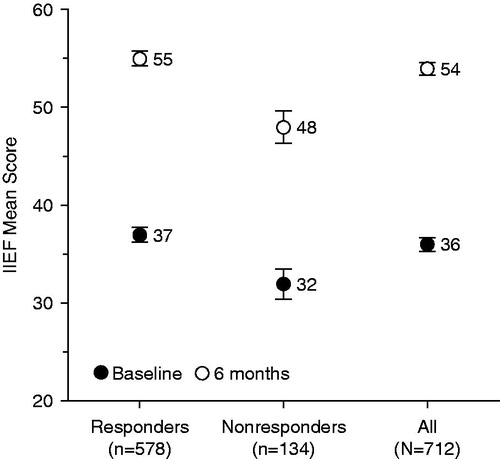
Figure 6. Changes in IIEF and MFI total scores over 6 months for the overall population (n = 712). p < 0.0001 versus baseline for all visits for both IIEF and MFI total scores. IIEF, International Index of Erectile Function; MFI, Multidimensional Fatigue Inventory. Error bars are standard error of mean.
The mean IIEF total score at baseline was significantly higher for those patients <50 years of age (40 ± 17) compared with those ≥50 years (33 ± 18, p < 0.0001). The 6-month increase in IIEF scores was significant in both groups from visit 2 at week 4 (p < 0.0001) onward. The mean absolute IIEF increases observed from baseline to 6 months for the <50 years (18.5 ± 18.1) and ≥50 years (17.3 ± 18.3) and the mean relative changes (107.9% ± 230.0% versus 122.1% ± 226.6%) were not, however, significantly different in both cases (p = 0.3967 and 0.4035, respectively).
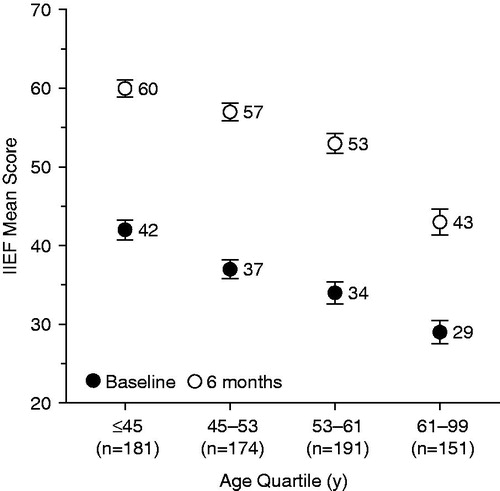
At the baseline visit, the difference between age quartiles in IIEF score was significant (p < 0.0001). The IIEF scores tended to be higher in younger subjects than in older subjects. The increase from baseline in IIEF total score was significant in all age quartiles from 4 weeks (p < 0.0001 for each quartile). The mean absolute 6-month increase was significantly different between age groups (p = 0.0197), but not the relative increase (p = 0.2106). The absolute increase tended to be more marked in younger subjects than in older subjects ().
Figure 7. Change in IIEF total scores over 6 months according to age quartile. IIEF, International Index of Erectile Function. Error bars are standard error of mean.
Changes in MFI total score
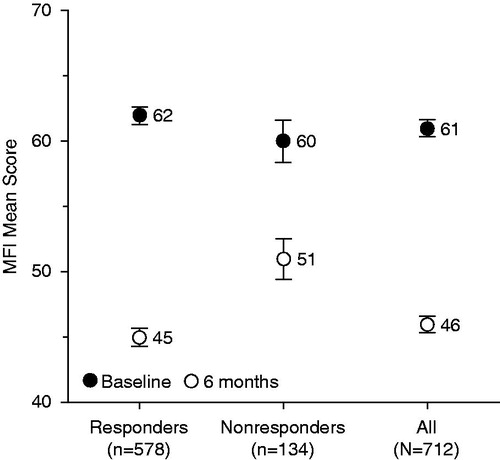
The mean MFI total score decreased significantly in both responders and nonresponders (p < 0.0001 for both). The 6-month decrease was greater in responders than in nonresponders for both mean absolute change ( −16.8 ± 19.2 and −10.7 ± 22.3, respectively, p = 0.0048) and mean relative change (−24.0% ± 30.1% versus −10.5% ± 43.8%, p = 0.0010) (). An improvement in MFI score was observed after 1 month (−6.9 ± 13.1) versus baseline, a relative improvement of 8.3% (p < 0.0001) (). A significant decrease from baseline was also observed for each MFI subscore (general fatigue, physical fatigue, mental fatigue, reduced motivation, and reduced activity) after 4 weeks of treatment.
Figure 8. Change in mean MFI total scores over 6 months according to responder status. MFI, Multidimensional Fatigue Inventory. Error bars are standard error of mean.
At baseline visit, mean MFI total scores were not significantly different between those aged <50 years and those aged ≥50 years. The decrease from baseline in mean MFI total score was significant in both <50 years and ≥50 years age categories from 4 weeks to 6 months (p < 0.0001). The 6-month decrease was significantly greater in the <50 years group than in the ≥50 years group for both mean absolute change (−18.4 ± 21.1 versus −13.1 ± 18.5, p = 0.0002) and relative change (−25.9% ± 32.9% versus −17.6% ± 33.5%, p < 0.0001).
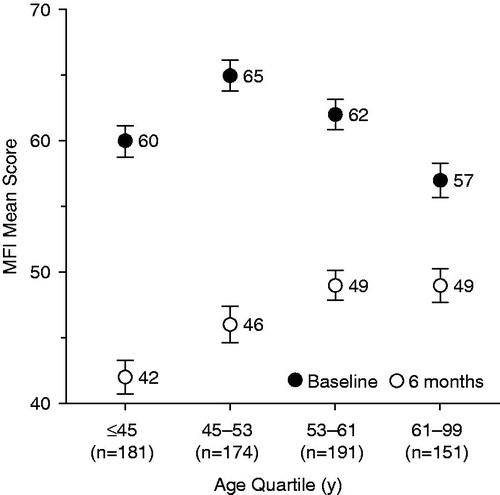
At the baseline visit, the difference between age quartiles in the MFI score was significant (p = 0.0003). The decrease from baseline in mean MFI total score was significant in the ≤45 years and 45–53 years age quartiles from 4 weeks to 6 months (p < 0.0001 for these visits) The decrease from baseline in MFI total score became significant for all age quartiles at 4 weeks (p < 0.0001 in each category). The 6-month mean absolute and mean relative decreases were significantly different between age groups (p < 0.0001 in both). The decrease was observed to be greater in younger subjects ().
Figure 9. Change in mean MFI total scores over 6 months according to age quartile. MFI, Multidimensional Fatigue Inventory. Error bars are standard error of mean.
Changes in BMI
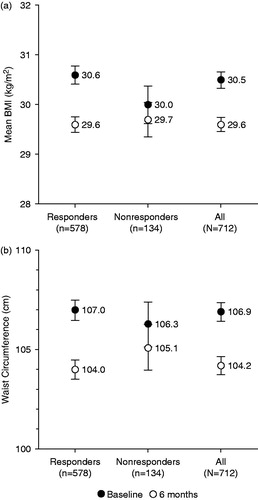
Mean BMI decreased significantly (p < 0.0001) in responders but remained stable in nonresponders. The decrease from baseline became significant at 3 months in responders (p < 0.0001). The 6-month decrease was significantly greater in responders than nonresponders, both for the absolute mean change (−1.0 ± 2.0 kg/m2 versus −0.2 ± 1.2 kg/m2, p < 0.0001) and the relative mean change (−2.9% ± 6.0% versus −0.4% ± 3.9%, p < 0.0001) ().
Figure 10. Change in (a) mean BMI and (b) waist circumference over 6 months according to responder status. BMI, body mass index. Error bars are standard error of mean.
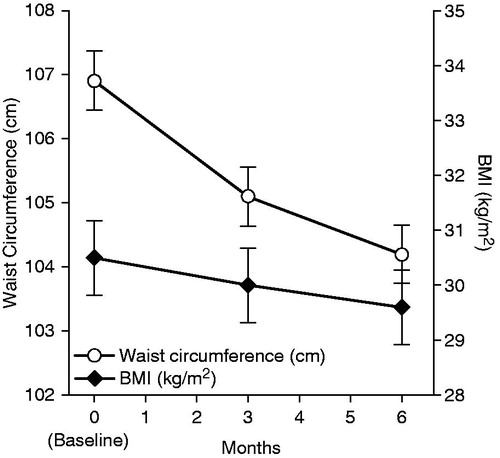
In the overall population, mean BMI decreased slightly from baseline (30.5 ± 4.4 kg/m2) to 3 months (30.0 ± 4.1 kg/m2) and 6 months (29.6 ± 3.8 kg/m2). The absolute decrease from baseline in mean BMI was limited but significant at 3 months ( −0.5 ± 1.5 kg/m2, p < 0.0001) and 6 months (−0.8 ± 1.9 kg/m2, p < 0.0001) (). The relative decrease from baseline in mean BMI was significant at 3 months (−1.5% ± 4.8%, p < 0.0001) and 6 months (−2.4% ± 5.8%, p < 0.0001).
Figure 11. Changes in BMI and waist circumference values over 6 months for the overall population (n = 712). p < 0.0001 versus baseline for all visits for both BMI and waist circumference. BMI, body mass index. Error bars are standard error of mean.
At baseline, BMI was not significantly different between men aged <50 years and those aged ≥50 years (30.5 ± 4.5 kg/m2 versus 30.5 ± 4.3 kg/m2). The decrease from baseline in BMI was significant for both age categories at 3 and 6 months (p < 0.0001 in both). The 6-month decrease was significantly more marked in the <50 years than in the ≥50 years group for both mean absolute change (−1.2 ± 2.0 kg/m2 versus −0.6 ± 1.7 kg/m2, p = 0.0001) and mean relative change (−3.4% ± 6.4% versus −1.7% ± 5.2%, p < 0.0001).
BMI scores were not significantly different between age quartiles at baseline (p = 0.3063). The decrease from baseline in BMI became significant for all age quartiles at 3 months (p < 0.0001 in each), except in the 61–99 years age quartile, where BMI remained stable between baseline and 6 months. The mean absolute and mean relative decreases over 6 months were significantly different between age quartiles (p < 0.0001 in both). The decrease was generally more marked in younger than in older subjects. For example, the decrease in BMI was slightly greater in the 45–53 years age quartile than in the 61–99 years age quartile, both for the mean absolute change (−1.1 ± 2.0 kg/m2 versus −0.1 ± 1.2 kg/m2, respectively) and the mean relative change (−3.0% ± 6.5% versus −0.3% ± 3.8%, respectively).
Changes in waist circumference
In both responders and nonresponders, the mean waist circumference decreased significantly from baseline and the decrease became significant at 3 months (p < 0.0001). The 6-month decrease was significantly more marked in responders than nonresponders, both for the absolute mean change (−3.7 ± 6.8 cm versus −1.5 ± 4.0 cm, p = 0.0007) and the relative mean change (−3.2% ± 6.0% versus −1.4% ± 3.6%, p = 0.0005) ().
The mean waist circumference in the overall population decreased slightly from baseline (106.9 ± 12.3 cm) to 3 months (105.1 ± 12.1 cm), and 6 months (104.2 ± 12.2 cm) (). The absolute decrease from baseline in mean waist circumference was significant at 3 months (−2.2 ± 5.3 cm, p < 0.0001) and 6 months (−3.3 ± 6.4 cm, p < 0.0001). The relative decrease from baseline in mean waist circumference was significant at 3 months (−1.9% ± 4.7%, p < 0.0001) and 6 months (−2.9% ± 5.7%, p < 0.0001).
Waist circumference values were not significantly different at baseline between the <50 years and the ≥50 years age categories (106.8 ± 13.1 cm versus 107.2 ± 11.7 cm). The decrease from baseline in waist circumference was significant in both age categories at 3 and 6 months (p < 0.0001 in both). The 6-month decrease was significantly greater in the <50 years than in the ≥50 years age category for both mean absolute change (−5.0 ± 6.4 cm versus −2.0 ± 6.1 cm, p < 0.0001) and relative change (−4.4% ± 5.5% versus −1.7% ± 5.6%, p < 0.0001).
At baseline, waist circumference values were not significantly different between age quartiles (p = 0.6757). The decrease from baseline in waist circumference became significant for all age quartiles at 3 months (p < 0.0001 in each), except for men aged 61–99 years, whose waist circumference remained relatively stable over 6 months. The mean absolute and mean relative decreases from baseline to 6 months were significantly different between age groups (p < 0.0001 in both). As with BMI, the decrease was more marked in younger than in older subjects. The decrease in waist circumference was slightly greater in the 45–53 years age quartile than in the 61–99 years age quartile, both for mean absolute change (−4.8 ± 6.9 cm versus −0.7 ± 5.0 cm, respectively) and relative change (−4.1% ± 5.8% versus −0.5% ± 4.6%, respectively).
Safety
The median duration of T treatment was 185 days and was similar in responders and nonresponders. There were no deaths during the study. A total of 79 suspected treatment-emergent ADRs occurred with six serious ADRs in four subjects (0.4%). These were prostate carcinoma, amnesia, nausea, angina pectoris, hypertension, and atrial fibrillation.
Suspected treatment-emergent ADRs led to the discontinuation of treatment of 42 subjects (4%). Most of the ADRs leading to discontinuation belonged to the system organ class of general disorders and administration of site condition (18 subjects, mostly concerned with nonefficacy) or skin and subcutaneous tissues disorders (6 events in 6 subjects total, of whom 2 had allergic dermatitis and 2 experienced rash). Three subjects discontinued due to increased prostate-specific antigen (PSA). Other discontinuations were for cardiac, gastrointestinal, nervous, and psychiatric disorders (2 subjects in each category), ear and labyrinth, vascular, respiratory/thoracic/mediastinal, endocrine, hepatobiliary disorders, and infection/infestation (1 each).
Hemoglobin, hematocrit, and PSA values remained in the normal ranges for most subjects over the 6- month treatment period (). Vital signs were stable throughout the study.
Table 2. Summary of qualitative laboratory parameters for PSA, hemoglobin, and hematocrit (n = 1049).
Discussion
The medical histories of the men in this study were consistent with previous studies that showed a high frequency of increased BMI, hypertension, hyperlipidemia and diabetes in hypogonadal men [Citation7]. There were slightly more smokers in the responder group than in the nonresponder group of this study.
As this was an observational study, it reflects everyday community clinical practice. Patient selection and treatment was provided by the local physicians and this will inevitably show some heterogeneity depending on their personal and clinical judgment, and their community mores. In addition, circadian variation in patients’ T levels, and local laboratory ranges classified as “low,” “normal,” and “high,” may help to provide an explanation for why the proportion of subjects with low morning total T values at baseline was 83.6% and not 100%. However, a 1% T gel has been shown to have a beneficial effect on body composition and health-related quality-of-life in patients with baseline low or low-normal T levels (up to 15 nmol/L, 431 ng/dL) in a study by Behre et al. [Citation33].
Overall, most subjects (81.2%) showed a biochemical response to treatment, as they had at least one documented total T level within the normal range while receiving 1% T gel.
The main objective of this study was to evaluate the effect of 1% T gel TRT on symptoms of hypogonadism and quality of life, assessed by the AMS scale. A significant decrease (−29%) in mean AMS score was observed 6 months after initiation of the treatment, demonstrating a substantial improvement on aging symptoms in hypogonadal men. This is consistent with that reported in an open postmarketing study by Heinemann et al., in which 1670 hypogonadal men were treated for 3 months with 1% T gel (AndroGel) [Citation34] and improvement in AMS total score was 30.7%. Heinemann et al. suggested that a 22% relative improvement in total AMS score is a reasonable threshold to judge treatment success. As expected, the improvement in AMS score shown here was more pronounced in responders than in nonresponders. The improvement was also more pronounced in younger subjects.
In this study, the increase in IIEF score became significant as early as 1 month after initiation of TRT (mean increase +9.4, +64.8%) and reached +17.9 (+115.7%) versus baseline at the 6-month visit. This is in agreement with a study in Taiwan [Citation35] where a significant increase in the IIEF was observed after 1 month of treatment with 1% T gel in 38 hypogonadal men. Improvements in sexual function were also recorded after 1 month of 1% T gel treatment in a large 6-month randomized, controlled multicenter trial in 227 hypogonadal men [Citation23]. The erectile function subscale showed a particularly large (>200%) increase over 6 months due to TRT, this is in agreement with previously reported studies that have shown improvements in erectile function after transdermal gel use [Citation22,Citation35–37].
Most patients (86.8%) were taking PDE5 inhibitors and there is evidence that testosterone may offer improvement in erectile function above and beyond that of PDE5 inhibitors alone [Citation38,Citation39]. Therefore, the results from this study could be taken to provide some support for this concept. On the other hand, this issue remains somewhat controversial as a recent study has reported no significant differences in IIEF erectile function domain scores after 14 weeks of treatment with either sildenafil and testosterone, or sildenafil alone in men aged 40–70 years, with baseline IIEF erectile domain scores of 25 or less, and baseline total T levels less than 330 ng/dL (11.5 nmol/L) [Citation40].
The link between erectile dysfunction and aging has been well established [Citation41,Citation42] and this study provides further confirmation as IIEF scores are lower for older populations. After 6 months of 1% T gel TRT, the IIEF scores increased for all age groups and the relative increase was not significantly different between age groups.
This study employed the MFI scale to assess fatigue, which included general, physical, and mental fatigue, reduced motivation, and reduced activity. A study by Beutel et al. [Citation43] has shown that sex hormone levels, physical complaints, depression, sexuality and life satisfaction, and low total and free T are associated with reduced motivation, as shown by the MFI scale. In this study, as early as 4 weeks after initiation of TRT, the MFI score decreased significantly and declined further at the following visit. After 6 months of treatment, the improvement in fatigue score reached −21.5%. Analyses of MFI scores showed that, as with the AMS score, the improvement in MFI score was more marked in responder subjects and also in younger patients.
Improvement in body composition after treatment with T gels has been reported previously [Citation23,Citation37,Citation44]. In this study, a significant, although limited, decrease in BMI and waist circumference from baseline, was observed at 3 and 6 months after initiation of TRT with 1% T gel. This improvement in BMI and waist circumference was more marked in subjects who were classified as responders, and were younger. It is worth noting that body composition measurements are less prone to placebo effects than psychometric measures, such as AMS and IIEF. The mean BMI of this population was 31, indicating that the majority of patients were obese. This is noteworthy as there is evidence that obesity rather than age may be the major cause of declining testosterone levels in the general population [Citation45–47].
The safety profile of this 1% T gel for TRT is well established [Citation22,Citation27,Citation28] and in this study, its tolerability was also assessed. The frequency of subjects reporting at least one suspected treatment-emergent ADR was low (6.3%) and only a small proportion of subjects withdrew from the study for ADRs (4%). The ADRs reported in this study are typical of TRT and are reported in the product labeling [Citation26]. No deaths were reported throughout the study duration.
Study limitations
As this was an observational study, there was no control group who did not receive 1% T gel. Only primary outcome metrics (AMS, IIEF, MFI, BMI and waist circumference) were uniformly collected; values from labs and other data were sometimes missing. Thus, certain data were not evaluable from site to site and patient to patient. The varied backgrounds of the investigators and their staffs, as demonstrated by inconsistencies in data collection, are also limitations of this study. Hormonal assays were performed locally; therefore, analytical variations in the measurements occurred and made numerical summarization of baseline and follow-up values impossible. The lack of a central laboratory and the scarce availability of follow-up laboratory safety measurements (e.g. for hematocrit, PSA, and hemoglobin) are further limitations. In addition, only one blood sample was required to enter the study. Finally, mechanisms to determine compliance were not used. Despite these limitations, these data are consistent with previous observational and controlled studies.
Conclusion
This was a large-scale international study conducted with a 1% T gel in hypogonadal men treated in everyday community clinical practice. After 6 months of treatment, T values had reached normal ranges in most subjects. A substantial and significant improvement in the symptoms of hypogonadism, quality of life, fatigue, erectile dysfunction, and libido/sexual desire, assessed through the AMS, MFI, and IIEF scores, respectively, was demonstrated in hypogonadal men after a 6-month treatment period with this 1% T gel TRT. A more objective effect of the treatment was demonstrated by a significant decrease in BMI and waist circumference. Treatment-emergent ADRs were experienced by 7.5% of the safety population over the 6-month treatment period in the setting of this study.
Declaration of interest
Claire Pexman-Fieth is an employee of Abbott and owns Abbott and AbbVie stock. Hermann M. Behre declares no conflict of interest. Alvaro Morales has been a consultant for Abbott and Lilly. Natalia Kan-Dobrosky and Michael G. Miller are employees of AbbVie and own Abbott and AbbVie stock. This study was funded by AbbVie.
Acknowledgements
Medical writing and editorial support for preparation of this manuscript was provided by Robin Smith, PhD, and Evelyn B. Kelly, PhD, of The Curry Rockefeller Group, LLC, Tarrytown, NY. The authors and AbbVie reviewed and approved the manuscript; the authors maintained control over the final content.
References
- Bhasin S, Cunningham GR, Hayes FJ, et al. Testosterone therapy in men with androgen deficiency syndromes: an Endocrine Society clinical practice guideline. J Clin Endocrinol Metab 2010;95:2536–59
- Wang C, Nieschlag E, Swerdloff RS, et al. ISA, ISSAM, EAU, EAA and ASA recommendations: investigation, treatment and monitoring of late-onset hypogonadism in males. Aging Male 2009;12:5–12
- Heinemann LAJ, Zimmermann T, Vermeulen A, et al. A new ‘aging males’ symptoms' rating scale. Aging Male 1999;2:105–14
- Araujo AB, Esche GR, Kupelian V, et al. Prevalence of symptomatic androgen deficiency in men. J Clin Endocrinol Metab 2007;92:4241–7
- Araujo AB, O'Donnell AB, Brambilla DJ, et al. Prevalence and incidence of androgen deficiency in middle-aged and older men: estimates from the Massachusetts Male Aging Study. J Clin Endocrinol Metab 2004;89:5920–6
- Harman SM, Metter EJ, Tobin JD, et al. Longitudinal effects of aging on serum total and free testosterone levels in healthy men. Baltimore Longitudinal Study of Aging. J Clin Endocrinol Metab 2001;86:724–31
- Mulligan T, Frick MF, Zuraw QC, et al. Prevalence of hypogonadism in males aged at least 45 years: the HIM study. Int J Clin Pract 2006;60:762–9
- Travison TG, Shackelton R, Araujo AB, et al. The natural history of symptomatic androgen deficiency in men: onset, progression, and spontaneous remission. J Am Geriatr Soc 2008;56:831–9
- Ageing characterises the demographic perspectives of the European societies (Statistics in focus 72/2008). Luxembourg: Eurostat, European Communities; 2008. Available from: http://epp.eurostat.ec.europa.eu/portal/page/portal/product_details/publication?p_product_code=KS-SF-08-072 [last accessed 2 April 2013]
- Maggi M, Schulman C, Quinton R, et al. The burden of testosterone deficiency syndrome in adult men: economic and quality-of-life impact. J Sex Med 2007;4:1056–69
- Kupelian V, Page ST, Araujo AB, et al. Low sex hormone-binding globulin, total testosterone, and symptomatic androgen deficiency are associated with development of the metabolic syndrome in nonobese men. J Clin Endocrinol Metab 2006;91:843–50
- Li C, Ford ES, Li B, et al. Association of testosterone and sex hormone-binding globulin with metabolic syndrome and insulin resistance in men. Diabetes Care 2010;33:1618–24
- Maggio M, Lauretani F, Ceda GP, et al. Association between hormones and metabolic syndrome in older Italian men. J Am Geriatr Soc 2006;54:1832–8
- Rodriguez A, Muller DC, Metter EJ, et al. Aging, androgens, and the metabolic syndrome in a longitudinal study of aging. J Clin Endocrinol Metab 2007;92:3568–72
- Nieschlag E, Swerdloff R, Behre HM, et al. Investigation, treatment, and monitoring of late-onset hypogonadism in males: ISA, ISSAM, and EAU recommendations. J Androl 2006;27:135–7
- Petak SM, Nankin HR, Spark RF, et al. American Association of Clinical Endocrinologists Medical Guidelines for clinical practice for the evaluation and treatment of hypogonadism in adult male patients–2002 update. Endocr Pract 2002;8:440–56
- Aversa A, Bruzziches R, Francomano D, et al. Effects of long-acting testosterone undecanoate on bone mineral density in middle-aged men with late-onset hypogonadism and metabolic syndrome: results from a 36 months controlled study. Aging Male 2012;15:96–102
- Ho CC, Tong SF, Low WY, et al. A randomized, double-blind, placebo-controlled trial on the effect of long-acting testosterone treatment as assessed by the Aging Male Symptoms scale. BJU Int 2012;110:260–5
- Khera M, Bhattacharya RK, Blick G, et al. Improved sexual function with testosterone replacement therapy in hypogonadal men: real-world data from the Testim Registry in the United States (TRiUS). J Sex Med 2011;8:3204–13
- Miner MM, Bhattacharya RK, Blick G, et al. 12-Month observation of testosterone replacement effectiveness in a general population of men. Postgrad Med 2013;125:8–18
- Snyder PJ, Peachey H, Hannoush P, et al. Effect of testosterone treatment on bone mineral density in men over 65 years of age. J Clin Endocrinol Metab 1999;84:1966–72
- Wang C, Cunningham G, Dobs A, et al. Long-term testosterone gel (AndroGel) treatment maintains beneficial effects on sexual function and mood, lean and fat mass, and bone mineral density in hypogonadal men. J Clin Endocrinol Metab 2004;89:2085–98
- Wang C, Swerdloff RS, Iranmanesh A, et al. Transdermal testosterone gel improves sexual function, mood, muscle strength, and body composition parameters in hypogonadal men. J Clin Endocrinol Metab 2000;85:2839–53
- Shores MM, Smith NL, Forsberg CW, et al. Testosterone treatment and mortality in men with low testosterone levels. J Clin Endocrinol Metab 2012;97:2050–8
- Wang C, Alexander G, Berman N, et al. Testosterone replacement therapy improves mood in hypogonadal men—a clinical research center study. J Clin Endocrinol Metab 1996;81:3578–83
- AndroGel®(testosterone gel) 1% [prescribing information]. North Chicago, IL, USA: AbbVie Inc.; 2013. Available from: http://www.rxabbvie.com/pdf/androgel_PI.pdf [last accessed 6 November 2013]
- Swerdloff RS, Wang C, Cunningham G, et al. Long-term pharmacokinetics of transdermal testosterone gel in hypogonadal men. J Clin Endocrinol Metab 2000;85:4500–10
- Wang C, Berman N, Longstreth JA, et al. Pharmacokinetics of transdermal testosterone gel in hypogonadal men: application of gel at one site versus four sites: a General Clinical Research Center Study. J Clin Endocrinol Metab 2000;85:964–9
- Behre HM, Heinemann L, Morales A, Pexman-Fieth C. Rationale, design and methods of the ESPRIT study: Energy, Sexual desire and body PropoRtions wIth AndroGel, Testosterone 1% gel therapy, in hypogonadal men. Aging Male 2008;11:101–6
- Rosen RC, Cappelleri JC, Gendrano N III. The International Index of Erectile Function (IIEF): a state-of-the-science review. Int J Impot Res 2002;14:226–44
- Smets EM, Garssen B, Bonke B, De Haes JC. The Multidimensional Fatigue Inventory (MFI) psychometric qualities of an instrument to assess fatigue. J Psychosom Res 1995;39:315–25
- Expert Panel on Detection, Evaluation, and Treatment of High Blood Cholesterol in Adults. Executive Summary of The Third Report of The National Cholesterol Education Program (NCEP) Expert Panel on Detection, Evaluation, and Treatment of High Blood Cholesterol in Adults (Adult Treatment Panel III). JAMA 2001;285:2486–97
- Behre HM, Tammela TL, Arver S, et al. A randomized, double-blind, placebo-controlled trial of testosterone gel on body composition and health-related quality-of-life in men with hypogonadal to low-normal levels of serum testosterone and symptoms of androgen deficiency over 6 months with 12 months open-label follow-up. Aging Male 2012;15:198–207
- Heinemann LA, Moore C, Dinger JC, Stoehr D. Sensitivity as outcome measure of androgen replacement: the AMS scale. Health Qual Life Outcomes 2006;4:23--9
- Chiang HS, Hwang TI, Hsui YS, et al. Transdermal testosterone gel increases serum testosterone levels in hypogonadal men in Taiwan with improvements in sexual function. Int J Impot Res 2007;19:411–17
- McNicholas TA, Dean JD, Mulder H, et al. A novel testosterone gel formulation normalizes androgen levels in hypogonadal men, with improvements in body composition and sexual function. BJU Int 2003;91:69–74
- Steidle C, Schwartz S, Jacoby K, et al. AA2500 testosterone gel normalizes androgen levels in aging males with improvements in body composition and sexual function. J Clin Endocrinol Metab 2003;88:2673–81
- Buvat J, Montorsi F, Maggi M, et al. Hypogonadal men nonresponders to the PDE5 inhibitor tadalafil benefit from normalization of testosterone levels with a 1% hydroalcoholic testosterone gel in the treatment of erectile dysfunction (TADTEST study). J Sex Med 2011;8:284–93
- Shabsigh R, Kaufman JM, Steidle C, Padma-Nathan H. Randomized study of testosterone gel as adjunctive therapy to sildenafil in hypogonadal men with erectile dysfunction who do not respond to sildenafil alone. J Urol 2004;172:658–63
- Spitzer M, Basaria S, Travison TG, et al. Effect of testosterone replacement on response to sildenafil citrate in men with erectile dysfunction: a parallel, randomized trial. Ann Intern Med 2012;157:681–91
- Feldman HA, Goldstein I, Hatzichristou DG, et al. Impotence and its medical and psychosocial correlates: results of the Massachusetts Male Aging Study. J Urol 1994;151:54–61
- Morley JE. Impotence. Am J Med 1986;80:897–905
- Beutel ME, Wiltink J, Hauck EW, et al. Correlations between hormones, physical, and affective parameters in aging urologic outpatients. Eur Urol 2005;47:749–55
- Srinivas-Shankar U, Roberts SA, Connolly MJ, et al. Effects of testosterone on muscle strength, physical function, body composition, and quality of life in intermediate-frail and frail elderly men: a randomized, double-blind, placebo-controlled study. J Clin Endocrinol Metab 2010;95:639–50
- Camacho EM, Huhtaniemi IT, O'Neill TW, et al. Age-associated changes in hypothalamic-pituitary-testicular function in middle-aged and older men are modified by weight change and lifestyle factors: longitudinal results from the European Male Ageing Study. Eur J Endocrinol 2013;168:445–55
- Gates MA, Mekary RA, Chiu GR, et al. Sex steroid hormone levels and body composition in men. J Clin Endocrinol Metab 2013;98:2442–50
- Saboor Aftab SA, Kumar S, Barber TM. The role of obesity and type 2 diabetes mellitus in the development of male obesity-associated secondary hypogonadism. Clin Endocrinol (Oxf) 2013;78:330–7