
Abstract
The aim of this study was to develop a psychometrically sound short version of the 17-item Aging Males’ Symptoms (AMS) scale using Mokken scale analysis (MSA) and Rasch analysis. We recruited a convenient sample of 1787 men (age: mean (SD) = 43.8 (11.5) years) who visited a men’s health polyclinic in Taiwan and completed the AMS scale. The scale was first assessed using MSA. The remaining items were assessed using Rasch analysis. We used a stepwise approach to remove items with χ2 item statistics and mean square values while monitoring unidimensionality. The item reduction process resulted in a 6-item version of the AMS scale (AMS-6). The AMS-6 scale included a 5-item psychosomatic subscale (original items 1, 4, 5, 8, and 9) and a 1-item sexual subscale (original item 16). Analyses confirmed that the 5-item psychosomatic subscale was a Rasch scale. The AMS-6 correlated well with the AMS scales: the 5-item psychosomatic subscale correlated with the AMS scale (r between 0.50 and 0.92); the 1-item sexual subscale correlated with the sexual subscale of the AMS scale (r = 0.81). A 6-item short form of the AMS scale had satisfactory measurement properties. This version may be useful for estimating psychosomatic and sexual symptoms as well as health-related quality of life with a minimal burden on respondents.
Introduction
Like women, men experience an age-related decline in physical and mental capacity [Citation1]. Aging male symptoms are of multifactorial origins such as medical problems, mental disorders, testosterone levels, and androgen receptor polymorphism [Citation2]. Several studies have suggested that a number of aging male symptoms may be associated with depression and anxiety disorders, alexithymia [Citation2,Citation3], and poor quality of life [Citation4,Citation5].
The Aging Males’ Symptoms (AMS) scale has been widely used to measure health-related quality of life and symptoms of aging in clinical research [Citation6,Citation7]. The sum of the scores of the AMS scale and its subscales are typically used to represent the severity of symptoms and impairment without any weighting [Citation1].
Sum scores assume that all items are equally correlated with the measured underlying construct and that the point intervals are equal on the scale; however, these assumptions are unrealistic and unjustified [Citation8]. The items on the AMS scale are rank-ordered and are not linear and continuous measurements; this means that calculating the item scores might be meaningless.
Two different approaches to evaluate the psychometric properties of rating scales are classical test theory (CTT) and item response theory (IRT) [Citation8]. Using CTT, health-care professionals can understand the agreement among answers to different items in an instrument (Cronbach’s α) and know the extent to which the scores of a measure are related to a known standard measure with related concepts [Citation9].
The limitations of CTT include the summated scale problems previously noted and its predominantly person- and test-level statistics. Both person- and test-level statistics are sample dependent in CTT and may result in different psychometric properties when based on different samples [Citation9,Citation10]. For example, numerous factor analyses of the AMS scale have been published [Citation6,Citation11,Citation12]. Although the AMS scale has good psychometric properties based on CTT, the factor structure of the AMS scale has been inconsistent across these studies.
IRT overcomes the main disadvantages of CTT as it provides item-level statistics that are not affected by different samples [Citation8–10]. To the best of our knowledge, no study has used IRT to examine the psychometric properties of the AMS scale. In the present study, two kinds of IRT analyses – Mokken scale analysis (MSA) and Rasch analysis – were applied to the AMS scale.
Mokken models belong to the class of nonparametric item response theory (NIRT) models [Citation13,Citation14]. MSA is a scaling technique for ordinal data and is used mainly for scaling test and questionnaire data [Citation13]. In the field of health construct measurements, MSA can not only be applied to design questionnaires or tests, but can also be used to scrutinize the appropriateness and performance of the measurements [Citation15]. MSA consists of two parts: (1) an automated selection algorithm which partitions a set of ordinal variables (from here on called items) into scales (called Mokken scales) satisfying criteria related to NIRT models and possibly leaving some items unselected, and (2) methods to investigate assumptions of NIRT models. The major advantage of MSA over parametric IRT models such as the Rasch model, is that it relaxes some of the strong statistical assumptions of the family of parametric IRT models [Citation14].
The underlying assumptions of Mokken models are unidimensionality, local independence, and latent monotonicity [Citation13]. The assumption of unidimensionality means that all items from the same instrument measure the same latent trait θ. Local independence refers to an individual’s response to an item which is not influenced by his or her responses to the other items in the same test [Citation16]. Latent monotonicity means that for each item, the probability of a particular response level is a monotonically non-decreasing function of the latent trait θ [Citation15]. The Rasch model also assumes unidimensionality, local independence, and latent monotonicity [Citation17]. Therefore, investigation of the assumptions of NIRT models is also useful when the Rasch model is used [Citation18].
There are two main kinds of Mokken models, the monotone homogeneity model (MHM), and the double monotonicity model (DMM) [Citation13]. The MHM assumes unidimensionality, monotonicity, and local independence of items within a scale. If these assumptions are met, then the simple sum score of the items within a scale can be used for ordinal person measurement [Citation13,Citation18]. The DMM assumes unidimensionality, monotonicity, local independence, and non-intersection of items within a scale. If these assumptions are met, then the items not only have the same features as the MHM, but they also have the property of invariant item ordering [Citation16]. Invariant item ordering refers to items that have the same “difficulty” in ordering irrespective of the value of the latent trait. Invariant item ordering allows the researcher to order items according to their difficulty (facility) or commonality/prevalence, a property that helps researchers communicate useful features of the hierarchical ordering of scale items to users [Citation15]. In addition, if the DMM fits the item response data, then the invariant item ordering property can also be expected to hold in any subgroup from that population and thus is considered to be in some sense “person-free”.
Rasch analysis is a unique psychometric approach which fulfills the requirements of additive measurement [Citation17]. Rasch models are a class of probabilistic models that explain the response of a person to a set of items, and are considered to be a unidimensional latent trait θ [Citation19]. Rasch analysis assumes that all items provide equal discrimination and different difficulties and that each respondent has an underlying latent trait corresponding to the item difficulty [Citation17]. The Rasch model transforms data from ordinal scores into interval level measurement.
Rasch analysis is especially useful for health-related measures [Citation17]. Because Rasch analysis can produce an ordinal-to-interval conversion table, it is reasonable to sum the item scores to produce a total score that is an adequate representation of the measured dimension. Health-care professionals can estimate the latent trait of a respondent and the difficulty of each item [Citation20]. In addition, a Rasch model has the feature of sample-independent measurement.
In the case of items on the AMS scale, we are not concerned as to whether an item is correct, but on how characteristic a positive response would be for high and low impairment of health-related quality of life. A participant with high overall scores for impairment of health-related quality of life would be expected to definitely agree with items that measure this dimension. The logic and statistical procedures, however, are the same as if the AMS scale were a measure of ability.
The purposes of the present study were (1) to examine the psychometric properties of the AMS scale (17 items) in a large sample, using MSA and Rasch analysis, (2) to develop a short version of the AMS scale, and (3) to test the psychometric properties of the short version of the AMS scale.
Methods and materials
Sample
The present study used a cross-sectional design in a convenience sample drawn from the men’s health polyclinic in the Chang Gung Memorial Hospital, Taoyuan branch. The polyclinic has three specialties, urology, psychiatry, and traditional Chinese medicine. We defined a case as a male outpatient who initially visited the men’s health polyclinic during the period of July 2008 through July 2010. The inclusion criteria were: (1) a resident of Taiwan and (2) being able to read and understand Traditional Chinese characters. The exclusion criteria were: (1) psychotic symptoms and (2) visual, language and/or communication difficulties. We recruited a total of 1787 adult men (age: mean (SD) = 43.8 (11.5) years; median = 43.0 years; range = 17–86 years) in the present study. shows the sociodemographic characteristics of the sample.
Table 1. Demographic and clinical characteristics of the sample (N = 1787).
Procedure
Each man provided explicit written informed consent for the study prior to participation. Participants were invited to take part in a 20- to 30-min assessment interview by a trained research assistant. Participants completed the Aging Male Symptoms scales during their intake visits. The present study complied with the guidelines of the Declaration of Helsinki. All aspects of data collection received ethical approval from the Institutional Review Board (IRB) of the Chang Gung Memorial Hospital. All individual information was securely protected by delinking identifying information from main datasets and sources, and was available only to investigators.
Instrument
The AMS scale is a 17-item polychotomous scale which measures the health-related quality of life of aging men [Citation1]. Respondents rate each item on a five-point response scale (1–5: none = 1; mild = 2; moderate = 3; severe = 4; and extremely severe = 5), so that possible scores range from 17 to 85 for the AMS scale. According to the total score, the severity of symptoms was then classified as none/little (17–26), mild (27–36), moderate (37–49), or severe (50 or more). The AMS scale can be divided into three subscales: (1) psychological subscale (depressed mood, burned out, increased irritability, anxiety, and nervousness); (2) somatovegetative subscale (impaired well-being, increased joint complaints, increased sweating, need for more sleep, increased sleep disturbance, muscular weakness, and physical exhaustion); and (3) sexual subscale (past peak, decreased beard growth, impaired sexual potency, fewer morning erections, and disturbed libido) [Citation1]. The AMS scale has good psychometric characteristics [Citation7]. In the present study, we used the Taiwanese version of the AMS scale [Citation11], which has good internal consistency (Cronbach’s α was 0.90) and test-retest reliability (Pearson’s correlation r was 0.72).
Statistical analysis
All analyses were conducted in R version 3.2.0 (R Foundation for Statistical Computing, Vienna, Austria). The p values were two-tailed, and the α-level was set at 0.05. The 95% confidence intervals (CIs) were estimated as appropriate.
Mokken scale analysis
MSA is conducted using the Mokken package [Citation18,Citation21]. First, the assumption of unidimensionality is checked using three indices: item-pair (Hi j), item (Hi), and test (H) scalability coefficients. The MHM implies that these three indices should be in the range between 0 and 1. If H = 1, then the test data follow a perfect Guttman scalogram. Mokken proposed the following rules of thumb for H: a scale is considered weak if 0.3 ≤ H < 0.4:, moderate if 0.4 ≤ H < 0.5, and strong if H ≥ 0.5 [Citation13,Citation22].
Partitioning of a set of items into Mokken scales and possibly a set of unscalable items is then done using an automated item selection procedure with a generic algorithm [Citation13,Citation21]. Second, the assumption of monotonicity is checked by calling function check.monotonicity in R. If there are violations of monotonicity, then their seriousness can be assessed via consideration of the crit statistic. Items with a crit value <40 can be considered as not seriously violating monotonicity requirements and thus can be safely included in any Mokken scale [Citation23]. If the violation is serious (>40), however, then we remove the most serious (highest violation) item and rerun the analysis, checking that a new serious violation has not occurred with another item. Third, the assumption of non-interaction and invariant item ordering is checked by calling function check.iio in R, using the manifest invariant item ordering method [Citation18]. The backward selection method is used to remove items violating invariant item ordering. If there are an equal number of violations for two or more items, then the item with the lowest scalability is removed [Citation24]. Subsequently, these selected items are checked for accuracy in invariant item ordering using the statistic HT [Citation24]. advocated that if manifest invariant item ordering holds, then 0.3 < HT ≤ 0.4 should be interpreted as a weak ordering, 0.4 < HT ≤ 0.5 as a moderate ordering, and HT > 0.5 as a strong ordering. The reliability of the final scale is checked with Cronbach’s α, the Molenaar Sijtsma’s ρ, Guttman’s λ2, and the latent class reliability coefficient (LCRC) [Citation18].
Rasch analysis
Rasch analyses are conducted using the eRm package [Citation25]. The different versions of AMS scales are fitted into partial credit models by using conditioned maximum likelihood estimation. For each partial credit model, item goodness-of-fit statistics are checked using χ2 item statistics, and infit and outfit mean square (MSQ) values. A item is considered a misfit and removed if the p values of the χ2 test is less than 0.05, or its infit or outfit MSQ value is out of the range between 0.7 and 1.3. Those items that show misfit are removed, and the remaining items are fitted into another partial credit model for the next iteration of Rasch analysis. The item removal process is terminated once all the remaining items show goodness of fit in that the p values of the χ2 tests are larger than 0.05, and the infit and outfit MSQ values are between 0.7 and 1.3. For each Rasch model, principal component analysis is conducted to verify the unidimensional construct which explains most of the variance (>50%) in the sample tested. Pearson correlation tests are used to compare the final short form and the original AMS scales. Principal component analyses and correlation tests are conducted using the psych package [Citation26].
Results
Mokken scale analysis
By using Mokken’s automated item selection procedure, all 17 items on the AMS scale belonged to the same Mokken scale. All the corresponding item reliability coefficients (Hi) for the 17 items were larger than 0.3, and the test scalability H was 0.450 (CI 0.426–0.473), meaning acceptable homogeneity. The AMS scale can be considered as a moderate Guttman scale. We next checked the monotonicity of the AMS scale. All 17 items demonstrated good monotonicity, and none had crit values over 40. Therefore, all 17 items were retained. We then assessed non-interaction and invariant item ordering of the AMS scale by using the manifest invariant item ordering method. summarizes the analysis of invariant item ordering of the AMS scale. The backward item selection procedure revealed that items 17, 2, 6, and 7 were removed in that order. The coefficient HT for the remaining 13 items was 0.403, meaning medium accuracy of invariant item ordering. The test scalability H of the AMS-13 scale was 0.468 (CI 0.448–0.492). Our polytomous item Mokken scaling analysis therefore confirmed that the remaining 13 items (AMS-13) made up a moderate Guttman scale with moderate support for invariant item ordering. The reliability of the AMS-13 scale was good: Cronbach’s α = 0.90, Molenaar Sijtsma’s ρ = 0.91, Guttman’s λ2 = 0.90, and LCRC = 0.92.
Table 2. Abridged summary per item report of invariant item ordering of the AMS scale.
Rasch analysis
Principal component analysis of the AMS-13 scale revealed that the unidimensional construct explained 48% of the variance. In the first Rash analysis of the AMS-13 scale, items 3, 14, 15, and 16 showed misfit based on χ2 item fit (p < 0.001); items 3 and 13 showed infit and outfit MSQs less than 0.7. These 6 items were removed, and the remaining 7 items were input in the second iteration. Principal component analysis of these 7 items revealed that the unidimensional construct explained 59% of the variance. Among these 7 items, item 12 showed misfit based on χ2 item fit (p < 0.001); item 11 showed outfit MSQ less than 0.7. Items 11 and 12 were removed, and the remaining 5 items were input in the third iteration. All 5 items demonstrated acceptable goodness of fit (). shows the person-item map of the 5-item psychosomatic subscale. The 5-item version also showed the best overall scale validity, explaining 64% of the total variance. These 5 items included only psychological and somatovegetative symptoms, so that the 5-item version could be considered a psychosomatic subscale which measured both the psychological and somatovegetative dimensions of the AMS scale. shows the plot of person parameters (θ) against the raw scores of the 5-item psychosomatic subscale. Based on the raw scores of the 5-item psychosomatic subscale, the four levels of severity of psychosomatic symptoms were: none (≤7), mild (8–14), moderate (15–18), and severe (≥19).
Figure 1. The person-item map of the 5-item psychosomatic subscale of the AMS-6.
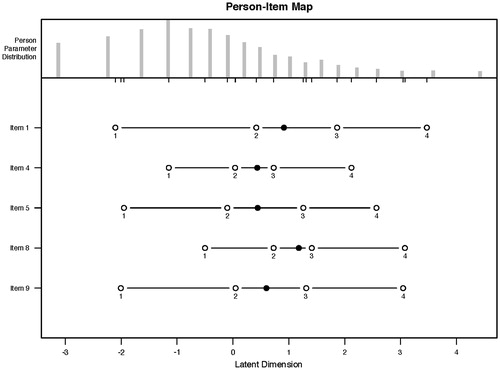
Figure 2. The plot of person parameters (θ) against the raw scores of the 5-item psychosomatic subscale of the AMS-6.
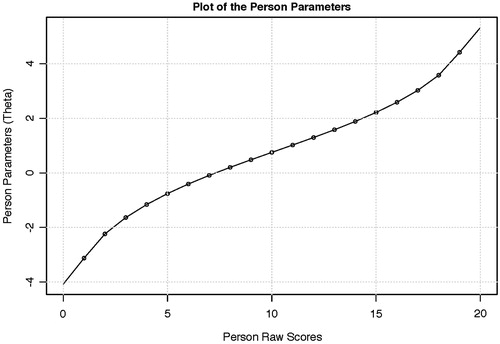
Table 3. Item fit statistics of Rasch analysis of the remaining 5 items on the AMS scale.
We also applied MSA to the 5-item psychosomatic scale. The corresponding item reliability coefficients (Hi) of the 5 items were all larger than 0.5. The test scalability H of the 5-item psychosomatic scale was 0.589 (CI 0.562–0.616). All the 5 items demonstrated good monotonicity, and none of them had crit values over 40. The analysis of invariant item ordering of the 5-item psychosomatic scale with a coefficient HT of 0.103 did not remove any item. The 5-item psychosomatic scale is a strong Guttman scale without the property of invariant item ordering. The reliability of the 5-item psychosomatic scale was good: Cronbach’s α = 0.85, Molenaar Sijtsma’s ρ = 0.86, Guttman’s λ2 = 0.85, and LCRC = 0.85.
Although the 5-item psychosomatic subscale demonstrated goodness of fit as a Rasch scale, the 5-item psychosomatic subscale did not contain any sexual symptom; therefore the psychosomatic subscale would miss the sexual dimension of aging male symptoms. With regard to the sexual dimension, we did a Rasch analysis of the 5 sexual symptoms on the original 17-item AMS scale. shows the summary of the Rasch analysis. shows the person-item map of the 5 sexual symptoms. Of the five sexual symptoms, only item 16 (“fewer morning erections”) showed acceptable goodness of fit. Finally, we constructed a 6-item version of the AMS scale (AMS-6) consisting of two subscales, the 5-item psychosomatic subscale and the 1-item sexual subscale.
Figure 3. The person-item map of the five sexual symptoms of the AMS.
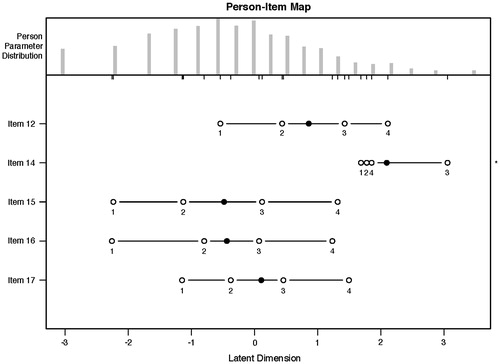
Table 4. Item fit statistics of Rasch analysis of the sexual symptoms on the AMS scale.
shows the Pearson correlation coefficients between the original 17-item AMS scale and the AMS-6 scale. The 5-item psychosomatic subscores of the AMS-6 scale were highly correlated with the total score, and the psychological and somatovegetative subscores of the AMS scale (p < 0.001). The 1-item sexual subscore of the AMS-6 scale was highly correlated with the sexual subscore on the AMS scale (p < 0.001). The AMS-6 scale was a valid measure, and performed similarly to the original 17-item AMS scale.
Table 5. Correlations between the original 17-item AMS scale and the new 6-item AMS scale (AMS-6).
Discussion
To the best of our knowledge, the present study was the first to use parametric and nonparametric item response theory models to assess the psychometric properties of the AMS scale in a large sample of adult male outpatients.
We also explored the possibility of developing a short version of the AMS scale using MSA and Rasch analysis. One of the reasons for using MSA was that more items might be retained in the final scale, as opposed to traditional parametric approaches which make greater demands on items [Citation15].
This study suggested that the 6-item short version of the AMS scale was an appropriate measure of the construct of health-related quality of life in aging males. The AMS-6 scale consists of two subscales, the 5-item psychosomatic subscale and the 1-item sexual subscale. The 5-item psychosomatic subscale of the AMS-6 scale fits both the Mokken MHM and the Rasch model well. Therefore, the sum score of the 5-item psychosomatic subscale could be used to represent the severity of psychosomatic symptoms in men. The 5-item psychosomatic subscale has the property of sample-independent measurement. This subscale could be used to compare psychosomatic symptoms across different samples. The reliability measures of the 5-item psychosomatic subscale were good and comparable to the AMS scale. The 5-item psychosomatic subscale did not show invariant item ordering. This suggested that these 5 items tap the same level of the latent trait [Citation24]. This was further supported by the fact that the mean scores for five of these items were between 1.93 and 2.40.
With regard to the external validity of the AMS-6 scale, its two subscales were significantly correlated with the AMS scale. Our previous studies showed that the AMS scale was moderately or highly correlated with several psychosomatic scales, such as the Hospital Anxiety Depression scale [Citation11,Citation27], the Beck Depression Inventory [Citation28], the Insomnia Severity Index [Citation28], and the Gotland Male Depression scale [Citation29]. The 5-item psychosomatic subscale may be particularly useful in screening for clinically significant depression, anxiety, or sleep disturbance. We plan to conduct research to evaluate the utility of the 5-item psychosomatic subscale in clinical settings.
With regard to the sexual symptoms on the AMS scale, only “fewer morning erections” was retained after MSA and Rasch analysis. According to the European Male Aging Study (EMAS), “impaired sexual potency”, “fewer morning erections” and “disturbed libido” were considered equally important in the diagnosis of late-onset hypogonadism in men [Citation30]. Our Rasch analysis showed that these three symptoms largely overlapped in the measurement of the sexual dimension. Therefore, “impaired sexual potency” and “disturbed libido” were redundant and could be removed. Our study suggested that the EMAS criteria of three sexual symptoms could be reduced to “fewer morning erections” alone. The score for “fewer morning erections” was also highly correlated with the sexual subscore on the AMS scale. Therefore, we considered that assessment of “fewer morning erections” should be sufficient. The item responses of the other two sexual symptoms, “decreased beard growth” and “past peak”, were obviously different from “fewer morning erections”. Such results echo the inconsistent categorization of the two symptoms (“decreased beard growth” and “past peak”) in the literature about the AMS scale [Citation6,Citation11,Citation12].
In the validation study of the Taiwanese version of the AMS scale, factor analysis of the AMS scale showed psychosomatic and sexual factors [Citation11]. The psychosomatic factors encompassed the original psychological and somatovegetative factors on the AMS scale. Furthermore, the psychosomatic factors explained a majority of the variance of the AMS scale. Our study supported the two-factor structure of the AMS scale in Taiwanese men.
Our study has several strengths. We used a validated questionnaire to measure symptoms of aging and health-related quality of life. We had full data available from almost all participants. To the best of our knowledge, the sample was the largest clinical sample in the literature about the AMS scale. Furthermore, our present study was the first study to apply item-response theory to the AMS scale. The psychometric properties of the AMS-6 scale were at least as good as the original 17-item AMS scale. The psychosomatic and sexual subscales of the AMS-6 scale had stable indices of unidimensionality and sensitivity.
Some limitations of the study should also be mentioned. First, it should be noted that this study utilized a statistically driven approach to item reduction, rather than a selection of items for conceptual reasons. It is therefore possible that some omitted items represent unique, but important aspects of health-related quality of life in aging males. Further research is needed to determine whether the six items selected through this process adequately assess the multi-faceted construct of health-related quality of life in aging males. Second, we did not examine differential item functioning in the AMS-6 scale, so we did not know whether subgroups responded differently to the same questions. Third, the present study was cross-sectional, so we were unable to determine test-retest reliability of the AMS-6 scale.
Conclusions
A 6-item short form of the AMS scale demonstrated adequate psychometric properties and would therefore be useful for estimating health-related quality of life with a minimal burden on respondents. By minimizing the number of items needed to adequately estimate the level of health-related quality of life, researchers and clinicians may also be able to assess other symptoms, thereby gaining a fuller understanding of the respondent’s total range of symptoms.
Declaration of interest
The authors report no conflicts of interest. The authors are responsible for the content and writing of this paper.
This research received no specific grant from any funding agency in the public, commercial, or not-for-profit sectors.
References
- Heinemann LAJ, Zimmermann T, Vermeulen A, et al. A new ‘aging males’ symptoms’ rating scale. The Aging Male 1999;2:105–14
- Schneider G, Nienhaus K, Gromoll J, et al. Aging males’ symptoms in relation to the genetically determined androgen receptor CAG polymorphism, sex hormone levels and sample membership. Psychoneuroendocrinology 2010;35:578–87
- Honkalampi K, Lehto SM, Hintikka J, et al. Symptoms of depression and alexithymic burden in middle-aged men. Psychother Psychosom 2010;79:259–61
- Perchon LF, Pintarelli VL, Bezerra E, et al. Quality of life in elderly men with aging symptoms and lower urinary tract symptoms (LUTS). Neurourol Urodyn 2011;30:515–19
- Valenti G, Gontero P, Saccò M, et al. Harmonized Italian version of the Aging Males’ Symptoms scale. Aging Male 2005;8:180–3
- Daig I, Heinemann LAJ, Kim S, et al. The Aging Males’ Symptoms (AMS) scale: review of its methodological characteristics. Health Qual Life Outcomes 2003;1:77
- Heinemann LAJ, Saad F, Zimmermann T, et al. The Aging Males’ Symptoms (AMS) scale: update and compilation of international versions. Health Qual Life Outcomes 2003;1:15
- Streiner D, Norman G. Health measurement scales: a practical guide to their development and use. 4th ed. New York: Oxford University Press; 2008
- Chang CC, Su JA, Tsai CS, et al. Rasch analysis suggested three unidi-mensional domains for Affiliate Stigma Scale: additional psychometric evaluation. J Clin Epidemiol 2015;68:674–83
- Amin L, Rosenbaum P, Barr R, et al. Rasch analysis of the PedsQL: an increased understanding of the properties of a rating scale. J Clin Epidemiol 2012;65:1117–23
- Chen CY, Wang WS, Liu CY, Lee SH. Reliability and validation of a Chinese version of the Aging Males’ Symptoms scale. Psychol Rep 2007;101:27–38
- Horie S, Hisasue S, Nakao M, et al. Correlation between the Japanese Aging Male Questionnaire (JAMQ) and Aging Male’s Symptom (AMS) scale in Japanese male. Aging Male 2014;17:35–41
- Mokken R. A theory and procedure of scale analysis. Berlin: De Gruyter; 1971
- Sijtsma K, Molenaar I. Introduction to nonparametric item response theory. Thousand Oaks (CA): Sage; 2002
- Stochl J, Jones PB, Croudace TJ. Mokken scale analysis of mental health and well-being questionnaire item responses: a non-parametric IRT method in empirical research for applied health researchers. BMC Med Res 2012;12:74
- Sijtsma K, Junker BW. A survey of theory and methods of invariant item ordering. Br J Math Stat Psychol 1996;49:79–105
- Rasch G. Probabilistic models for some intelligence and attainment tests. Copenhagen: Danmarks Paedogogiske Institut; 1960
- Van der Ark LA. New Developments in Mokken Scale Analysis in R. J Stat Softw 2012;48:1–27
- Van der Linden W, Hambleton R. Handbook of modern item response theory. New York: Springer; 1997
- Tennant A, Conaghan PG. The Rasch measurement model in rheumatology: what is it and why use it? When should it be applied, and what should one look for in a Rasch paper? Arthritis Rheum 2007;57:1358–62
- Van der Ark LA. Mokken Scale Analysis in R. J Stat Softw 2007;20:1–19
- Galindo-Garre F, Hidalgo MD, Guilera G, et al. Modeling the World Health Organization Disability Assessment Schedule II using non-parametric item response models. Int J Methods Psychiatr Res 2014;24:1–10
- Molenaar I, Sijtsma K. User’s manual MSP5 for Windows. Groningen: IEC ProGAMMA; 2000
- Ligtvoet R, Van der Ark LA, Marvelde JM, Sijtsma K. Investigating an invariant item ordering for polytomously scored items. Educ Psychol Meas 2010;70:578–95
- Mair P, Hatzinger RJ. MM. eRm: extended Rasch modeling. R package version 1.5.1. Evanston (IL): Northwestern University; 2015
- Revelle W. Psych: procedures for psychological, psychometric, and personality Research. R package version 1.5.1. Evanston (IL): Northwestern University; 2015
- Lee CP, Jiang JR, Chen Y, et al. The “Aging Males’ Symptoms” (AMS) Scale assesses depression and anxiety. Aging Male 2013;16:97–101
- Chiu YW, Chu CL, Chen Y, et al. Complaint of insomnia as a predictor of aging symptoms in males at a men’s health clinic. Aging Male 2012;15:7–13
- Chu CL, Chen Y, Jiang KH, et al. Validity and clinical utilization of the Chinese version of the Gotland Male Depression Scale at a men’s health polyclinic. Neuropsychiatr Dis Treat 2014;10:1707–14
- Wu FC, Tajar A, Beynon JM, et al. Identification of late-onset hypogonadism in middle-aged and elderly men. N Engl J Med 2010;363:123–35