Abstract
Context: High fat diet (HFD) and low-dose streptozotocin (STZ) is an ideal model for type 2 diabetes mellitus (T2DM) that would closely reflect the natural history and metabolic characteristics of human T2DM and is also suitable for pharmacological screening.
Objective: The present study was designed to investigate the effect of the water extract (DVW) and the polar fraction of ethanol extract (DVE-4) of Dodonaea viscosa (L). Jacq. (Sapindaceae) on biochemical parameters in type 2 diabetes induced by a standardized HFD and low dose streptozotocin (25 mg/kg) in rats. Further, to elucidate the mode of action we evaluated its effects on a battery of targets involved in glucose homeostasis (in vitro studies).
Materials and methods: Different doses of DVW and DVE-4 were administered once daily for two weeks to HFD + STZ diabetic rats. Quantification of biomarker quercetin was done using HPLC.
Results and discussion: Both DVW and DVE-4 dose-dependently reduced blood glucose, serum insulin, homeostatic model assessment (HOMA), lipid profiles, and significantly improved glucose tolerance and HDL-c levels. In addition, the extract and fraction also decreased oxidative stress by improving endogenous antioxidants. In different, bioassays, DVW and DVE-4 showed inhibition of PTP-1B and at a concentration of 10 μg/mL showed 60 and 54.2% binding to PPARγ, respectively. Both extract/fraction exhibited stimulation of glucose uptake by skeletal muscles.
Conclusion: Taken together, these results suggest that DVW and DVE-4 inhibits HFD + STZ-induced insulin resistance, lipid abnormalities and oxidative stress indicating that these effects may be mediated by interacting with multiple targets operating in diabetes mellitus.
Introduction
Diabetes has emerged as a major global challenge in healthcare delivery, particularly in recent times, with the global incidence reaching epidemic proportions. Type 2 diabetes mellitus (T2DM) is a heterogeneous disorder with both genetic and environmental causes. Several key pathogenic abnormalities contribute to increased blood glucose levels in T2DM, which include abnormal insulin secretion caused by impaired β-cell function and insulin resistance in target tissues (CitationTaylor, 1999).
Although diet and exercise are the first steps toward achieving treatment goals of diabetics, 90% of patients with T2DM cannot maintain long-term glycemic control with diet and exercise alone. Thus, antihyperglycemic drugs are necessary for the treatment of T2DM (CitationBasciano et al., 2005). Presently available oral hypoglycemic agents exhibit several side effects. Therefore, there is a need for more effective oral antihyperglycemic agent, particularly those that normalize both insulin and glucose levels. A wide array of plants and its active principles, with minimal side effects, provide an alternate therapy for T2DM. Moreover, the plant kingdom represents a largely unexplored reservoir of biologically active compounds.
Dodonaea viscosa (L.; Hop bush). Jacq. (Sapindaceae) popularly known as aliar and vilayati mehandi in India, is an evergreen shrub abundantly growing in Western Ghats of Karnataka, India. The species has been used in traditional medicine to heal simple ulcers (CitationPerry & Metzger, 1980), fractures, sores and for snakebite and immediate relief of gum and tooth pain (CitationKirtikar & Basu, 1993). Experimental studies have demonstrated antimicrobial, anti-inflammatory (CitationGetie et al., 2003), anti-ulcer (CitationVeerapur et al., 2004), wound healing (CitationJoshi et al., 2003), local anesthetic, and smooth muscle relaxant activities (CitationRajas et al., 1996).
The hypoglycemic effect of the plant has been indicated by CitationAswal et al. (1984), when screening 294 plants of Indian origin. In addition, earlier studies in our laboratory showed that water extract (DVW) and polar fraction of ethanol extract (DVE-4) of D. viscosa (400-800 mg/kg) failed to improve the glucose tolerance in normal rats. Moreover, repeated administration of DVW and DVE-4 for fifteen days also failed to produce hypoglycemia in normal rats. In other words, neither of the two extracts alters normal glycemic control in animals (CitationVeerapur et al., 2009). However, both extracts reduced blood glucose levels of STZ-induced mild diabetic (MD) condition in rats indicating that they are active only in diabetic conditions (CitationVeerapur et al., 2009). Therefore the action of both extract and fraction may be considered more corrective than disruptive. Further, the lack of hypoglycemic action in the hypoinsulinemic model (severe diabetic (SD) or type 1 diabetic model) demonstrates that DVW and DVE-4 probably operate by improving the extra-pancreatic glycemic control mechanisms rather than augmenting insulin secretion from remnant pancreatic β-cells (our own unpublished data).
In the present study, we evaluated the effect of the extract and fraction in a type 2-like diabetic model induced by a combination of high fat diet and low dose streptozotocin in rats. Furthermore, we attempted to isolate bioactive components from the active fraction of the ethanol extract of Dodonaea viscosa (DVE-4). Preliminary phytochemical, co-TLC and chromatographic studies, resulted in the isolation of a prominent biomarker, quercetin, and its estimation in DVE-4 using HPLC.
Materials and methods
Chemicals
The feed ingredients such as casein sodium salt from bovine milk (Sigma, C8654), cholesterol and sodium cholate (Hi-Media Laboratories, Mumbai, India), sodium carboxymethylcellulose (Na-CMC), and DL methionine (both from Loba Chemie, Mumbai), vitamin and mineral mix (D protein from British Biologicals, Bangalore, India), and yeast powder (Eagle Products, Mumbai) were procured from commercial sources. Lard (pig fat) was collected from the local slaughter house. Streptozotocin (STZ), bovine serum albumin (BSA), 5,5′-dithio-bis-2-nitrobenzoic acid (DTNB, Ellman’s reagent), 1-chloro-2, 4-dinitrobenzene (CDNB), reduced glutathione (GSH), superoxide dismutase (SOD) were purchased from Sigma, St. Louis, MO. Pioglitazone was a gift sample from Amoli Organics, Mumbai. All solvents and chemicals used were of analytical grade, solvents for HPLC were of HPLC grade procured from Qualigens Fine Chemicals, India. Nanopure water from a Millipore Milli-Q system (Bangalore, India) was used for preparing the solutions and all the solutions were prepared fresh.
Plant material
The whole plant of Dodonaea viscosa was collected in and around Dharwad, Karnataka during the month of September 2006. The plant was authenticated by M. Jayaraj, Department of Botany, Karnataka University, Dharwad, and a voucher specimen (MCOPS/PC/05/06) of the plant is kept in the college herbarium.
Extraction and fractionation
The coarse powdered material (4 kg) of the shade-dried plant was extracted exhaustively with ethanol in a Soxhlet apparatus, and subsequently extracted with water over a hot water bath. The extractives were concentrated to a small volume and evaporated to dryness in a vacuum desiccator to yield free flowing ethanol extract (DVE) (yield: 333 g) and water extract (DVW) (yield: 445 g).
Dried DVE (246 g) was fractionated by the adsorptive solvent extraction method. Briefly, the extract was dissolved in ethanol (200 mL) and adsorbed onto silica gel (120) and air dried. This was extracted successively using solvents of increasing polarity (4 × 400 mL each) to yield the following fractions: 1) petroleum ether (60-80 C) (DVE-1; yield 52.8 g), 2) chloroform (DVE-2; yield 35.4 g), 3) ethyl acetate (DVE-3; yield 64.3 g) and 4) methanol (DVE-4; yield 89.4 g).
Silica gel chromatography of bioactive fraction-DVE-4
DVE-4 (89.4 g) was obtained from the fractionation of DVE (246 g) by adsorptive solvent extraction as explained above. DVE-4 (20 g) was loaded on to a silica gel column built in hexane (silica:sample = 3:1). The column was then eluted successively with: 1) hexane (trace), 2) hexane-ethyl acetate (75:25; 1.17 g, 5.85%), 3) hexane-ethyl acetate (50:50; 1.2 g, 6%), 4) hexane-ethyl acetate (25:75; 1.6 g, 8%), 5) ethyl acetate (2.2 g, 11%), 6) ethyl acetate-methanol (75:25; 4.4 g, 22%), 7) ethyl acetate-methanol (50:50; 2.5 g, 13%), 8) ethyl acetate-methanol (25:75; 1.1 g, 5.5%), 9) methanol (1.5 g, 7.5%). The 100 mL sub-fractions were collected and pooled based on their chromatographic patterns on TLC and evaporated to dryness in a rotary flash evaporator.
Sub-fractions 6 and 7 were rich in flavonoids, so this combined sub-fraction (DVF: 6.9 g) was loaded on to a silica gel column loaded in ethyl acetate (silica:sample = 3:1). The column was then eluted successively with graded mixtures of ethyl acetate (EtOAc) and methanol (MeOH). 50 mL each of eluate was collected. All the fractions were collected and pooled based on TLC and designated as EtOAc fraction (DVF1), EtOAc:MeOH (80:20) (DVF2), EtOAc:MeOH (60:40) (DVF3), EtOAc:MeOH (40:60) (DVF4), EtOAc:MeOH (20:80) (DVF5), MeOH (DVF6). The sub-fraction DVF3 yielded a yellow colored compound (DVF3a) on keeping overnight in respective solvent mixture. The TLC was performed using various solvent systems to resolve DVF3a, the one containing toluene:ethyl acetate:formic acid:methanol (3:3:0.8:0.2 v/v) gave the best resolution.
Estimation of bioactive quercetin (DVF3a) in DVE-4 using HPLC method
Preparation of calibration curve of quercetin
Standard solutions (20 μL) of quercetin (0.25 to 4 μg/mL) were injected in triplicate into the reverse phase (RP-C18) packed column from Supelcosil, PA, USA (250 mm × 4.6 mm; particle size 5 μm) using HPLC (LC-10ADvP, Shimadzu Corporation, Kyoto, Japan). Isocratic elution using methanol, water, and phosphoric acid (ratio 41:58.9:0.1%) at a total flow rate of 1 mL/min and elution was monitored by using PDA detector. The chromatograms at 280 nm were analyzed and a calibration curve was constructed by plotting the area under the peak versus the corresponding concentration of quercetin.
Quantification of quercetin in the DVE-4
Sample solution (1 mg/mL; 20 μL) was injected in triplicate into the reverse phase packed column. The sample was run and scanned as described above. The peak areas were recorded and the amount of quercetin in the sample was calculated using the linear regression equation derived from the calibration curve of standard quercetin.
Animals
Eighty-five Albino Wistar male rats 7-8 weeks old and weighing 200-250 g were used. The animals were obtained from the inbred animal colony of the central animal house, Kasturba Medical College, MAHE, Manipal, India. The animals were maintained under controlled conditions of temperature (23° ± 2°C), humidity (50% ± 5%) and 12 h light-dark cycles. The animals were randomized into experimental and control groups and housed individually in sanitized polypropylene cages containing sterile paddy husk as bedding. They had free access to standard pellets as basal diet and water ad libitum. All the studies conducted were approved by the Institutional Ethical Committee, Kasturba Medical College, Manipal (vide letter IAEC/KMC/06/2004-2005), according to the prescribed guidelines of the Committee for the Purpose of Control and Supervision of Experiments on Animals (CPCSEA), Government of India. We selected male animals for all our studies, since females are shown to be protected from changes in lipid-induced insulin action (CitationHevener et al., 2002).
Development of high fat diet and low dose STZ-induced type 2 diabetic rat model
The rats were allocated into two dietary regimens and were fed on either normal pellet diet (NPD) (4.1% fat, 22.2% protein, and 12.1% carbohydrates, as a percentage of total kcal) or high fat diet (HFD) (58% fat, 25% protein and 17% carbohydrate, as a percentage of total kcal) ad libitum, for an initial period of two weeks. The composition () and preparation of the HFD has been described earlier (CitationSrinivasan et al., 2005).
Table 1. Composition of high fat diet.
Three doses (25, 35, and 45 mg/kg, i.p.) of STZ were given to HFD rats to select the optimum dose, comparing with controls (NPD and HFD alone groups). After seven days, blood glucose (BGL) levels were estimated by the enzymatic glucose oxidase method using a commercial glucometer (Accu-chek® Active, Roche Diagnostic, Mannheim, Germany) and serum insulin was estimated by radioimmunoassay method using the kit from Bhabha Atomic Research Centre, Mumbai, India. Homeostatic model assessment (HOMA) as a measure of insulin resistance was calculated by formula (CitationRajasekar et al., 2005). A dose of 25 mg/kg was found to be most appropriate in producing the required results (). This dose has been standardized and used throughout this particular experiment.
Table 2. Effect of high fat diet (HFD) and different doses of STZ on body weight and biochemical parameters in rats.
Effect of DVW and DVE4 in high fat diet and low dose STZ-induced type 2 diabetic rat model
The rats were allocated into two dietary regimens and fed either NPD or HFD as explained above for the initial period of two weeks. On the fourteenth day, 12 h fasted HFD rats were administered a single intraperitoneal injection of STZ (25 mg/kg) (the chosen optimum dose) while NPD rats were given an equivalent volume of the vehicle alone.
The high fat diet and STZ-treated (HFD + STZ) diabetic rats with the fasting blood glucose level ≥ 200 mg/dL were randomized into different groups after three weeks of dietary manipulation (i.e., after one week of STZ injection) so that their mean blood glucose levels were not different from each other. In order to determine the validity and suitability of this model, insulin sensitizer pioglitazone was used as positive control. The doses of DVW and DVE-4 were selected based on our earlier study of STZ-induced mild diabetic condition (CitationVeerapur et al., 2009) and treated for two weeks. The rats were allowed to continue to feed on their respective diets until the end of the study.
Treatment protocol
The experimental rats were divided into seven groups (n = 5) and treated as follows Group 1: NPD rats received 1% Na CMC (∼2 mL/kg/day, p.o.) Group 2: HFD + STZ diabetic control rats received 1% Na CMC (∼2 mL/kg/day, p.o.) Group 3: HFD + STZ diabetic rats treated with DVW (200 mg/kg/day, p.o.) Group 4: HFD + STZ diabetic rats treated with DVW (400 mg/kg/day, p.o.) Group 5: HFD + STZ diabetic rats treated with DVE-4 (100 mg/kg/day, p.o.) Group 6: HFD + STZ diabetic rats treated with DVE-4 (200 mg/kg/day, p.o.) Group 7: HFD + STZ diabetic rats treated with Pioglitazone (10 mg/kg/day, p.o.).
Oral glucose tolerance test (OGTT)
At the end of five weeks of dietary manipulation (i.e., two weeks of respective drug treatment), glucose (2 g/kg) was administered to 12 h fasted rats and blood samples were collected from the caudal vein by means of a small incision at the end of the tail at 0 (immediately after glucose load), 30, 60 and 120 min after glucose administration. BGL was estimated by the enzymatic glucose oxidase method using a commercial glucometer. The results were expressed as the integrated area under the curve for glucose (AUCglucose), which was calculated by trapezoid rule.
Estimation of biochemical parameters
After completion of OGTT, blood samples were collected from retro-orbital plexus. Serum was separated and analyzed spectrophotometrically for triglyceride (STG), total cholesterol (STC), HDL-cholesterol (HDL-c), using diagnostic reagent kit (Nicholas Piramal, Mumbai). Serum insulin (SI) was estimated by radioimmunoassay method using a kit from Bhabha Atomic Research Centre, Mumbai. HOMA, TC/HDL-c, LDL-c/HDL-c, VLDL-cholesterol (VLDL-c) and LDL-cholesterol (LDL-c) in serum were calculated (CitationRajasekar et al., 2005; CitationFriedewald et al., 1972).
Endogenous antioxidant status
Animals were sacrificed by cervical dislocation, the liver was perfused with saline; the whole liver was dissected out. Ten percent homogenates of the livers of each rats of different group were prepared with ice cold saline-EDTA and protein content was determined (CitationLowry et al., 1951). The homogenates were further subjected to the estimation of non-enzymatic (reduced glutathione and total thiols) and enzymatic antioxidants (catalase, GST, and SOD) using standardized protocols of our laboratory quoted in our previous publication (CitationPrabhakar et al., 2006). Lipid peroxidation levels of the liver homogenates were also determined (CitationGelvan & Saltman, 1990).
Mechanistic studies
Protein tyrosine phosphatase-1B (PTP-1B) inhibition assay
This assay is based on the principle of dephosphorylation of para-nitrophenyl phosphate (pNPP) by PTP-1B into yellow chromogen para-nitrophenol (pNP) and phosphate (CitationZang & Lee, 2003). Inhibition of PTP-1B was followed as per the product brochure from m/s Upstate, NY, USA, catalog number 14358.
PPAR-γ binding assay
The shift in polarization value in the presence of test compounds was used to determine relative affinity of test compounds for the PPAR-LBD (PPAR γ-ligand binding domain) (CitationJi-Hu et al., 1999). The assay was performed as per the product brochure of PolarScreen™ PPAR competitor assay, green from PANVERA (Invitrogen discovery screening, Bangalore, India) catalog number PV3355.
Glucose uptake by isolated hemi-diaphragm of diabetic rats
Induction of diabetes mellitus
Diabetes was induced in male Wistar rats (150-200 g) by a single intraperitoneal injection of STZ (45 mg/kg) after overnight fasting for 12 h. Rats showing blood glucose level >200 mg/dL 72 h after STZ administration were considered diabetic and were included in the study.
Isolation of diaphragm
The diabetic rats were fasted overnight and killed by cervical dislocation. The diaphragms were dissected out quickly with minimal trauma and divided into two equal halves. Two diaphragms from the same rat were not used for the same set of experiments.
Experimental design
Ten sets of six graduated test tubes each, were grouped as follows
Group 1: 2 mL Tyrode solution with 2 g% glucose (diabetic control);
Group 2: 2 mL Tyrode solution with 2 g% glucose + insulin (Nova Nordisk) 0.62 mL of 0.4 U/mL solution (insulin-treated group);
Group 3: 2 mL of Tyrode solution with 2 g% glucose + DVW (25 μg/mL);
Group 4: 2 mL of Tyrode solution with 2 g% glucose + DVW (50, μg/mL);
Group 5: 2 mL of Tyrode solution with 2 g% glucose + DVW (100 μg/mL);
Group 6: 2 mL of Tyrode solution with 2 g% glucose + DVE-4 (25 μg/mL);
Group 7: 2 mL of Tyrode solution with 2 g% glucose + DVE-4 (50 μg/mL);
Group 8: 2 mL of Tyrode solution with 2 g% glucose + DVE-4 (100 μg/mL);
Group 9: 2 mL of Tyrode solution with 2 g% glucose + insulin (Nova Nordisk) 0.62 mL of 0.4 U/mL solution + DVW (100 μg/mL);
Group 10: 2 mL of Tyrode solution with 2 g% glucose + insulin (Nova Nordisk) 0.62 mL of 0.4 U/mL solution + DVE-4 (100 μg/mL).
The volumes of all graduated test tubes were made up to 4 mL with distilled water. The hemi-diaphragms were placed in test tubes and incubated for 30 min at 37°C bubbled with oxygen with continuous shaking. Glucose uptake per g of tissue was calculated as the difference between the initial and final glucose content in the incubated medium (CitationGhosh et al., 2004).
Statistical evaluation
The data were expressed as mean ± SEM. Statistical comparisons were performed by one-way ANOVA followed by Tukey’s post-test using GraphPad Prism version 4.0.
Results
Silica gel chromatography of bioactive fraction-DVE-4
DVF3a is identified as quercetin by comparing the Rf values (0.63) in TLC and UV spectra with shift reagents (CitationMarkham, 1982).
Estimation of bioactive quercetin in DVE-4 using HPLC method
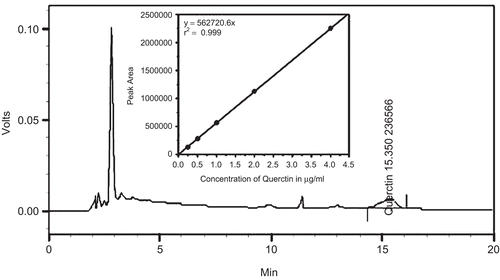
Quercetin showed a retention time 15.35 min in the presence of other compounds in DVE-4 (). Moreover, the presence of quercetin in DVE-4 was confirmed by comparing the UV spectrum of standard quercetin. The amount of quercetin in DVE-4 was found to be 2.1% w/w.
Figure 1. Reversed-phase HPLC chromatogram of DVE-4 showing the presence of quercetin, separated on a RP-C18 column (Supelcosil, Ballefonte, PA, USA): 250 mm × 4.6 mm; particle size 5 µm) using HPLC system (LC-10ADvP, Shimadzu Corporation, Kyoto, Japan). Isocratic elution using methanol, water and phosphoric acid (ratio: 41:58.9:0.1%) at a total flow rate of 1 mL/min and the chromatogram at 280 nm was analyzed. Inset: HPLC standard calibration curve of quercetin.
High fat diet and low dose STZ-induced type 2 diabetic rat model
High fat diet (HFD) significantly increased (p <0.001) body weight of rats compared to NPD. Further, HFD also significantly elevated basal BGL, SI and HOMA (measure of insulin resistance) at the end of three weeks of dietary manipulation ().
At the end of three weeks, HFD + STZ (25 mg/kg, i.p.) significantly (p <0.001) increased levels of BGL, SI and HOMA values, indicating a higher level of insulin resistance in this group compared to animal groups receiving only HFD or NPD. Further, HFD + STZ (25 mg/kg) produced significant reduction in body weights compared to HFD rats, which was still significantly higher (p <0.05) than NPD rats (). Also, all HFD + STZ diabetic rats developed symptoms of polyphagia, polydipsia and polyuria when compared to NPD rats.
However, HFD + STZ (35 and 45 mg/kg, i.p.) produced significantly higher (p <0.001) BGL and drastic reduction (p <0.05; p <0.01) in body weights of HFD rats. Further, HFD + STZ (35 mg/kg) diabetic rats showed significantly reduced (p <0.001) SI levels and HOMA values (). Therefore a dose of 25 mg/kg of STZ was chosen as optimum for inducing type 2 like diabetic condition in rats fed on HFD. This dose was selected to screen the extracts/fractions.
Effect of DVW and DVE4 in high fat diet and low dose STZ-induced type 2 diabetic rat model
Blood glucose, serum insulin and HOMA
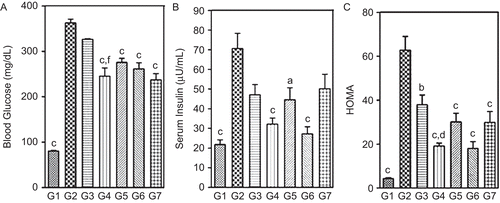
At the end of five weeks of dietary manipulation (i.e., after three weeks of STZ (25 mg/kg,) injection), HFD + STZ diabetic rats exhibited significant (p <0.001) hyperglycemia (BGL levels rose to between 340 to 384 mg/dL) and hyperinsulinemia (70.7 ± 7.7 μU/mL) as compared to NPD rats. The degree of insulin resistance as calculated by HOMA was higher in HFD + STZ diabetic rats (). Oral administration of DVW and DVE-4 to HFD + STZ diabetic rats for two weeks significantly (p <0.01; p <0.001) reduced BGL, SI levels and HOMA values (). However, oral administration of pioglitazone significantly reduced BGL (34.6%) without markedly altering SI levels. In addition, pioglitazone improves insulin sensitivity by lowering HOMA values significantly (p <0.001) (). Interestingly, the observed beneficial effects of DVW and DVE-4 were found to be not at the expense of feed intake or body weight alterations.
Figure 2. Effect of two-week treatment with DVW and DVE-4 on (A) blood glucose (BGL), (B) serum insulin (SI), (C) homeostatic model assessment (HOMA) levels in HFD and STZ (25 mg/kg)-treated diabetic rats. (G1) NPD control; (G2) HFD + STZ diabetic control; (G3) HFD + STZ diabetic rats treated with DVW (200 mg/kg); (G4) HFD + STZ diabetic rats treated with DVW (400 mg/kg); (G5) HFD + STZ diabetic rats treated with DVE-4 (100 mg/kg); (G6) HFD + STZ diabetic rats treated with DVE-4 (200 mg/kg); (G7) HFD + STZ diabetic rats treated with pioglitazone (10 mg/kg). Each bar represents the mean ± SEM (n = 5). ap <0.05; bp <0.01; cp <0.001 compared with HFD + STZ diabetic rats; dp <0.05; fp <0.001 compared to HFD + STZ diabetic rats treated with DVW (200 mg/kg).
Oral glucose tolerance test (OGTT)
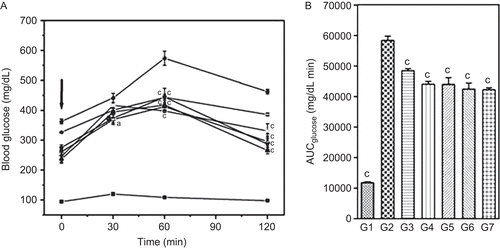
Administration of glucose (2 g/kg, p.o.) did not produce any significant change in the BGL levels of NPD rats and also the AUC for the 120-min interval was not altered. The HFD + STZ diabetic rats exhibited significant elevation in fasting BGL (at time zero) and showed significant impairment in glucose tolerance to exogenously administered glucose compared to NPD rats (). Treatment with different doses of DVW and DVE-4 showed significant (p <0.05; p <0.001) reduction in BGL levels over the 120 min compared to HFD + STZ diabetic rats (). Further, estimation of AUC values indicated that, treatment with pioglitazone, higher doses of DVW (400 mg/kg) and DVE-4 (200 mg/kg) showed 27.7%, 24.6%, 27.4%, and 25.9% decrease in BGL levels respectively compared to HFD + STZ diabetic rats ().
Figure 3. Effect of two-week treatment with DVW and DVE-4 on glucose tolerance in fasted HFD and STZ (25 mg/kg)-treated diabetic rats. (A) Blood glucose concentrations were measured prior to, and after p.o. administration of glucose alone (2g/kg body weight), or in combination with DVW or DVE-4 or pioglitazone. The time of glucose administration is indicated by the arrow (0 min). (B) Area under curve for glucose (AUCglucose) values for 0-120 min post-glucose load. (G1) –▪– NPD control; (G2) –•– HFD + STZ diabetic control; (G3) –□– HFD + STZ diabetic rats treated with DVW (200 mg/kg); (G4) −○− HFD + STZ diabetic rats treated with DVW (400 mg/kg); (G5) –★– HFD + STZ diabetic rats treated with DVE-4 (100 mg/kg); (G6) –▵– HFD + STZ diabetic rats treated with DVE-4 (200 mg/kg); (G7) −▴− HFD + STZ diabetic rats treated with pioglitazone (10 mg/kg). Data represent the mean ± SEM for 5 rats. ap <0.05; cp <0.001 as compared with HFD + STZ diabetic rats.
Lipid parameters
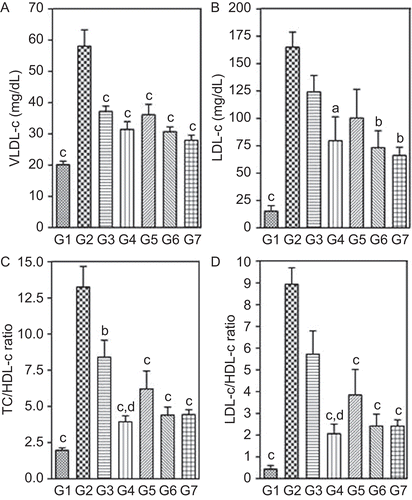
HFD + STZ diabetic rats exhibited significantly (p <0.001) higher levels of STG, STC, VLDL-c and LDL-c, whereas lower levels of HDL-c compared to NPD rats. Further, the markers of dyslipidemia such as TC/HDL-c and LDL-c/HDL-c ratios were significantly elevated ( and ). Treatment with DVW and DVE-4 showed significant (p <0.01; p <0.001) reduction in STG, STC, VLDL-c and LDL-c levels and increased HDL-c levels, as compared to HFD + STZ diabetic rats ( and ). Treatment also significantly reduced (p <0.001) markers of dyslipidemia (). Further, treatment with pioglitazone significantly diminished STG (51.9%), STC (49.7%), VLDL-c (51.9%), and LDL-c (59.9%) levels respectively. Moreover, pioglitazone also significantly increased HDL-c levels and decreased levels of dyslipidemic markers ( and ).
Figure 4. Effect of two-week treatment with DVW and DVE-4 on (A) serum TG, (B) serum TC, (C) serum HDL-c levels in HFD and STZ (25 mg/kg)-treated diabetic rats. (G1) NPD control; (G2) HFD + STZ diabetic control; (G3) HFD + STZ diabetic rats treated with DVW (200 mg/kg); (G4) HFD + STZ diabetic rats treated with DVW (400 mg/kg); (G5) HFD + STZ diabetic rats treated with DVE-4 (100 mg/kg); (G6) HFD + STZ diabetic rats treated with DVE-4 (200 mg/kg); (G7) HFD + STZ diabetic rats treated with pioglitazone (10 mg/kg). Each bar represent the mean ± SEM (n = 5). ap <0.05; bp <0.01; cp <0.001 compared with HFD + STZ diabetic rats; ep <0.01 compared to HFD + STZ diabetic rats treated with DVW (200 mg/kg).
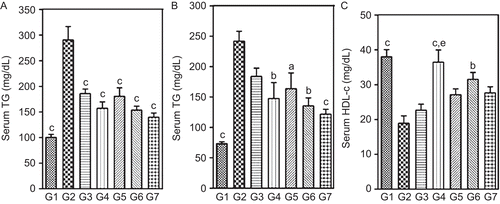
Figure 5. Effect of two-week treatment with DVW and DVE-4 on (A) VLDL-c, (B) LDL-c, (C) TC/HDL-c ratio, (D) LDL-c/HDL-c ratio in HFD and STZ (25 mg/kg)-treated diabetic rats. (G1) NPD control; (G2) HFD + STZ diabetic control; (G3) HFD + STZ diabetic rats treated with DVW (200 mg/kg); (G4) HFD + STZ diabetic rats treated with DVW (400 mg/kg); (G5) HFD + STZ diabetic rats treated with DVE-4 (100 mg/kg); (G6) HFD + STZ diabetic rats treated with DVE-4 (200 mg/kg); (G7) HFD + STZ diabetic rats treated with pioglitazone (10 mg/kg). Each bar represent the mean ± SEM (n = 5). ap <0.05; bp <0.01; cp <0.001 compared with HFD + STZ diabetic rats. dp <0.05 compared to HFD + STZ diabetic rats treated with DVW (200 mg/kg).
Endogenous antioxidant levels
Lipid peroxidation
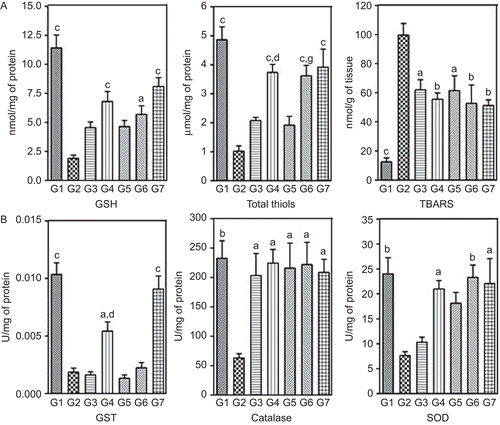
NPD rats showed basal TBARS levels of about 12.53 ± 2.7 nmol/g of liver tissue. HFD + STZ diabetic rats showed significantly increased (p <0.001) in TBARS levels (99.58 ± 7.9 nmol/g of tissue). Treatment with different doses of DVW and DVE-4 significantly (p <0.05; p <0.01; p <0.001) abolished the increase in TBARS levels induced by HFD + STZ ().
Figure 6. Effect of two-week treatment with DVW and DVE-4 on (A) non-enzymatic antioxidants (GSH and total thiols) and TBARS, (B) enzymatic antioxidants, in the liver homogenates of HFD and STZ (25 mg/kg)-treated diabetic rats. (G1) NPD control; (G2) HFD + STZ diabetic control; (G3) HFD + STZ diabetic rats treated with DVW (200 mg/kg); (G4) HFD + STZ diabetic rats treated with DVW (400 mg/kg); (G5) HFD + STZ diabetic rats treated with DVE-4 (100 mg/kg); (G6) HFD + STZ diabetic rats treated with DVE-4 (200 mg/kg); (G7) HFD + STZ diabetic rats treated with pioglitazone (10 mg/kg). Each bar represent the mean ± SEM (n = 5). ap <0.05; bp <0.01; cp <0.001 compared with HFD + STZ diabetic rats; dp <0.05 compared to HFD + STZ diabetic rats treated with DVW (200 mg/kg); gp <0.05 compared to HFD + STZ diabetic rats treated with DVE-4 (100 mg/kg).
Non-enzymatic antioxidants
HFD + STZ diabetic rats showed significantly decreased (p <0.001) levels of GSH (1.9 ± 0.3 nmol/mg of protein) and total thiols (1.02 ± 0.18 μmol/mg of protein) in comparison to NPD rats. Treatment with higher doses of DVW (400 mg/kg) and DVE-4 (200 mg/kg) showed significant (p <0.05; p <0.01; p <0.001) improvement in GSH and total thiol levels ().
Enzymatic antioxidants
HFD + STZ diabetic rats exhibited significantly reduced (p <0.001) levels of GST (0.0019 ± 0.0003 U/mg of protein), catalase (63.08 ± 7.21 U/mg) and SOD by about 3.5 folds (7.63 ± 0.79 U/mg of protein) compared to NPD rats. Treatment with higher doses of DVW and DVE-4 showed significantly (p <0.05; p <0.01) increased levels of GST, catalase and SOD ().
Mechanistic studies
Protein tyrosine phosphatase-1B (PTP-1B) inhibition assay
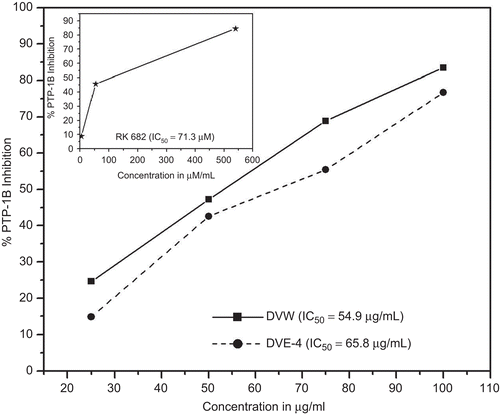
Both DVW and DVE-4 showed dose-dependent inhibition of PTP-1B. Positive control (RK 682) showed an IC50 71.3 μM (inset ). DVE-4 showed lower PTP-1B inhibition (IC50: 65.8 μg/mL) than DVW (IC50: 54.9 μg/mL) ().
PPAR-γ binding assay
Rosiglitazone at 25 μM concentration showed 78.1% binding ability to PPAR γ-LBD and 0.54 μM was required to bind 50% of PPAR γ -LBD. DVW and DVE-4 at concentration 10 μg/mL, showed 60 and 54.2% ability to bind with PPAR γ-LBD, respectively.
Glucose uptake by isolated hemi-diaphragm of diabetic rats
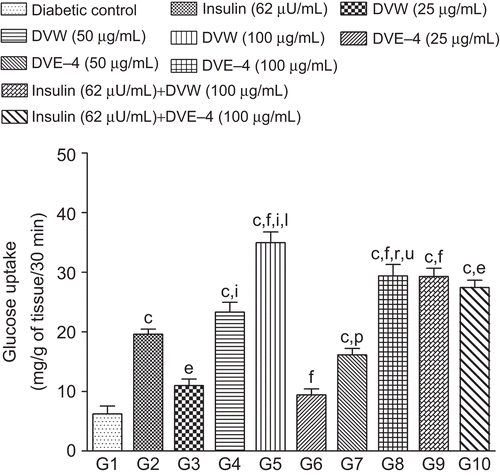
Insulin (62 μU/mL) caused stimulation of glucose uptake leading to ∼2-fold increase compared to diabetic control values. DVW and DVE-4 showed concentration-dependent stimulation of glucose uptake by isolated hemi-diaphragm (). Stimulation of glucose uptake by hemi-diaphragm after a 30-min exposure of 100 μg/mL of DVW and DVE-4 was 35 ± 1.8 and 29.4 ± 1.9 mg/g of tissue, respectively, and showed significantly (p <0.001) higher activity compared to diabetic control and insulin treated groups (6.2 ± 1.3 and 19.6 ± 0.9 mg/g, respectively). It appears that both extract and fraction have direct peripheral glucose uptake stimulatory action. Further, treatment of DVW/DVE-4 (100 μg/mL) and insulin in combination was less effective (but not significantly) than DVW/DVE-4 alone. However, a combination of insulin and DVW/DVE-4 stimulated glucose uptake (p <0.001; p <0.01) more effectively than insulin alone ().
Figure 8. Effect of different concentration of DVW and DVE-4 on glucose uptake by isolated hemi-diaphragm of diabetic rat. Bar graph represents the glucose uptake mg/g of tissue/30 min. Each value represents mean ± SEM, n = 6. cp <0.001 compared to diabetic control; ep <0.01, fp <0.001 compared to insulin treated group; ip <0.001 compared to DVW (25 μg/mL) treated group; lp <0.001 compared to DVW (50 μg/mL) treated group; pp <0.05, rp <0.001 compared to DVE-4 (25 μg/mL) treated group; up <0.001 compared to DVE-4 (50 μg/mL) treated group.
Discussion
In the present study, injection of STZ (35 and 45 mg/kg) caused frank hyperglycemia in HFD rats. Further, these rats were insulin deficient and also showed lower HOMA values, indicating that they were less insulin resistant. Moreover, these diabetic rats exhibited a drastic reduction in body weight and four rats died within one week of STZ administration. Thus, these STZ + HFD (35 and 45 mg/kg) rats resembled more closely type 1 diabetes. Whereas, STZ + HFD (25 mg/kg) rats produced frank hyperglycemia with increased levels of BGL, SI and HOMA values, suggesting that, they were under higher insulin resistance compared to NPD, HFD and HFD + STZ (35 mg/kg). Thus STZ + HFD (25 mg/kg) rats can be more closely considered to represent the pathophysiological state of type 2 diabetes. Therefore, HFD in combination with 25 mg/kg of STZ was selected to screen the extracts/fractions.
The hypertriglyceridemia observed in HFD + STZ (25 mg/kg) rats may be due to increased absorption and formation of triglycerides in the form of chylomicrons from exogenous fat-rich diet or through a combination of increased endogenous production of TG-enriched hepatic VLDL and decreased TG-uptake in peripheral tissues (CitationSrinivasan et al., 2004). Hypercholesterolemia may be attributed to increased absorption of dietary cholesterol from HFD in a diabetic condition (CitationShafrir, 2003). HFD + STZ (25 mg/kg) rats exhibited significantly lower glucose tolerance than NPD rats. The frank hyperglycemia and reduced glucose tolerance in the presence of near normal SI values indicate the persistence of insulin resistance even after 25 mg/kg of STZ injection in HFD rats.
Using this HFD + STZ (25 mg/kg, i.p.) rat model, we investigated the effect of optimized doses of DVW and DVE-4 on biochemical parameters. The administration of these extracts/fractions for two weeks resulted in a significant reduction in BGL, SI, STG, STC and other dyslipidemic markers, indicating their potent antihyperglycemic and hypolipidemic activity. Further, supplementation of extract/fraction reduced HOMA values and improved glucose tolerance, suggesting a decrease in insulin resistance caused by HFD + STZ treatment. Moreover, extract/fraction markedly ameliorated adverse changes in endogenous antioxidant levels and in turn reduced oxidative stress in HFD + STZ rats.
The in vivo results prompted us to evaluate the influence of extract/fraction on a battery of targets involved in glucose homeostasis such as PTP-1B, PPAR γ binding and glucose uptake studies.
Antidiabetic activity of thiazolidinedione (TZD) correlates with the order of affinity for PPAR γ binding or order of potency for PPAR γ transactivation (CitationBerger & Bailey, 1996). Both DVW and DVE-4 showed similar binding ability to LBD of PPAR γ. PTP-1B, a negative regulator of insulin and leptin signal transduction, is considered to be an important drug target in diabetes and obesity. Overexpression of PTP-1B is observed in insulin resistance models such as HFD + STZ and HFD in rats (CitationShimizu et al., 2003; CitationBasciano et al., 2005). Our data showed that both DVW and DVE-4 inhibit PTP-1B (), suggesting an additional mechanism to their insulin sensitizing activity. Altered glucose transport associated with defective GLUT4 translocation coupled with impaired insulin signaling cascade are among the major defects in insulin resistance (CitationLaville et al., 1996). Furthermore, PPAR γ agonists have been shown to facilitate the glucose transport in T2DM (CitationPetersen et al., 2000). Treatment with DVW/DVE-4 increased glucose uptake by isolated rat hemi-diaphragm of diabetic rats compared to the insulin-treated group, indicating that the extract/fraction also plays a direct role in peripheral glucose uptake ().
Quercetin, which could be among the active principles present in the test extracts, was isolated and quantified in bioactive-DVE-4 by column chromatography and HPLC methods, respectively. The proposed method of isolation of quercetin gave a 0.97% w/w yield. However, the amount of quercetin in the DVE-4 was determined to be 2.1% w/w as quantified by HPLC method. Therefore, the amount of quercetin present in tested doses (100 and 200 mg/kg) of DVE-4 is 2.1 and 4.2 mg/kg, respectively (in vivo studies).
Quercetin is reported to be active in different diabetic conditions and is also found to ameliorate oxidative stress in STZ-induced diabetic rats (CitationMahesh & Venugopal, 2004). It is reported that quercetin (10 mg/kg, i.p. for 10 days) had no effect on plasma glucose level of normal rats while it significantly and dose-dependently (10 and 15 mg/kg, i.p. for 10 days) decreased the plasma glucose levels of STZ-induced diabetic rats and significantly reduced plasma cholesterol and triglycerides. Further, quercetin (10 mg/kg) exerted no effect on the glucose tolerance curve of the normoglycemic rats, while it normalized the glucose tolerance curves of the STZ diabetic rats (10 and 15 mg/kg) (CitationVessal et al., 2003). A similar pattern of activity was observed with DVE-4 by us (CitationVeerapur et al., 2009), probably because it contains quercetin (2.1% w/w) as a major constituent. Quercetin is also reported to increase significantly, hepatic glucokinase activity in diabetic rats (CitationVessal et al., 2003). Observed antidiabetic, antioxidant and hypolipidemic activity of the title plant may be attributed to bioactive quercetin. Furthermore, it could also result from synergizing action of a combination of several components interacting with multiple targets of diabetes.
There are clear trends to show that mainstream pharmaceutical research is moving away from single molecule or single target approach, to combinations and multiple target approaches (CitationZimmermann et al., 2007). Multi-target drugs multiply the number of pharmacologically relevant target molecules by introducing indirect, network-dependent effects. These effects tremendously expand the number of potential drug targets, and will introduce novel classes of multi-target drugs with fewer side effects and toxicity (CitationKorcsmaros et al., 2007). In this context, constituents of Dodonaea viscosa are expected to bind/interact with multiple targets in diabetes mellitus, producing a balanced therapeutic outcome.
Conclusion
The major outcome of the present study is therefore to provide a platform in the direction of application of whole extracts or enriched fractions of Dodonaea viscosa, either to supplement the existing oral antidiabetic drugs or reduce the transformation of prediabetics into diabetics.
Acknowledgements
We thank the Head of the Department of Pharmacology, and Principal of Manipal College of Pharmaceutical Sciences, for providing necessary facilities. We also thank the Director of Natural Remedies, Bangalore, for providing facilities to carry out mechanistic studies.
Declaration of interest
We acknowledge financial support from Board of Research and Nuclear Sciences, Department of Atomic Energy, Government of India, grant vide no. 2003/36/27/BRNS/2014 dated 13.02.2004.
References
- Aswal BS, Bhakuni DS, Goel AK, Kar K, Mehrotra BN (1984): Screening of Indian plants for biological activity- Part XI. Ind J Exp Biol 22: 487–504.
- Basciano H, Federico L, Adeli K (2005): Fructose, insulin resistance and metabolic dyslipidemia. Nutr Metab 2: 1–5.
- Berger J, Bailey P (1996): Thiazolidinediones produce conformational changes in peroxisome proliferator activated receptor gamma: Binding and activation correlate with antidiabetic actions in db/db mice. Endocrinology 137: 4189–4195.
- Friedewald WT, Levy RI, Fredrickson DS (1972): Estimation of low-density lipoprotein cholesterol in plasma, without use of the preparative centrifuge. Clin Chem 18: 499–501.
- Gelvan D, Saltman P (1990): Different cellular targets of Cu- and Fe-catalyzed oxidation observed using a Cu-compatible thiobarbiturate acid assay. Biochim Biophys Acta 1035: 353–360.
- Getie M, Gebre-Mariam T, Rietz R, Hohne C, Huschka C, Schmidtke M, Abate A, Neubert RH (2003): Evaluation of the anti-microbial and anti-inflammatory activities of the medicinal plants Dodonaea viscosa, Rumex nervosus and Rumex abyssinicus. Fitoterapia 74: 139–143.
- Ghosh R, Sharatchandra KH, Rita S, Thokchom IS (2004): Hypoglycemic activity of Ficus hispida (bark) in normal and diabetic rats. Ind J Pharmacol 36: 222–225.
- Hevener A, Reichart D, Janez A, Olefsky J (2002): Female rats do not exhibit free fatty acid-induced insulin resistance. Diabetes 51: 1907–1912.
- Ji-Hu Z, Chung TDY, Oldenburg KR (1999): A simple statistical parameter for use in evaluation and validation of high throughput screening assays. J Biomol Screen 4: 67–73.
- Joshi SD, Badiger AM, Ashok K, Veerapur VP, Shastry CS (2003): Wound healing activity of Dodonaea viscosa leaves. Ind Drugs 40: 549–552.
- Kirtikar KR, Basu BD (1993): Indian Medicinal Plants, second edition. Vol. I. Dehradun, India, International Book Publisher.
- Korcsmaros T, Szalay MS, Böde C, Kovács IA, Csermely P (2007): How to design multi-target drugs: Target search options in cellular networks. Expert Opinion Drug Discov 2: 1–10.
- Laville M, Auboeuf D, Khalfallah Y, Vega N, Riou JP, Vidal H (1996): Acute regulation by insulin of phosphatidylinositol-3-kinase, Rad, GLUT 4, and lipoprotein lipase mRNA levels in human muscle. J Clin Invest 98: 43–49.
- Lowry OH, Rosenhrough NJ, Farr AL, Randall RJ (1951): Protein measurement with the Folin phenol reagent. J Biol Chem 193: 265–275.
- Mahesh T, Venugopal PM (2004): Quercetin alleviates oxidative stress in streptozotocin-induced diabetic rats. Phytother Res 18: 123–127.
- Markham KR (1982): Techniques of Flavonoid Identification. London, Academic Press.
- Perry LM, Metzger J (1980): Medicinal Plants of East Southeast Asia. Cambridge, MA and London, MIT Press.
- Petersen KF, Krssak M, Inzucchi S, Cline GW, Dufour S, Shulman GI (2000): Mechanism of troglitazone action in type 2 diabetes. Diabetes 49: 827–831.
- Prabhakar KR, Veerapur VP, Parihar KV, Priyadarsini KI, RAO BS, Unnikrishnan MK (2006): Evaluation and optimization of radioprotective activity of Coronopus didymus Linn. in gamma-irradiated mice. Int J Rad Biol 82: 525–536.
- Rajas A, Cruz S, Ponce-Monter H, Mata R (1996): Smooth muscle relaxing compounds from Dodonaea viscosa. Planta Med 62: 154–159.
- Rajasekar P, Kaviarasan S, Anuradha CV (2005): l-Carnitine administration prevents oxidative stress in high fructose-fed insulin resistant rats. Diabetologica Croatica 34: 21–28.
- Shafrir E (2003): Diabetes in animals: Contribution to the understanding of diabetes by study of its etiopathology in animal models, in: Porte D, Sherwin RS, Baron A, ed., Diabetes Mellitus. New York, McGraw-Hill, 231–255.
- Shimizu S, Ugi S, Maegawa H, Egawa K, Nishio Y, Yoshizaki T, Shi K, Nagai Y, Morino K, Nemoto K (2003): Protein-tyrosine phosphatase 1B as new activator for hepatic lipogenesis via sterol regulatory element-binding protein-1 gene expression. J Biol Chem 278: 43095–43101.
- Srinivasan K, Patole PS, Kaul CL, Ramarao P (2004): Reversal of glucose intolerance by pioglitazone in high-fat diet fed rats. Methods Find Exp Clin Pharmacol 26: 327–333.
- Srinivasan K, Viswanad B, Asrat L, Kaul CL, Ramarao P (2005): Combination of high-fat diet-fed and low-dose streptozotocin-treated rat: A model for type 2 diabetes and pharmacological screening. Pharmacol Res 52: 313–320.
- Taylor SI (1999): Deconstructing type 2 diabetes. Cell 97: 9–12.
- Veerapur VP, Badiger AM, Joshi SD, Nayak VP, Shastry CS (2004): Antiulcerogenic activity of various extracts of Dodonaea viscosa (L) Jacq. Leaves. Ind J Pharm Sci 66: 407–411.
- Veerapur VP, Prabhakar KR, Parihar VK, Bansal P, Kandadi MR, Srinivasan KK, Priyadarsini KI, Unnikrishnan MK (2009): Antidiabetic, hypolipidaemic and antioxidant activity of Dodonaea viscosa aerial parts in streptozotocin-induced diabetic rats. J Herb Pharmacother, in press.
- Vessal M, Hemmati M, Vasei M (2003): Antidiabetic effects of quercetin in streptozocin-induced diabetic rats. Comp Biochem Physiol C Toxicol Pharmacol 135C: 357–364.
- Zang ZY, Lee SY (2003): PTP-1B inhibitors as potential therapeutics in treatment of type 2 diabetes. Exp Opin Investig Drugs 12: 223–233.
- Zimmermann GR, Lehár J, Keith CT (2007): Multi-target therapeutics: When the whole is greater than the sum of the parts. Drug Discov Today 12: 34–42.

