Abstract
Context: Coptidis Rhizoma–Euodiae Fructus couple (CEC) is a classic traditional Chinese medicine preparation consisting of Coptidis Rhizoma and Euodiae Fructus at the ratio of 6:1, and used to treat gastro-intestinal disorders. Alkaloids are the main bioactive component. This research provides comprehensive analysis information for the quality control of CEC.
Objective: To develop a high-performance liquid chromatography–diode array detection fingerprint for chemical composition characteristics of CEC and its products.
Materials and methods: The samples were separated with a Gemini C18 column by using gradient elution with water–formic acid (100:0.03) and acetonitrile as mobile phase. Flow rate was 1.0 mL/min and detection wavelength was 250 nm. Similarity analysis and principal component analysis (PCA) were employed to evaluate quality consistencies of analytes. Mean chromatograms and correlation coefficients of analytes were calculated by the software “Similarity Evaluation System for Chromatographic Fingerprint of Traditional Chinese Medicine”.
Results: Fingerprint chromatogram comparison determined 20 representative general fingerprint peaks, and the fingerprint chromatogram resemblances are all better than 0.988. Consistent results were obtained to show that CEC and its related samples could be successfully divided into three groups. Contribution plots generated by PCA were performed to interpret differences among the sample groups while peaks which significantly contributed to classification were identified. Seven bioactive constituents in the samples were verified by quantitative analysis.
Discussion and conclusion: The chromatographic fingerprint with similarity evaluation and PCA assay combined with quantification of seven compounds could be utilized as a quality control method for the herbal couple.
Introduction
Chinese medicines and their derivative products are widely used as therapeutic products in many countries. Most Chinese medicine formulae comprise a complex mixture of different herbs, each of which may consist of hundreds of chemical components. Consequently, it is necessary to define all of the active chemical constituents of Chinese medicine extracts to guarantee safety, reliability, and repeatability for clinical efficacy and pharmacological studies. This provides improved understanding of bioactivities and possible adverse effects of active compounds, and to enhance product quality control (He, Citation2000). However, it is unlikely that identification of all these compounds is possible. In recent decades, chromatographic fingerprints are accepted by the WHO for the quality evaluation of Chinese medicines. This technique emphasizes the systematic characterization of compositions of samples and focuses on the identification and assessment of the stability of the components in complex systems (Drasar et al., Citation2004; Liu et al., Citation2007; World Health Organization, Citation2007). This may not be sufficient to control the overall quality of herbal preparations because of the lack of quantitative information of active compounds (Li et al., Citation2010). For this reason, it would be better to determine the main bioactive constituents simultaneously, and the use of high-performance liquid chromatography (HPLC) fingerprinting is particularly advised (Lu et al., Citation2009). Some combinative methods using HPLC fingerprints and quantitative determination of bioactives have been proposed and were applied to evaluate quality of herbal preparation (Tang et al., Citation2010; Wei et al., Citation2010; Xu et al., Citation2009). The HPLC–ultraviolet (UV) diode array detection (DAD) technique takes advantage of chromatography as a separation method, and DAD as an identification method for characterization of each individual peak in a chromatogram. In most cases, these peaks can be tentatively identified directly (on-line) by comparison with literature data or with standard compounds. Meanwhile, HPLC coupled with DAD is a common instrument in many analytical laboratories and is highly suited for routine analysis. Over the past few decades, HPLC chromatographic fingerprints have been widely employed for quality evaluation of traditional Chinese medicine (TCM) (Wang et al., Citation2009; Xie et al., Citation2006; Yu et al., Citation2007; Zhang et al., Citation2008).
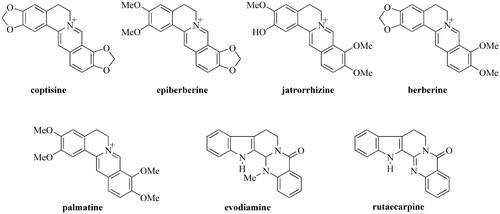
The rhizomes of Coptis chinensis Franch. (Ranunculaceae, Coptidis Rhizoma) and the nearly ripe fruits of Euodia rutaecarpa (Juss.) Benth. (Rutaceae, Euodiae Fructus), is one of the classical Chinese herbal medicine combinations, and has been clinically used for treating gastro-intestinal disorders such as gastric ulcer, gastro-esophageal reflux disease, gastritis, pyloric obstruction, etc. (Xiang et al., Citation2004). These two medicines are often used together, as the so called “Coptidis Rhizoma–Euodiae Fructus couple” (CEC). The Zuojin formula is a classic TCM preparation (TCMP) consisting of CEC powder (Coptidis Rhizoma and Euodiae Fructus at the ratio of 6:1, w/w). Currently, multiple products of the related Zuojin formula are available in the pharmaceutical market, namely Zuojin Pill (ZJP), Zuojin Capsule (ZJC), and Zuojin Tablet (ZJT), which are made by independent manufacturers using raw herbs from different areas or combined raw herbs with extracts. These TCMPs are all mainly used to treat gastro-intestinal disorders. Coptidis Rhizoma and Euodiae Fructus are widely used in China, Japan, Korea, Australia, and Thailand, etc. The composition of compounds in Coptidis Rhizoma and Euodiae Fructus varies significantly with the geographic location, climate conditions, cultivation conditions, harvest times, storage, pretreatment, and other factors. Due to the existence of such differences, thus, quality consistency of CEC and derived TCMPs may also be affected, and can vary greatly. The establishment of good quality control methods is of urgent importance for medical applications. Generally, the therapeutic effects of Chinese medicine preparations are integrative results of multiple bioactive compounds (Wei et al., Citation2007). The protoberberine alkaloids, such as berberine, palmatine, jatrorrhizine, and epiberberine are found in Coptidis Rhizoma, and indolequinazoline alkaloids, such as evodiamine and rutaecarpine are found in Euodiae Fructus (structures are shown in ) and are considered to be biologically active based on pharmacological studies (Kong et al., Citation2009b; Yan et al., Citation2007; Yang et al., Citation2009; Yarosh et al., Citation2006; Yu et al., Citation2000). However, in the Pharmacopoeia of the People’s Republic of China (Chinese Pharmacopoeia Commission, Citation2010), berberine is monitored as the signal marker for quality control of Zuojin-related products. Thin-layer chromatography (Shen et al., Citation1993), capillary electrophoresis (Lee et al., Citation1997; Wang et al., Citation2006), HPLC DAD (Chu et al., Citation1996), LC–MS (Luo et al., Citation2005), and UPLC–TUV (Gao et al., Citation2010) were established for analysis of isoquinoline and indolequinazoline alkaloids in this formula for quality control. To date, although, there are a few studies on the determination of alkaloids of the herb couple by HPLC–UV (Chu et al., Citation1996; Luo et al., Citation2005), no general fingerprint information is available. Therefore, the objective of this research is to establish a HPLC DAD method both for fingerprinting analysis to verify the quality consistency of CEC and its related TCMPs, and for simultaneous determination of seven major bioactive compounds for providing comprehensive analysis information.
Figure 1. The chemical structures of investigated compounds.
Materials and methods
Materials, chemicals, and reagents
Acetonitrile (MeCN) and methanol (MeOH) were of HPLC grade from Merck KGaA (Darmstadt, Germany). Milli-Q water (H2O) was produced by a Milli-Q system (Merck Millipore, Billerica, MA). Formic acid (HCOOH), aqueous ammonia solution (28%, analytical grade), and ethanol (EtOH, analytical grade) were from Ajax Finechem Pty Ltd (Taren Point, Australia). Reference standards of coptisine, epiberberine, berberine, palmatine, and jatrorrhizine were isolated and purified from the Coptidis Rhizoma as described in a previous article (Ma et al., Citation2009), and evodiamine and rutaecarpine were isolated and purified from the Euodiae Fructus as described in a previous article (Yang & Teng, Citation2007) in our research group. Their purities were >99% as assayed by HPLC and their chemical structures were identified by UV, mass and nuclear magnetic resonance spectra. Two batches of ZJP (Batch Nos 081001 and 090501) were purchased from Hubei Nuodesheng Pharmaceutical Co., Ltd. (Xiantao, China). ZJC (Batch No. 20071101) was purchased from Wenzhou Haihe Pharmaceutical Co., Ltd. (Wenzhou, China), and ZJT (Batch No. 080728) was purchased from Jiangsu Chenpai Pharmaceutical Co., Ltd. (Haimen, China). Two batches of commercial Coptidis Rhizoma were purchased from Winner Trading Pty Ltd. (C1, C2; Melbourne, Australia), while one batch of Coptidis Rhizoma (C3) was collected from China National “good agriculture practice base of C. chinensis Franch”. (Zhongqing, China). Two different batches of Euodiae Fructus were purchased from Winner Trading Pty Ltd. (E1, E2; Melbourne, Australia).
Instrument and analytical conditions
Analysis was performed using an Agilent Series 1100 HPLC System consisting of a quaternary delivery system, an auto-sampler and a DAD. Chromatographic analyses was carried out on a Gemini C18 column (250 × 4.6 mm, 5 µm particle diameter; Phenomenex, Lane Cove, Australia) and the column temperature was maintained at 40 °C. Final selection of the Gemini column followed a prior comparative study of different column types. The mobile phase comprised H2O containing 0.3% HCOOH (pH 10, adjusted by aqueous ammonia) (A) and MeCN (B) with a relatively complex gradient to provide best component separation mode as follows: 0–3 min, 5–9% B; 3–8 min, 9–25% B; 8–14 min, 25–30% B, held this setting for additional 4 min (i.e., 14–18 min); then 18–26 min, 30–60% B; 26–35 min, 60–71% B; 35–39 min, 71–83% B; 39–43 min, 83–90% B, held this setting for additional 12 min (i.e., 43–55 min). Flow rate and detection wavelength were set at 1.0 mL/min and 250 nm, respectively. The sample injection volume was 10 µL.
Preparation of samples and negative control samples
An accelerated solvent extraction (ASE) 100 System (Dionex, Sunnyvale, CA) with 11 mL stainless steel ASE vessels was used for pressurized liquid extraction (Gao et al., Citation2010). Coptidis Rhizoma, Euodiae Fructus and their products were ground into powders with a particle size 40–60 mesh before use. About 0.42 g of the powder (for CEC containing 0.36 g Coptidis Rhizoma and 0.06 g Euodiae Fructus powders) was accurately weighed and homogenized with 2.8 g hydromatrix then placed in an extraction cell. Extraction cells were uploaded to the carousel and the samples were extracted under the following conditions: 80% EtOH as extract solvent, 1500 psi as extract pressure, at 130 °C extracted 15 min with two cycles. The extract was then diluted to 50 mL with 80% EtOH, and was filtered through a 0.45 μm nylon filter membrane prior to HPLC analysis. Coptidis Rhizoma (0.36 g) and Euodiae Fructus (0.06 g) were prepared using the same sample preparation protocol, respectively, as negative control (NC) samples.
Calibration curves, precision, stability, and recovery
Standards of the alkaloids coptisine, epiberberine, berberine, palmatine, jatrorrhizine, evodiamine, and rutaecarpine were accurately weighed, dissolved in MeOH and made up to 10 mL in a volumetric flask as a stock solution to final concentrations of 0.5, 0.5, 0.5, 0.7, 1.5, 0.2, and 0.3 mg/mL, respectively. The stock solution was diluted with MeOH to appropriate concentration ranges to establish calibration curves by plotting the analytes’ peak area against concentration and evaluated using the least-squares method. Instrument precision was evaluated by carrying out intra- and inter-day assays. Intra-day precision was validated with three concentrations of mixed standard solutions under the optimized conditions five times in one day. Inter-day precision was validated with the same mixed standard solutions used above once a day, on five consecutive days.
Six independent sample solutions of CEC (Sample No. S9) were prepared in parallel and analyzed for evaluation of repeatability, by evaluating the relative standard deviation (RSD) of peak areas for the above-mentioned seven alkaloids. A stability test was performed by analyzing Sample No. S9 over intervals of 0, 24, and 48 h. For the recovery test, the authentic standards were added to 0.21 g of S9, and the resulting composite mixture was extracted and analyzed.
Establishment of fingerprint chromatograms and data analysis
Ten batches of samples (marked as S1–S10) prepared as described above were analyzed under the selected chromatographic conditions to establish HPLC fingerprint chromatograms. The software “Similarity Evaluation System for Chromatographic Fingerprint of TCM”, published by the Chinese Pharmacopoeia Commission (Version 2004A, Beijing, China), was used to analyze the similarity of chromatographic and spectral patterns; the Mean Chromatographic Fingerprint could be generated by this software which was recommended by SFDA (State Food and Drug Administration, Beijing, China) (Liang et al., Citation2004). Principal component analysis (PCA) was also used to weight parameters to evaluate the fingerprint chromatogram, to assist users to understand causes and effects behind the relationships of multivariate dataset through generating a projection map and the principal component scores (Kannel et al., Citation2007). PCA was performed by EZinfo version 2.0 (Waters, Milford, MA). The contents of seven main analytes in 10 batches of ZJP samples were simultaneously determined from the corresponding calibration curves.
Results and discussion
Optimization of HPLC conditions
Optimization of parameters in HPLC was achieved through investigating the influence of the chromatographic column, mobile phase and elution mode, and detection wavelength. Diamonsil C18 (200 × 4.6 mm, 5 µm; Dikma Technologies, Beijing, China), Kromasil C18 (250 × 4.6 mm, 5 µm; Dalian Institute of Chemical Physics, Dalian, China), and Gemini C18 columns were initially investigated. There was no significant difference in the number of peaks each column generated; however, the Gemini C18 column was chosen because it gave more efficient, narrow peaks under the same conditions, and so better resolution. Various mobile phases including MeCN–H2O and MeOH–H2O with addition of various modifiers containing acetic acid–acetate buffer, HCOOH, and HCOOH–ammonia of different pH values were investigated under different gradient elution modes, as shown in . The duration of analysis of systems with the MeCN–HCOOH–aqueous ammonia solution system was relatively shorter, with more peaks, and better resolution was observed. showed six major (Peaks 6, 7, 8, 9, 10 and 11) which were obtained from the MeCN–HCOOH–aqueous ammonia solution system; whereas, no more than five peaks were present from other systems tested. Thus MeCN and H2O system with HCOOH–ammonia was chosen. Different compositions of HCOOH and various pH values (0.1, 0.3, and 0.5% HCOOH adjusted with ammonia to pH 4, 7 and 10) were investigated for further optimal resolution. The results indicated that more peaks could be obtained at higher pH value; especially for Peaks 8 and 9 baseline separation was achieved. The tailing of Peak 11 could be improved through adding higher concentration of HCOOH. As a result, 0.3 and 0.5% HCOOH both contributed to reduce tailing, so the lower concentration of 0.3% HCOOH was chosen. By analyzing the 3D-plot chromatograms acquired from the HPLC–DAD system, 250 nm was selected as the preferred detection wavelength because the largest numbers of peaks with best overall responses were observed using this wavelength. presents the representative HPLC fingerprint profile under the optimized conditions (using conditions slightly adjusted from those shown in to give slightly faster elution for later compounds).
Figure 2. Chromatograms of the sample (S9) under different mobile phase compositions and gradients. (a) System I: H2O (50 mM NaOAc-0.25% HOAc, pH 5.09) (A)–MeCN (B): 0–120 min 0–90% B. (b) System II: H2O (0.1% HCOOH) (A)–MeCN (0.1% HCOOH) (B): 0–15 min, 11–13% B; 15–70 min, 15% B; 70–80 min, 50% B; 80–120 min, 50–100% B. (c) System III: H2O (0.1% HCOOH) (A)–MeOH (B): 0–5 min, 5–8% B; 5–10 min, 8–15% B; 10–35 min, 15–20% B; 35–55 min, 20–30% B; 55–65 min, 30–50% B; 65–80 min, 50–95% B. (d) System IV: H2O (0.1% HCOOH) (A)–MeCN (B): 0–15 min, 13% B; 15–25 min, 13–28% B; 25–30 min, 28–40% B; 40–65 min, 50–65% B; 55–60 min, 65–80% B. (e) System V: H2O (0.1% HCOOH, adjusted to pH 4.0 by ammonia) (A)–MeOH (B): 0–13 min, 5–25% B; 15–25 min, 25–23% B; 23–38 min, 23–38% B; 38–48 min, 38–65% B; 48–70 min, 65–90% B. (f) System VII: H2O (0.3% HCOOH, adjusted to pH 9.9 by ammonia) (A)–MeCN (B): 0–7 min, 5–10% B; 7–12 min, 10–26% B; 12–28 min, 26–31% B; 28–34 min, 31–50% B; 34–40 min, 31–50% B; 40–55 min, 45–65% B; 55–60 min, 65–75% B; 60–70 min, 75–90% B.
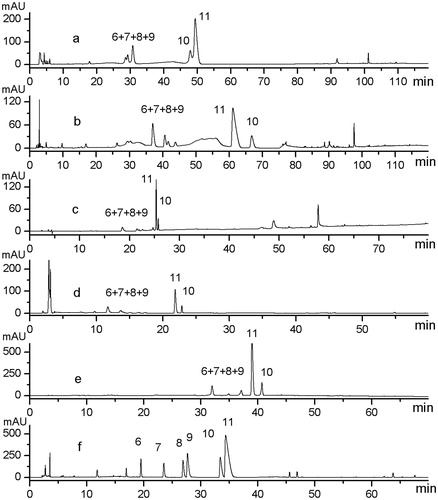
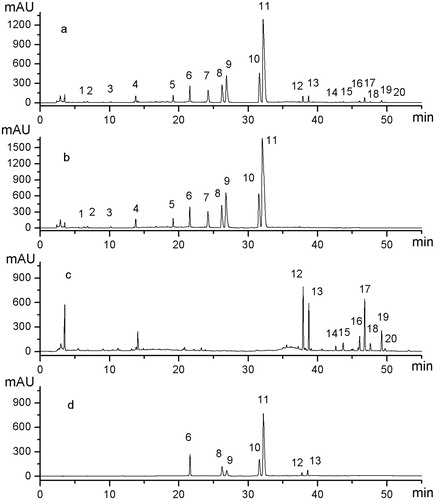
Figure 3. Comparison of representative HPLC fingerprint profiles of mixed standards and the extract of sample and single herb samples under optimized conditions. (a) Extract of Sample S9 (C2–E2), (b) Extract of NC sample (C2), (c) Extract of NC sample (E2), and (d) Mixed standards of the seven chemical constituents. Among 20 representative general peaks, Peaks 1–11 originated from Coptidis Rhizoma, and Peaks 12–20 originated from the Euodiae Fructus. Peaks 6, 8, 9, 10, 11, 12, and 13 are jatrorrhizine, epiberberine, coptisine, palmatine, berberine, evodiamine, and rutaecarpine, respectively.
Method validation for quantitative determination of the seven marker compounds
Calibration curves were plotted by analyzing a series of concentrations of standard solutions. The regression equations were calculated in the form of y = ax + b, where x and y are the concentration of the standard solution (mg/L) and the corresponding peak area, and a and b are the slope and the intercept, respectively. Good calibration curves of coptisine, epiberberine, jatrorrhizine, berberine, palmatine, evodiamine, and rutaecarpine were obtained. Detailed information regarding calibration curves and linear ranges, are listed in . Inter- and intra-day precisions for all investigated components expressed as RSD were between 0.1 and 2.2%. Six independent sample solutions of the CEC (Sample No. S9) were prepared in parallel and analyzed for evaluation of repeatability. RSD of peak areas for the seven compounds was between 1.3 and 3.4%. Stability of prepared samples were analyzed in triplicate at 0, 24, and 48 h. RSD values were not more than 3.8% for all components. Average recoveries of investigated targets ranged from 96.5 to 101.0%, and RSD values were all <3.4%, as shown in . It was clear that the developed method was sufficiently reliable and accurate for the measurement.
Table 1. Calibration curves, detection limits, precision, reproducibility, and stability of alkaloids determined by the HPLC method (n = 6).
HPLC DAD fingerprint analysis
In the fingerprint analysis of herbal medicines, the metric of similarity is usually used as a criterion of quality assessment. The similarity between a test sample and the standard fingerprint was evaluated by calculating the correlation coefficient. In this study, the simulated mean chromatogram as a representative standard fingerprint for a group of chromatograms of these 10 samples was calculated and generated automatically by a software package – Similarity Evaluation System for Chromatographic Fingerprint of TCM. The correlation coefficient of similarities between the reference fingerprint and the entire chromatographic profiles of samples was calculated. The standardized fingerprint developed is presented in . The correlation coefficients between each chromatogram of these 10 samples and the simulated mean chromatogram (denoted r) are 0.988, 0.99, 0.993, 0.993, 0.995, 0.995, 0.995, 0.995, 0.996, and 0.995, respectively. These results indicated that the samples shared different correlation coefficients of similarities, showing the internal quality of these samples were different. The correlation coefficients of the samples from the same manufacture were similar, such as S3 and S4, illustrating that the entire chromatograms of these samples were generally consistent and stable. S1 and S2 are tablet and capsule preparations, respectively, with lower similarity due their being produced by a different procedure.
Figure 4. Fingerprint chromatograms of 10 batches of ZJP samples which consisted of herbal drugs collected from different places and production methods. Sample Nos S1–S10 are ZJ tablet (Batch No. 20071101), ZJ capsule (Batch No. 080728), ZJ Pill (Batch No. 081001, No. 090501), C1E1, C2E1, C3E1, C1E2, C2E2, C3E2, respectively; R (representative standard fingerprint/mean fingerprint generated by Similarity Evaluation System for Chromatographic Fingerprint of TCM).
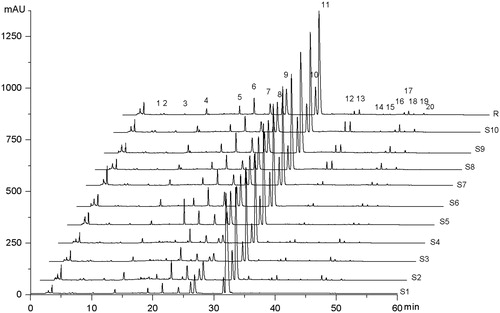
In addition, peaks that existed in all samples with reasonable heights and good resolution are assigned as “common peaks” for identification of the extract. In our research, among all the peaks observed, 20 common peaks, which showed up in all samples were determined for fingerprint parameters evaluation based on chromatographic trajectory, resolution, intensity, and stability of fingerprint peaks were labeled, as shown in . Peak purity was identified by comparison of retention time and on-line UV spectra.
To assign which herb each compound originated from, a comparative study was conducted by using the individual extracts of two herbs, i.e., Coptidis Rhizoma and Euodiae Fructus as showed in . The drug origin of general peaks was identified as peaks 1–11 originated from the Coptidis Rhizoma, and peaks 12–20 originated from Euodiae Fructus. Furthermore, Peaks 6, 8, 9, 10, 11, 12, and 13 were identified as jatrorrhizine, epiberberine, coptisine, palmatine, berberine, evodiamine, and rutaecarpine, respectively, by comparing with the UV spectra and retention time of sample peaks to the corresponding chemical references under the same condition. Peak 11 (berberine), which is one of the greatest response and important active constituents (Jang et al., Citation2009; Jung et al., Citation2008; Yan et al., Citation2008) in these samples, was chosen to calculate the relative retention time (RRT) and relative peak area (RPA). RRT and RPA of characteristic peaks in 10 samples are shown in . Recovery data are given in .
Table 2. RRT and RPA of characteristic peaks in 10 samples (relative data versus berberine).
Table 3. Recovery data by standard addition method (n = 3).
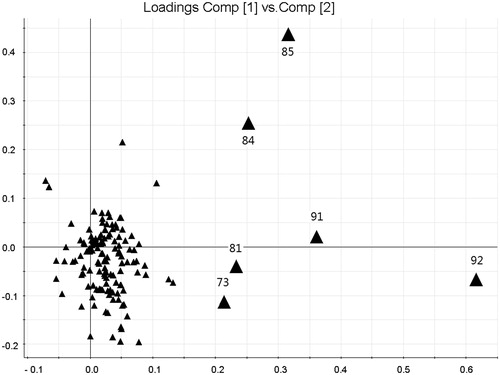
PCA (Kannel et al., Citation2007) is widely used for reducing the dimensions of multivariate problems. It reduces the dimensionality of the original dataset by explaining the correlation among a large number of variables in terms of a smaller number of underlying factors (principal components, PCs) with minimum loss of information (Kong et al., Citation2009a). In this study, each PC consists of a set of values–scores which define the position of each sample in the new coordinate space, and the other set of values–loadings that give the relative contributions of each variable in calculating the scores. “Scores” provide classification information of the samples, and “loading” helps find the important variables (i.e., main chemical peaks) which have the most influence on the separation among different samples. The results of PCA-based chromatographic fingerprints of all samples are shown in . In the scores plot, samples are mapped in the space spanned by the first two principal components PC1 versus PC2. It showed that the samples could be classified into three groups, marked as Groups I, II, and III according to different preparation and original location of sample. S1 was the signal group in Group 1, and S2 in Group 2 and the other samples were in Group 3. These results were in accordance with the result by similarity analysis. The loadings plot of the scores () indicates that Peaks 92 (berberine), 91 (palmatine), 84 (coptisine), 85 (epiberberine), 81 (unknown), and 73 (jatrorrihzine), may have more influence on the discrimination of samples from different sources than other components.
Figure 5. PCA scores plot of CEC and its related preparation samples from various sources on the first two PCs. Ten samples were clearly divided into three groups. S1 was the signal group in Group 1, and S2 in Group 2, and the other samples were in Group 3. Sample No. S1–S10 are ZJ tablet (Batch No. 20071101), ZJ capsule (Batch No. 080728), ZJ Pill (Batch No. 081001), ZJ Pill (Batch No. 090501), C1E1, C2E1, C3E1, C1E2, C2E2, C3E2; R (reference standard fingerprint generated by Similarity Evaluation System for Chromatographic Fingerprint of TCM).
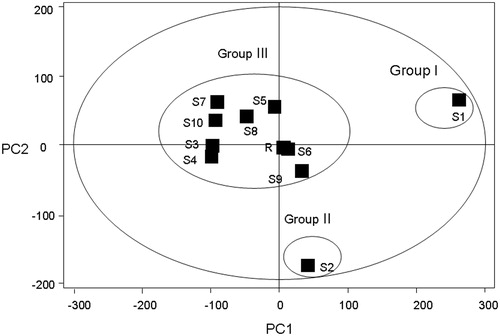
Figure 6. Loadings plot of PCA of CEC and its related preparation samples. Peak 92: berberine, 91: palmatine, 84: coptisine, 85: epiberberine, 81: unknown, and 73: jatrorrihzine.
Determination of seven bioactive constituents
The developed HPLC–UV method was subsequently applied to determine the seven primary bioactive constituents in different 10 samples simultaneously. Each sample was determined in triplicate. Peaks in the chromatograms were identified by comparing the retention times and on-line UV spectra with those of the standards. The HPLC–DAD profiles are illustrated in and the content of the seven alkaloid compounds are summarized for the 10 samples in . It was found that the content of each analyte varied among the different samples. Berberine, which is the main component, and also recognized as a major protoberberine alkaloids, was present in the highest content in all tested samples. The content of berberinein tablet and capsule samples were higher than other samples. A possible explanation of this is that these two products consist of concentrated extracts of raw herbs. The indolequinoline alkaloids evodiamine and rutaecarpine were of lower content, and were relatively variable among the samples. This may be due to diverse Euodiae Fructus sources of the different products, and the disparity in procedures of different preparation methods. It is noteworthy that the variation in content of constituents could certainly lead to the variation of clinical efficacy and safety. Hence, each procedure involved should ideally be standardized.
Table 4. Contents of seven alkaloids (mg/g) in the 10 collected commercial materials of CEC and Zuojin preparations (mean ± SD, n = 3).
Conclusions
This is the first report for the development of fingerprints by a HPLC method, together with similarity analysis and PCA methods, for the quality assessment of CEC and its related Zuojin preparations. Fingerprint profiling has advantages over the conventional method of signal identification of crude herbs. The fingerprint and quantity of 20 characteristic peaks, comprising of seven major bioactive compounds in these samples were determined simultaneously. The more comprehensive quality evaluation was achieved not only qualitatively but also quantitatively in a single injection. Thus, it can be concluded that this newly developed method is very reliable for assessing control of the quality of these medicinal products and have better practical value with lower cost than LC–MS. This method also provides a good reference for HPLC analysis of other related pharmaceutical preparations containing CEC such as retro-ZJP, Xianglian pill, and Wuji pill, which consist of Coptidis Rhizoma and Euodiae Fructus in different ratios.
Declaration of interest
The authors report no declaration of interest. The authors alone are responsible for the content and writing of this article.
Acknowledgements
This research was supported partly by the National Natural Science Foundation of China (81173508), the National Key Technology Research and Development Program of China (2011BAI07B08), and Australian Research Council’s Linkage Infrastructure, Equipment and Facilities Funding Scheme (LE0775725). We are also grateful to the China Scholarship Council for a postgraduate scholarship (to X.G.). We would like to express heartfelt thanks to Mr. Paul Morrison for technical assistance.
References
- Chinese Pharmacopoeia Commission. (2010). Pharmacopoeia of the People's Republic of China, vol. 1. Beijing, China: China Medical–Pharmaceutical Science & Technology Publishing House, 630–1
- Chu CY, Sheu SJ. (1996). Liquid chromatographic separation of the alkaloids in coptis-evodia herb couple. J Chromatogr A 756:137–44
- Drasar P, Moravcova J. (2004). Recent advances in analysis of Chinese medical plants and traditional medicines. J Chromatogr B 812:3–21
- Gao X, Yang XW, Marriott PJ. (2010). Simultaneous analysis of seven alkaloids in Coptis-Evodia herb couple and Zuojin pill by UPLC with accelerated solvent extraction. J Sep Sci 33:2714–22
- He XG. (2000). On-line identification of phytochemical constituents in botanical extracts by combined high-performance liquid chromatographic-diode array detection-mass spectrometric techniques. J Chromatogr A 880:203–32
- Jang MH, Kim HY, Kang KS, et al. (2009). Hydroxyl radical scavenging activities of isoquinoline alkaloids isolated from Coptis chinensis. Arch Pharm Res 32:341–5
- Jung HA, Yoon NY, Bae HJ, et al. (2008). Inhibitory activities of the alkaloids from Coptidis Rhizoma against aldose reductase. Arch Pharm Res 31:1405–12
- Kannel PR, Lee S, Kanel SR, Khan SP. (2007). Chemometric application in classification and assessment of monitoring locations of an urban river system. Anal Chim Acta 582:390–9
- Kong WJ, Zhao YL, Xiao XH, et al. (2009a). Quantitative and chemical fingerprint analysis for quality control of Rhizoma Coptidis chinensis based on UPLC-PAD combined with chemometrics methods. Phytomedicine 16:950–9
- Kong WJ, Zhao YL, Xiao XH, et al. (2009b). Comparison of anti-bacterial activity of four kinds of alkaloids in Rhizoma Coptidis based on microcalorimetry. Chin J Chem 27:1186–90
- Lee MC, Sheu SJ. (1997). Determination of the alkaloids in coptis-evodia herb couple by capillary electrophoresis. J Liquid Chromatogr Related Technol 20:63–78
- Li Y, Wu T, Zhu JH, et al. (2010). Combinative method using HPLC fingerprint and quantitative analysis for quality consistency evaluation of an herbal medicinal preparation produced by different manufacturers. J Pharm Biomed Anal 52:597–602
- Liang YZ, Xie PS, Chan K. (2004). Quality control of herbal medicines. J Chromatogr B 812:53–70
- Liu AH, Lin YH, Yang M, et al. (2007). Development of the fingerprints for the quality of the roots of Salvia miltiorrhiza and its related preparations by HPLC-DAD and LC-MSn. J Chromatogr B 846:32–41
- Lu Y, Chen DF. (2009). Analysis of Schisandra chinensis and Schisandra sphenanthera. J Chromatogr A 1216:1980–90
- Luo XB, Chen B, Yao SZ. (2005). Simultaneous analysis of protoberberine, indolequinoline and quinolone alkaloids in coptis-evodia herb couple and the Chinese herbal preparations by high-performance liquid chromatography-electrospray mass spectrometry. Talanta 66:103–10
- Ma ZT, Yang XW, Zhong GY. (2009). A new flavonoid glucoside from Huanglianjiedutang decoction. China J Chin Mater Med 34:1097–100
- Shen ZF, Xie MZ. (1993). Determination of berberine in biological specimen by high performance TLC and fluoro-densitometric method. Acta Pharm Sin 28:532–6
- Tang DQ, Yang DZ, Tang AB, et al. (2010). Simultaneous chemical fingerprint and quantitative analysis of Ginkgo biloba extract by HPLC-DAD. Anal Bioanal Chem 396:3087–95
- Wang JM, Luan LJ, Cheng YY. (2006). Simultaneous determination of five alkaloids in the mixture of Rhizoma Coptis and Fructus Evodiae by MEKC. Chin J Pharm Anal 26:325–8
- Wang B, Zhang YB, Li GQ, et al. (2009). Fingerprint chromatogram analysis of Radix Glehniae by LC coupled with hierarchical clustering analysis. Chromatographia 70:811–16
- Wei YH, Qi LW, Li P, et al. (2007). Improved quality control method for Fufang Danshen preparations through simultaneous determination of phenolic acids, saponins and diterpenoid quinones by HPLC coupled with diode array and evaporative light scattering detectors. J Pharm Biomed Anal 45:775–84
- Wei H, Sun LN, Tai ZG, et al. (2010). A simple and sensitive HPLC method for the simultaneous determination of eight bioactive components and fingerprint analysis of Schisandra sphenanthera. Anal Chim Acta 662:97–104
- World Health Organization. (2007). WHO Guidelines for Assessing Quality of Herbal Medicines with Reference to Contaminants and Residues. Geneva, Switzerland: WHO Press
- Xiang JL, Lui Y, Bai QY, Xu Y. (2004). Research advances in pharmacological action and clinical application of Zuojin Pill. Inform Tradit Chin Med 21:45–7
- Xie GX, Qiu MF, Zhao AH, Jia W. (2006). Fingerprint analysis of Flos Carthami by pressurized CEC and LC. Chromatographia 64:739–43
- Xu LN, Han X, Qi Y, et al. (2009). Multiple compounds determination and fingerprint analysis of Lidanpaishi tablet and keli by high-performance liquid chromatography. Anal Chim Acta 633:136–48
- Yan D, Jin C, Xiao XH, Dong XP. (2007). Investigation of the effect of berberines alkaloids in Coptis chinensis Franch. on Bacillus shigae growth by microcalorimetry. Sci China Ser B-Chem 50:638–42
- Yan D, Jin C, Xiao XH, Dong XP. (2008). Antimicrobial properties of berberines alkaloids in Coptis chinensis Franch. by micro calorimetry. J Biochem Biophy Methods 70:845–9
- Yang XW, Teng J. (2007). Chemical constituents of the unripe fruits of Evodia rutaecarpa. J Chin Pharm Sci 16:20–3
- Yang XW, Teng J, Xu W, et al. (2009). The permeability and the efflux of alkaloids of the Evodiae Fructus in the Caco-2 model. Phytother Res 23:56–60
- Yarosh DB, Galvin JW, Nay SL, et al. (2006). Anti-inflammatory activity in skin by biomimetic of Evodia rutaecarpa extract from traditional Chinese medicine. J Dermatol Sci 42:13–21
- Yu LL, Liao JF, Chen CF. (2000). Anti-diarrheal effect of water extract of Evodiae Fructus in mice. J Ethnopharmacol 73:39–45
- Yu RM, Ye B, Yan CY, et al. (2007). Fingerprint analysis of fruiting bodies of cultured Cordyceps militaris by high-performance liquid chromatography-photodiode array detection. J Pharm Biomed Anal 44:818–23
- Zhang SJ, Ouyang F, Wang CH, Gu M. (2008). Fingerprint of tablet of Corydalis tuber for alleviating pain by HPLC. J Liquid Chromatogr Related Technol 31:452–64