Abstract
Context: Equol is a polyphenolic/isoflavonoid molecule that can be expressed as isomers. However, the characteristics of the equol isomers on dermal gene/protein expression and human skin percutaneous absorption remain unknown.
Objective: Perform a comprehensive investigation on equol as: R-equol, racemic equol or S-equol to determine their differential expression of skin-related genes, quantify collagen expression and determine percutaneous absorption in human skin.
Methods: Quantified: (i) gene expression/mRNA levels via gene array technology using human skin equivalents with equol exposure at 1.2% in qPCR experiments, (ii) in vitro collagen expression in human fibroblasts, and (iii) percutaneous absorption by Franz cell techniques.
Results: In the qPCR studies, only three genes displayed the greatest significant expression by S-equol, whereas 16 genes displayed the greatest significant levels (either stimulation or inhibition) by R-equol and/or racemic equol, such as extracellular matrix proteins (i.e., collagen and elastin), nerve growth factor, aging genes [FOS, 100 A8 and A9 calcium-binding proteins, 5α-reductase type 1, and matrix metalloproteinases (1, 3, and 9)], and inflammatory genes (e.g., interleukin-1 alpha, interleukin-6, and cyclooxygenase-1). Collagen type I expression in fibroblasts was greater with racemic versus S-equol treatment at 1 and 10 nM. Percutaneous absorption demonstrated high sequestering in keratinocytes with subsequent accumulation/release over time.
Discussion and conclusion: Overall, these results illustrate the significant differences in mirror-image molecules or isomers of equol where R-equol and/or racemic equol are better molecules for skin gene expression compared to S-equol and the percutaneous absorption of equol represents a unique epidermal reservoir delivery mechanism.
Introduction
Equol belongs to the group or category of polyphenolic/isoflavonoid compounds that appear to have a wide spectrum of benefits in human health (Lephart, Citation2013a,Citationb; Setchell & Clerici, 2011). For instance, it is well established in human populations ∼20–30% of individuals can produce equol at relatively low concentrations compared to animals (Frankenfeld, Citation2011; Lephart, Citation2013a; Setchell & Clerici, 2011) and recent evidence indicates that equol is present in plant products such as beans, cabbage, and lettuce (Hounsome et al., Citation2009, Citation2010). Further research has revealed that equol concentrations in low-soy consuming US populations reflect equol intakes from mammalian (cow) milk sources (Frankenfeld, Citation2011; Hoikkala et al., Citation2007; Mustonen et al., Citation2009) that can be as high as 1.5 mg/kg in cow’s milk (Höjer et al., Citation2012). Notably, the metabolism of R- and S-equol in humans appears to be similar (Setchell et al., Citation2005, Citation2009). Therefore, humans are exposed to this polyphenolic compound from different plant and food sources regardless of age, gender, or geographical location with scientific data to support a consumption/exposure record that appears to be safe (Frankenfeld, Citation2011; Lephart, Citation2013a). Finally, equol research has dramatically increased within the past decade (Setchell & Clerici, 2011) and this polyphenolic molecule along with other botanical compounds have wide use in personal care products such as skin protectants, whitening, anti-wrinkle, and anti-aging ingredients (Baumann, Citation2009; Gopaul et al., Citation2012).
Gopaul et al. (Citation2012) reported that equol has the unique characteristics to bind specifically 5α-dihydrotestosterone (5α-DHT) to decrease this negative androgen impact in skin. Equol also has affinity for estrogen receptor-β (ERβ) to increase the positive estrogen-like influences in skin (Gopaul et al., Citation2012) and can be found as R- and S-configuration or isomers (Lephart, Citation2013a; Setchell & Clerici, Citation2010; Setchell et al., Citation2005). Equol is currently used in skin treatments and positive influences on gene and protein expression (anti-aging, antioxidant, and anti-inflammatory properties) have been reported (Gopaul et al., Citation2012). Recently, it has been proposed that ERβ agonists like S-equol may have better beneficial dermal applications (Jackson et al., Citation2011); however, this proposition remains to be clarified. Moreover, equol, due to its novel characteristics, apparently has other health care applications associated with aging such as improved prostate function and potentially as a scalp hair retention/growth treatment (Lephart, Citation2013b; Lund et al., Citation2011).
Based upon the aforementioned data, the purpose of this study was to: (i) perform a comprehensive investigation on equol as R-equol, racemic equol, or S-equol to quantify their differential expression of skin-related genes to establish topical strategies that favor antioxidant, anti-aging, and skin regeneration, (ii) confirm the gene array results in the differential expression of collagen type I in human monolayer fibroblasts in vitro between racemic equol and S-equol at different doses, and (iii) determine the percutaneous absorption of racemic equol into human skin using Franz cell techniques.
Materials and methods
Chemicals and epidermal full thickness (human skin equivalents)
All chemicals [dimethyl sulfoxide (DMSO) American Chemical Society reagent grade ≥99.9%, tissue culture medium, and reagents, etc.] were purchased from Sigma Chemical Co. (St. Louis, MO). Racemic equol was purchased from LC Laboratories (Woburn, MA) and R- and S-equol were purchased from R. Handa, Colorado State University (Fort Collins, CO).
Epidermal full-thickness human skin cultures
Epidermal full-thickness (EFT) human skin cultures from MatTek (Ashland, MA) were maintained at 37 °C with 5% CO2. Since the EFT cultures represent human skin barrier equivalents the concentration of equol applied was 1.2% in DMSO or DMSO alone (vehicle control) or no application/untreated controls. The total volume applied to the EFT human skin cultures was 20 µl and the exposure time was for 24 h, as described previously (Gopaul et al., Citation2012).
Gene array/mRNA experiments
This was accomplished through experiments using gene (array/mRNA levels) expression where several skin genes could be examined at the same time using human skin equivalent (EFT human skin) cultures. Forty human skin-related genes were selected to study covering the most common and/or important for dermal health such as, extracellular matrix proteins, antioxidants, growth factors, aging and inflammatory biomarkers. Gene expression was performed to test R-equol versus racemic equol versus S-equol at 1.2% compared to DMSO vehicle controls (at 24 h of exposure), plus untreated controls, n = 6 per gene biomarker tested, where details of the methods are described elsewhere (Gopaul et al., Citation2012). Validation of changes in the gene biomarkers/mRNA levels and confirmation of the corresponding changes in protein levels has been reported previously for non-racemic equol (Gopaul et al., Citation2012). However, in brief, at the end of the 24-h incubations, total RNA was isolated using Qiagen RNEasy Fibrous Tissue Isolation/Qiagen TissueLyer LT Kits (Valencia, CA). RNA quality was confirmed (A260/A280), all samples had values from 1.8 to 2.1. Also, for quantitative polymerase chain reaction analysis, 1 µg of total RNA from each tissue EFT sample was converted to cDNA (High-Capacity cDNA Reverse Transcription Kit, Life Technologies, Foster City, CA). Custom TaqMan’s low-density arrays were created using Life Technologies validated gene expression assays (Applied Biosystems, Foster City, CA) that contained target genes and five common endogenous control genes for amplification/fluorescence detection (Applied Biosystems 7900HT). Glyceraldehyde-3-phosphate dehydrogenase served as the control gene for all samples/experiments. Cycling conditions were 50 °C for 2 min, 94.5 °C for 10 min, followed by 40 cycles of 97 °C for 30 s, 59.7 °C for 1 min. mRNA levels were quantified using Applied Biosystem’s Sequence Detection Software (SDS, v2.3) and RQ Manager (v1.2.1) programs (Foster City, CA). Inhibition of gene expression was detected by significantly lower copy numbers and significant stimulation of gene expression was detected by higher copy numbers compared to control values for each biomarker (see “Statistical Analysis” section below).
EFT skin culture histological analysis
To validate the integrity of all the EFT skin cultures after application of the treatments sections of the skin cultures were prepared. The skin sections were placed on sides and then stained with hematoxylin/eosin that revealed the cellular components [epidermal layers (stratum corneum and keratinocytes), dermal (fibroblasts), and epidermal/dermal borders].
In vitro quantification of collagen type I in human monolayer fibroblasts
In brief, this was performed by using fibroblasts from neonatal foreskin [in DMEM (MediaTech Inc., Manassas, VA); 1 × non-essential amino acids (HyClone, Logan, UT); 1 × antibiotic/antimycotic (Sigma Chemical Co., St. Louis, MO) and 2% bovine calf serum (Invitrogen Corp., Carlsbad, CA) as reported previously (Gopaul et al., Citation2012)]. Approximately 55 cells per 10 cm dish were cultured for 24 h in a 37 °C humidified incubator with 5% CO2, then the medium was changed, the test materials [DMSO vehicle control, racemic equol, or S-equol in DMSO and 17β-estradiol in DMSO (all treatment levels were at 1 or 10 nM; n = 6 per treatment group)] were added and cultured for 48 h. The amount of the cleaved collagen type I C-terminal propeptide was directly proportional to the amount of type I collagen deposited, and was precisely quantified using purified standards and a commercial ELISA Kit (Takara Mirus, Inc., Madison, WI). Ascorbic acid (ascorbate; served as the positive control) and was added to the cultures at 20 μg/ml and untreated controls were also included (Gopaul et al., Citation2012).
Cytotoxicity of the test materials, in parallel studies using the human dermal monolayer fibroblast cultures (as described above), was quantified by spectrophotometric detection of reduced 3-(4,5-dimethylthiazol-2-yl)-2,5-diphenyltetrazolium bromide (MTT) at 550 nm using a Molecular Devices VMax 96-well plate reader and SoftMax software (Sunnyvale, CA). Metabolic activity can be used as a measure of cytotoxicity, in that the intensity of the reduced form of MTT by live cells is directly proportional to cellular viability, and inversely proportional to cytotoxicity, as previously shown (Gopaul et al., Citation2012).
Percutaneous absorption of equol into human skin
Percutaneous absorption of racemic equol was measured using the in vitro human skin finite dose technique (Franz, Citation1975). Human trunk skin obtained from American Association of Tissue Banks (AATB; McLean, VA) from four individuals (two males and two females of Caucasian and Hispanic decent, aged 35–51 years, n = 3 per subject) were cut into sections to fit on 1.0 cm2 Franz cells (Crown Glass Co., Somervile, NJ) for the accurate determination of in vitro percutaneous absorption characteristics (Franz, Citation1978).
In brief, a standard Franz cell protocol was followed that maintained temperature, humidity, receptor solution, surface washes, sample collection procedures, etc. (Franz, Citation1975, Citation1978). For example, first, the integrity of each skin section was determined. Second, the percutaneous absorption of the [3H]-equol (American Radiolabeled Chemicals, St. Louis, MO) was determined by the quantification of the tritiated marker for: (i) the profile of the mean flux (μg/cm2/h) over 0, 1, 3, 6, 10, 18, 28, and 40 h collection time points, (ii) the distribution of the test material into the different epidermal/dermal layers, and (iii) the determination of the mass balance results across the skin donors. Just prior to dosing (using a proprietary vehicle formulated with distilled water, butylene glycol, and transcutol), the chimney was removed from the Franz cell to allow full access to the epidermal surface of the skin and then the racemic [3H]-equol was applied to the skin sections using a positive displacement pipette (delivering 5 μl/1.0 cm2). The dose was spread over the skin surface using a Telfon flat spatula and then 5–10 min after the application the chimney portion of the Franz cell was replaced. At pre-selected time intervals the receptor solution was removed in its entirety and then replaced with fresh solution (0.1 × phosphate-buffered saline with 0.1% Volpo). From the receptor solution samples, surface wash, and skin sections (that were split into epidermal and dermis components), an aliquot of each sample was mixed with 5 ml scintillation fluid (ScintiVerse, Fisher Scientific, Pittsburgh, PA) and the [3H]-equol content was quantified by liquid scintillation counting using a Perkin Elmer Liquid Scintillation Analyzer Tri-Carb 3100TR (Waltham, MA). Counts per minute were converted automatically to disintegrations per minute using an external standard quench correction curve and all calculations were based upon experimentally determined values for the specific activity of the [3H]-equol or the non-radioactive (“cold” equol) dose applied.
Statistical analysis
For gene array/mRNA expression data analysis, the Limma unpaired t-test was used to detect significant changes in gene expression between the treatment and control groups (vehicle control and untreated controls) (p < 0.005) using Statminer software v3.0 (Madison, WI). This analysis measures the strength of the relationship between gene expression and the response variable (control values) using non-parametric statistics. Only data that displayed significant stimulation or inhibition of the gene markers are reported using the statistical analysis described above. In the human monolayer fibroblast (collagen type I) experiment, the data were analyzed by analysis of variance followed by pairwise comparisons (Tukey’s test; p < 0.05). All data are expressed as the mean + SEM (standard error of the mean), while the percutaneous absorption (mean flux) data are expressed as the mean with the SEM range stated in .
Results
Validation of the integrity of the EFT skin cultures after application of the treatments
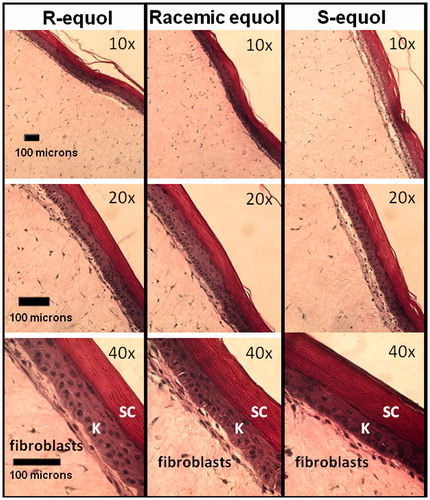
All EFT skin cultures were assayed among the treatment groups by the preparation of skin sections on slides subsequently stained with hematoxylin/eosin. All treatment slides displayed intact and healthy epidermal layers (stratum corneum and keratinocytes), dermal (fibroblasts) components, and epidermal/dermal borders. This suggests that equivalent skin culture samples were used in all testing conditions examining the equol treatments. Representative EFT skin sections across the treatment groups are shown in at 10×, 20×, and 40× magnification.
Figure 1. Validation of EFT skin culture integrity. Representative EFT histological sections across the R-equol, racemic equol, and S-equol treatments for the gene array experiments are displayed at 10×, 20×, and 40× magnification. Marker bars are shown in the bottom left-hand corner in the frames. The skin sections were stained with hematoxylin/eosin and all treatment slides displayed intact and healthy epidermal layers (SC = stratum corneum and K = keratinocytes), dermal (fibroblasts) components, and epidermal/dermal borders.
Microarray analysis of skin-related gene expression by the equol treatments
DMSO alone significantly inhibited collagen and significantly stimulated matrix metalloproteinase (MMPs) expression compared to untreated controls in this study.
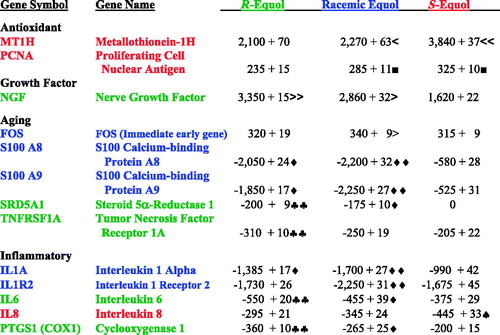
Nineteen of the 40 genes tested displayed significant changes in the biomarkers. Notably, 16 of the genes displayed the greatest significant levels by R-equol and/or racemic equol for the quantified biomarkers (–). Only three of the skin-related genes displayed the greatest significant expression by S-equol [i.e., metallotheonein-1H (MT1H), proliferating cell nuclear antigen (PCNA) which are considered antioxidant genes protecting against metal toxicity and DNA damage and interleukin-8 (IL8) an inflammatory gene] ().
Figure 2. Percentage stimulation of COL1A1, ELN, and TIMP gene expression by the equol treatments compared to control values. Significantly greater stimulation compared to S-equol indicated by asterisk; significantly greater stimulation compared to R-equol or S-equol indicated by two triangles and significantly greater stimulation compared to R-equol indicated by diamond symbol.
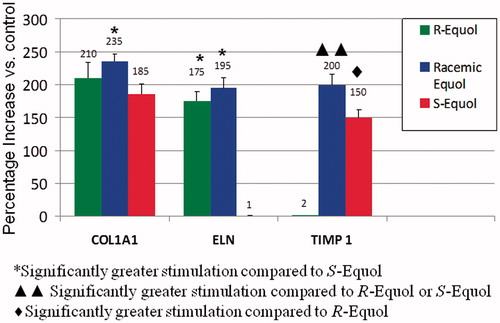
Figure 3. Percentage inhibition of MMPs gene expression by the equol treatments versus control values. Significantly greater inhibition compared to racemic equol or S-equol by two triangles and significantly greater inhibition compared to S-equol indicated by one triangle.
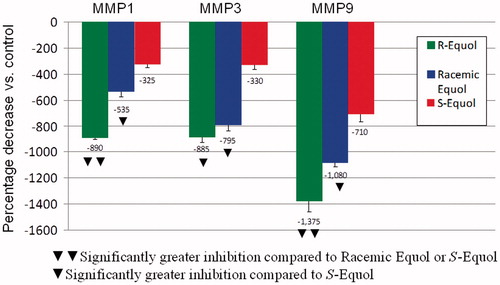
Figure 4. Skin antioxidant, growth factor, aging, and inflammatory biomarkers for: R-equol, racemic equol, and S-equol. Each gene symbol/name is color-coded indicating the equol form with the greatest (stimulation or inhibition) expression level. Less than symbol indicates significantly greater stimulation compared to R-equol; two less than symbol indicates significantly greater stimulation compared to racemic equol or R-equol; greater than symbol indicates significantly greater stimulation compared to S-equol; two greater than symbol indicates significantly greater stimulation compared to racemic equol or S-equol; square symbol indicates significantly greater stimulation compared to R-equol; diamond symbol indicates significantly greater inhibition compared to S-equol; two diamond symbol indicates significantly greater inhibition compared to R-equol or S-equol; two club symbol indicates significantly greater inhibition compared to racemic equol or S-equol; spade symbol indicates significantly greater inhibition compared to racemic equol or R-equol. About 1.2% equol (treatments: R-equol, racemic equol, or S-equol) in DMSO vehicle versus DMSO control levels; n = 6. Values represent percentage (%) increase or decrease versus control values, followed by pairwise comparisons among treatment groups (mean + SEM) of gene array analysis (via quantification of mRNA levels by TaqMan fluorescence detection), p < 0.005 for all data.
As shown in , collagen (COL1A1) and elastin (ELN) gene expression was significantly stimulated by racemic equol or by R-equol compared to S-equol where these matrix proteins are important for maintaining optimal skin health. In fact, S-equol did not stimulate ELN at all. For tissue inhibitor of matrix metalloproteinase-1 (TIMP1), racemic equol, or S-equol significantly increased expression compared to R-equol (). Notably, TIMP1 is a protein that blocks the actions of the MMPs that break down collagen. Also, when MMP1, MMP3, and MMP9 were examined all three metalloproteinases were significantly decreased by R-equol and/or racemic equol compared to S-equol ().
As shown in , R-equol and/or racemic equol displayed the greatest expression for feline osteosarcoma virus (FOS) and the growth factor gene, nerve growth factor (NGF) compared to S-equol. For the aging genes: S100 calcium-binding proteins (A8 and A9), steroid 5α-reductase type I (SRD5A1), and tumor necrosis factor receptor 1A (TNFRSF1A) were significantly decreased by R-equol and/or racemic equol compared to S-equol (), reflecting changes that would play a role in improving skin health.
For the inflammatory gene biomarkers similar findings were observed where R-equol and/or racemic equol displayed greater significant inhibition compared to S-equol [e.g., interleukin-1 alpha (IL1A), interleukin 1 receptor 2 (IL1R2), interleukin-6 (IL6), and cyclooxygenase 1 (PTGS1 or COX1) ()].
Human monolayer fibroblast cultures: Collagen type I stimulation by racemic equol versus S-equol
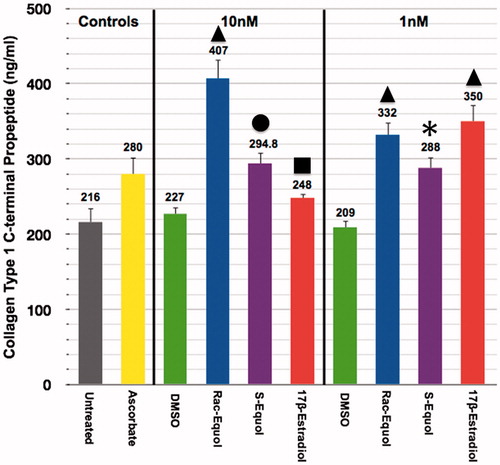
In short-term (48 h) human fibroblast skin cultures collagen type I deposition was significantly increased by all of the treatments (). However, at the 1 nM dosing 17β-estradiol and racemic equol displayed greater stimulation of collagen compared to S-equol using DMSO vehicle control levels as the baseline. Also, at the 10 nM dose racemic equol displayed the greatest stimulation of collagen among all the treatments or ∼1.8-fold over DMSO control values. S-equol and 17β-estradiol levels were significantly less than racemic equol values but both S-equol and 17β-estradiol displayed significantly greater levels compared to DMSO controls ().
Figure 5. Collagen type I deposition in human monolayer fibroblasts in short-term (48 h) cultures via racemic equol, S-equol versus 17β-estradiol stimulation. Triangle symbol indicates significantly greater than all other treatments within dose (at 1 or 10 nM); asterisk symbol indicates significantly greater than DMSO control values at 1 nM; circle symbol indicates significantly greater than 17β-estradiol or DMSO controls at 10 nM; square symbol indicates significantly greater than DMSO control values at 10 nM. Collagen quantification via ELISA analysis, n = 6 per treatment group, ascrobate served as the positive control along with the natural steroid hormone, 17β-estradiol. DMSO served as the vehicle control for all equol or 17β-estradiol treatments. Cell viability via MTT assay among the treatments ranged from 85 to 95%. The data are expressed as the mean + SEM, p < 0.05.
Percutaneous absorption profile of equol into human skin
After obtaining the above results, racemic equol was tritiated and used as a marker to determine: (i) the percutaneous absorption, (ii) skin content distribution among the epidermal and dermal compartments, and (iii) mass balance results across the skin donors. As displayed in , the data indicate that [3H]-equol does penetrate into human skin with a profile showing an initial maximum peak flux occurring 6 h after dosing followed by a decline in penetration with a secondary lower peak flux at ∼26–28 h after a single applied dose. The calculated total absorption of all material (vehicle) in this in vitro model over 48 h was 1.2 ± 0.8 μg while total absorption expressed as 8.60 ± 5.68% of the [3H]-equol marker or 103.2 nM.
Figure 6. [3H]-Equol percutaneous absorption profile into human skin. [3H]-Equol was used to determine percutaneous absorption into human skin with a profile showing an initial maximum peak flux occurring 6 h after dosing followed by a decline with a secondary lower peak at ∼26–28 h after a single applied dose. Human trunk skin obtained from four individuals (two males and two females of Caucasian and Hispanic decent, aged 35–51 years, n = 3 per subject) were tested by Franz cell techniques. The SEM among the time point collections ranged from 0.005 to 0.024 (not shown graphically).
![Figure 6. [3H]-Equol percutaneous absorption profile into human skin. [3H]-Equol was used to determine percutaneous absorption into human skin with a profile showing an initial maximum peak flux occurring 6 h after dosing followed by a decline with a secondary lower peak at ∼26–28 h after a single applied dose. Human trunk skin obtained from four individuals (two males and two females of Caucasian and Hispanic decent, aged 35–51 years, n = 3 per subject) were tested by Franz cell techniques. The SEM among the time point collections ranged from 0.005 to 0.024 (not shown graphically).](/cms/asset/b6633774-6ee6-48d6-a49c-b83ab3a5ccda/iphb_a_793720_f0006_b.jpg)
When the actual epidermal/dermal content of the tritated marker was quantified, the epidermal content was higher than is typically observed with most topical compounds or drugs representing over 11.2 ± 4.7% of the applied dose or ∼14 nM overall of the non-radioactive equol (or “cold” equol) of the single applied dose. This epidermal data suggest a sequestering of the equol in the epidermis. Additionally, the dermal percentage was 0.33 ± 0.06% with an equol content that was higher (at ∼4 nM of the non-radioactive equol) compared to most other topically delivered compounds or drugs suggesting a slow release of equol from the epidermal to the dermal compartment over time that is consistent with the percutaneous absorption flux profile shown in . Total penetration through the dermis after 48 h with a single applied dose was ∼12.4 nM. The mass balance across skin donors was good at 90.1 ± 1.7%. Thus, an epidermal “reservoir” appears to deliver topically applied equol to the dermal layer over time with adequate levels to account for the obtained microarray gene expression data presented in this study.
Discussion
The focus to study equol isomers in this investigation was based on the lack of knowledge concerning the properties of these mirror-image molecules since this polyphenolic molecule along with other botanical compounds have wide use in personal care products, especially in topical applications for skin health. It is well established that a gradual decline in overall skin physiology occurs with aging that includes structural changes in the epidemis and dermis along with functional changes in fibrobasts and other cellular components that are linked to the expression of skin-related genes and proteins (Yarr & Gilchrest, Citation2003). Because of its accessibility, skin was one of the first organs examined by microarray technologies (Blumenberg, Citation2006). While gene expression technologies have been used to examine the beneficial effects of soy extracts that contain polyphenolic molecules (Sudel et al., Citation2005), there are no investigations that have studied the isoflavonoid molecules such as genistein or daidzein via gene arrays in human skin. Previously, our laboratory studied an R/S mixture of equol via gene array and protein expression methods (Gopaul et al., Citation2012). However, this is the first comprehensive study to investigate equol as: R-equol, racemic equol, or S-equol to quantify their differential expression of skin-related genes in order to establish topical strategies that favor antioxidant, anti-aging, and skin regeneration.
These present results indicate the importance of examining the enantiomeric (mirror image) forms of equol in the expression of skin genes for COL1A1, ELN, and TIMP 1 that play essential roles in maintaining healthy dermal components especially with aging (Baumann, Citation2009; Kohl, Citation2011). COL1A1 and ELN gene expression was significantly stimulated by racemic equol or by R-equol compared to S-equol. The significantly greater stimulation of racemic equol versus S-equol for collagen via the microarray analysis was confirmed in the in vitro human fibroblasts monolayer cultures where collagen type I was quantified at the 1 and 10 nM doses and the 10 nM results are similar to that previously reported by Gopaul et al. (Citation2012). Notably, S-equol had no influence in stimulating ELN at all, which was surprising. However, for TIMP 1, racemic equol, or S-equol significantly increased gene expression compared to R-equol.
Since MMPs play such an essential role in breaking down collagen especially with extrinsic photo-aging that leads to intrinsic or chronologically aging (Kohl, Citation2011) this study examined three major MMPs. Inhibition of these MMPs molecules by equol to provide anti-aging skin benefits is remarkable but now we demonstrate these positive effects of equol are due more to R-equol than S-equol. For example, when MMP1, MMP3, and MMP9 were examined all three metalloproteinases were significantly decreased by R-equol and/or racemic equol compared to S-equol. Collectively for the MMPs (combining the inhibition results among all three MMPs), R-equol displayed a 2.3-fold greater inhibition of the MMP molecules and racemic equol a 1.8-fold greater inhibition compared to the inhibition by S-equol.
The present findings also support the known powerful antioxidant activities of equol (Rufer & Kulling, Citation2006) and further elucidate which isomers of equol contribute to these positive properties. Also, differential effects of the isomers were seen with S-equol inducing the significant expression (∼1.7-fold increase over racemic and R-equol) of MT1H and PCNA considered antioxidant genes protecting against metal toxicity and DNA damage (Hanada et al., Citation1998; Takahashi et al., Citation2005). Finally, looking at NGF, a molecule expressed in keratinocytes and reduced by ultraviolet B exposure (or sun exposure/photo-aging) that is important in cell survival, wound healing, and regeneration of cutaneous nerves (Nithya et al., Citation2003; Pincelli et al., Citation1994), and displayed a greater stimulation with R-equol and racemic equol compared to S-equol values.
The aging genes: S100 A8 and A9 and the steroid SRD5A1 are crucial due to their impact in skin health since the calcium-binding proteins change with UV irradiation (sun exposure or photo-aging) and chronological aging (Gopaul et al., Citation2012; Lee et al., Citation2009) and the SRD5A1 gene product converts circulating testosterone to the more potential androgen (Lund et al., Citation2011). Notably, 5α-DHT inhibits wound healing by stimulating MMPs (Ashcroft & Mills, Citation2002). All three of these gene biomarkers were significantly decreased with R-equol and/or racemic equol compared to S-equol. Looking at other aging genes, the FOS (immediate early) biomarker is known to protect against photoaging while TNFRSF1A is involved with UV-induced DNA damage via sun exposure or photoaging (Tobin et al., Citation1998; Tomicic et al., Citation2011). The highest levels of FOS gene expression were seen with racemic equol. Conversely, TNFRSF1A expression was significantly inhibited more with R-equol compared to S-equol.
Finally it is known that inflammatory genes, especially with aging or hormonal transitions (like menopause) are fundamental in decreasing skin health (Baumann, Citation2009; Kohl, Citation2011). The properties of the equol isomers revealed surprising results where S-equol only showed greater inhibition of IL-8 compared to R-equol and/or racemic equol, whereas, R-equol and/or racemic equol displayed greater inhibition for all other interleukin biomarkers (IL1A, IL1R2, and IL 6) and cyclooxygenase-1 compared to S-equol.
These data demonstrate that equol acts as a strong antioxidant with anti-inflammatory and anti-aging properties that are important for maintaining optimal dermal health. For instance, equol can act as a selective androgen modulator by binding 5α-DHT locally and inhibiting the SRD5A1 enzyme in dermal fibroblasts since it is known that androgens decrease skin health by increasing the production of metalloproteinases (MMPs) that break down COL1A1 and ELN and decrease wound healing (Ashcroft & Mills, Citation2002; Gopaul, et al., Citation2012; Kohl, Citation2011). Conversely, equol can act as a selective estrogen receptor modulator and bind to estrogen-related receptor gamma in keratinocytes and fibroblasts to stimulate positive influences on skin such as increasing COL1A1 and ELN, decreasing MMPs and slowing down neoplastic growth (Hirvonen et al., Citation2011; Krahn-Bertil et al., Citation2008; Lephart, Citation2013b; Verdier-Sevrain et al., Citation2006). Or other important dermal components may be stimulated by R-equol via unknown mechanisms. Thus, it is important to elucidate the differential impact of the isomeric forms of equol or other enantiomer mixtures, especially when considering the most efficacious isomeric form to utilize in dermal applications for topical and pharmaceutical products.
The percutaneous absorption data demonstrated that equol penetrates into human skin with an unusual delivery prolife. While it should be pointed out that transcutol (as a skin penetrating vehicle) may form an intracutaneous depot for drugs used in topical formulations (Shokri et al., Citation2012), it is more likely that the applied equol is sequestered into the epidermal compartment due to the abundance of estrogen receptor subtypes in keratinocytes for which equol has a high affinity (Lephart, Citation2013a; Lund et al., Citation2011; Setchell et al., Citation2005; Thorton et al., Citation2003). This notion is supported by quantification of the [3H]-equol in the epidermis where the content was higher than typically seen with most other compounds, such as other polyphenolic molecules like resveratrol, the isoflavonoid, genistein, or topical drugs like 17β-estradiol (Chadha et al., Citation2011; Hung et al., Citation2008; Xing et al., Citation2009; Zhong et al., Citation2009). The reservoir forming properties of equol in the epidermis may be due to its lipophilic characteristics where its octanol–water partition coefficient is 3.20, which is higher than other polyphenolic molecules (Rothwell et al., Citation2005). Additionally, intestinal absorption data support this proposition where equol (either as the R- or S-isomer) has the highest absorption levels (80–85%) compared to other isoflavonoids, such as genistein (at 15–20%) or daidzein (at 30–40%) (Setchell et al., Citation2009; Setchell & Clerici, 2010). Drug-delivery studies have shown the more stable isomer is R-equol versus S-equol (Alvira et al., Citation2008) and in vitro culture data suggest that the R-isomer accounts for the chemoprotective effects of equol rather than the S-isomer in breast and prostate cancer cells (Magee et al., Citation2006). These aforementioned data support the greater benefit of R-equol versus S-equol for the skin biomarkers in the present study. Finally, the delivery of ∼14 nM of equol into the keratinocytes (after a single dose) in the percutaneous absorption studies is similar to previous in vitro culture results where the continual exposure of 10 nM of equol significantly stimulated COL1A1 and ELN while at the same time significantly inhibited MMP(s) protein expression (Gopaul et al., Citation2012).
Conclusions
In summary, these results illustrate the significant differences in mirror-image molecules of equol for skin-related gene expression and clearly demonstrate that: (i) R-equol and/or racemic equol are better molecules for dermal gene expression in anti-aging effects compared to S-equol and thus would be more potent or efficacious ingredients in topical and pharmaceutical applications and (ii) the reservoir forming properties of equol in the epidermis may be due to its lipophilic characteristics and/or affinity for estrogen receptor subtypes that allow for novel delivery of its positive actions to improve skin health and regeneration.
Declaration of interest
The author report no conflicts of interest. The author alone is responsible for the content and writing of this article.
Acknowledgements
The author acknowledges Paul A. Lehman, MS (Dermal Director) and Thomas J. Franz, MD (Executive Medical Director) at PRACS Institute for assistance with the percutaneous absorption studies, Anna Langerveld, PhD at Genemarkers LLC for assistance with the gene array analysis and Frank Ziegler with the in vitro human monolayer fibroblast experiments. This study was supported by Tech Transfer Office (TTO)/Life Science College (LSC) funding (19-22156) from Brigham Young University, Provo, UT, USA.
References
- Alvira E, Mayoral JA, Garica JI. (2008). Enantiodiscrimination of equol in β-cyclodextrin: An experimental and computational study. J Incl Phenom Macrocycl Chem 60:103–13
- Ashcroft GS, Mills SJ. (2002). Androgen receptor-mediated inhibition of cutaneous wound healing. J Clin Invest 110:615–24
- Baumann LS. (2009). Alternative medicine. In: Cosmetic Dermatology: Principles and Practice, Chapter 17, 2nd ed. Columbus, OH, USA: McGraw-Hill, 125–35
- Blumenberg M. (2006). DNA microarrays in dermatology and skin biology. Omics 10:243–60
- Chadha G, Sathigari S, Parsons DL, Jayachandra Babu R. (2011). In vitro percutaneous absorption of genistein from topical gels through human skin. Drug Dev Indust Pharm 37:498–505
- Frankenfeld CL. (2011). Dairy consumption is a significant correlate of urinary equol concentration in representative sample of US adults. Am J Clin Nutr 93:1109–16
- Franz TJ. (1975). Percutaneous absorption: On the relevance of in vitro data. J Invest Derm 64:190–5
- Franz TJ. (1978). The finite dose technique as a valid in vitro model for the study of percutaneous absorption in man. In: Simon G, Paster Z, Klingberg M, et al., eds. Skin: Drug Application and Evaluation of Environmental Hazards, Current Problems in Dermatology, Vol. 7, Basel, Switzerland: Karger, 58–68
- Gopaul R, Knaggs HE, Lephart ED. (2012). Biochemical investigation and gene analysis of equol: A plant and soy-derived isoflavonoid with anti-aging and anti-oxidant properties with potential human skin applications. Biofactors 38:44–52
- Hanada K, Sawamura D, Hashimoto I, et al. (1998). Epidermal proliferation of the skin in metallothionein-null mice. J Invest Derm 110:259–62
- Hirvonen J, Rajalin AM, Wohlfahrt G, et al. (2011). Transcriptional activity of estrogen-related receptor gamma (ERRgamma) is stimulated by the phytoestrogen equol. J Steroid Biochem Mole Biol 123:46–57
- Hoikkala A, Mustonen E, Saastamoinen I, et al. (2007). High levels of equol in organic skimmed Finnish cow milk. Mol Nutr Food Res 51:782–6
- Höjer A, Alder S, Purup S, et al. (2012). Effects of feeding dairy cows different-legume-grass silages on milk phytoestrogen concentration. J Dairy Sci 95:4526–40
- Hounsome N, Grail B, Deri Tomos A, et al. (2010). High-throughput anti-oxidant profiling in vegetables by Fourier-transform ion cyclotron resonance mass spectrometry. Functional Plant Sci Biotech 4:1–10
- Hounsome N, Hounsome B, Deri Tomos A, Edwards-Jones G. (2009). Changes in anti-oxidant compounds in white cabbage during winter storage. Postharvest Biol Tech 52:173–9
- Hung C-F, Lin Y-K, Huang Z-R, Fang JY. (2008). Delivery of resveratrol, a red wine polyphenol, for solutions and hydrogels via the skin. Bio Pharm Bull 31:955–62
- Jackson RL, Greiwe JS, Schwen RJ. (2011). Ageing skin: Oestrogen receptor beta agonists offer an approach to change the outcome. Exp Dermatol 20:879–82
- Kohl E, Steinbauer J, Landthaler M, Szeimies RM. (2011). Skin ageing. J European Acad Dermatol Venereol 25:873–84
- Krahn-Bertil E, Bolzinger MA, Andre V, et al. (2008). Expression of estrogen-related receptor gamma (ERRgamma) in human skin. Eur J Dermatol 18:427–32
- Lee YM, Kim YK, Eun HC, Chung JH. (2009). Changes in S100A8 expression in UV-irradiated and aged human skin in vivo. Arch Dermatol Res 30:523–9
- Lephart ED. (2013a). Isoflavones and prenatal exposure to equol. In: Preedy VR, ed. Isoflavones: Chemistry, Analysis, Function and Effects, Chapter 29. Cambridge, UK: The Royal Society of Chemistry, 480–99
- Lephart ED. (2013b). Severe and moderate BPH symptoms in mid-aged men improved with isoflavonoid-equol treatment: Pilot intervention study. Open J Urology 3:21–7
- Lund TD, Blake L, Hamaker AN, Lephart ED. (2011). Equol an isoflavonoid: Potential for improved prostate health, in vitro and in vivo evidence. Reprod Biol Endocrinol 9:4
- Magee PJ, Raschke M, Steiner C, et al. (2006). Equol: A comparison of the effects of the racemic compound with that of the purified S-enantiomer on the growth, invasion, and DNA integrity of breast and prostate cells in vitro. Nutr Cancer 54:232–42
- Mustonen EA, Tuori M, Saastamoinen I, et al. (2009). Equol in milk of dairy cows is derived from forage legumes such as red clover. Br J Nutr 102:1552–6
- Nithya M, Suguna L, Rose C. (2003). The effect of nerve growth factor on the early responses during the process of wound healing. Biochem Biophys Acta 1620:25–31
- Pincelli C, Sevignani C, Manfredini R, et al. (1994). Expression and function of nerve growth factor and nerve growth receptor on cultured keratinocytes. J Invest Derm 103:12–18
- Rothwell JA, Day AJ, Morgan MR. (2005). Experimental determination of octanol–water partition coefficients of quercetin and related flavonoids. J Agr Food Chem 53:4355–60
- Rufer CE, Kulling SE. (2006). Antioxidant activity of isoflavones and their major metabolites using different in vitro assays. J Agr Food Chem 54:2926–31
- Setchell KDR, Clerici C. (2010). Equol: History, chemistry, and formation. J Nutr 140:1355S–62S
- Setchell KDR, Clerici, C, Lephart ED, et al. (2005). S-Equol, a potent ligand for estrogen receptor {beta}, is the exclusive enantiomeric form of the soy isoflavone metabolite produced by human intestinal bacterial flora. Am J Clin Nutr 81:1072–9
- Setchell KDR, Zhao X, Jah P, et al. (2009). The pharmacokinetic behavior of the soy isoflavone metabolite S-(−) equol and its diastereoisomer R-(+)equol in healthy adults determined by using stable-isotope-labeled tracers. Am J Clin Nutr 90:1029–37
- Shokri J, Azarmi SH, Fasihi Z, et al. (2012). Effects of various penetration enhancers on percutaneous absorption of piroxicam form emulgels. Res Pharm Sci 7:225–34
- Sudel KM, Venzke K, Mielke H, et al. (2005). Novel aspects of intrinsic and extrinsic aging of human skin: Beneficial effects of soy extract. Photochem Photobiol 81:581–7
- Takahashi Y, Moriwaki S, Sugiyama Y, et al. (2005). Decreased gene expression responsible for post-ultraviolet DNA repair synthesis in aging: A possible mechanism of age-related reduction in DNA repair capacity. J Invest Derm 124:435–42
- Thorton MJ, Taylor AH, Mulligan K, et al. (2003). The distribution of estrogen receptor β is distinct to that of estrogen receptor α and the androgen receptor in human skin and the pilosebaceous unit. J Invest Derm Symp Proc 8:100–3
- Tobin D, Hogerlinden M, Toftgard R. (1998). UVB-induced association of tumor necrosis factor (TNF) receptor 1/TNF receptor-associated factor-2 mediates activation of Rel proteins. Proc Natl Acad Sci USA 95:565–9
- Tomicic MT, Reischmann BR, Rasenberger B, et al. (2011). Delayed c-Fos activation in human cells triggers XPF induction and an adaptive response to UVC-induced DNA damage and cytotoxicity. Cell Mol Life Sci 68:1785–98
- Verdier-Sevrain S, Bonte F, Gilchrest B. (2006). Biology of oestrogens in skin: Implications for aging. Exp Dermatol 15:83–94
- Xing MH, Hui X, Zhong W, et al. (2009). In vitro human topical bioactive drug transdermal absorption: Estradiol. Cutaneous Ocular Toxicol 28:171–5
- Yarr M, Gilchrest BA. (2003). Aging of skin. In: Freedberg IM, Elsen AZ, Wolff K, et al., eds. Fizpatrick’s Dermatology in General Medicine, Chapter 144, 6th ed. NY, USA: McGraw-Hill, 1386–98
- Zhong W, Xing MMQ, Hui X, Maibach HI. (2009). A stochastic model for transepidermal drug delivery. Skin Res Tech 15:407–11