Abstract
Context: Sophora flavescens Ait. (Leguminosae) has been proposed as a new whitening agent for cosmetics, because it has a strong ability to inhibit tyrosinase, a key enzyme in the formation of melanin.
Objective: We conducted a study to determine whether ethanol extract of the roots of S. flavescens has the potential for use as a whitening cosmetic agent by investigating its underlying mechanisms of action.
Materials and methods: To elucidate the mechanism of action of S. flavescens extract, we used DNA microarray technology. We investigated the changes in the mRNA levels of genes associated with the formation and transport of melanosomes. We also identified the formation and transport of melanosomes with immunohistochemistry and immunofluorescence analyses. Finally, the skin-whitening effect in vivo of S. flavescens extract was analyzed on human skin.
Results: We found that S. flavescens extract strongly inhibited tyrosinase activity (IC50, 10.4 μg/mL). Results also showed that key proteins involved in the formation and transport of melanosomes were dramatically downregulated at both mRNA and protein level in keratinocytes exposed to S. flavescens extract. In addition, a clinical trial of a cream containing 0.05% S. flavescens extract on human skin showed it had a significant effect on skin whitening by mechanical and visual evaluation (1.14-fold).
Discussion and conclusion: This study provides important clues toward understanding the effects of S. flavescens extract on the formation and transport of melanosomes. From these results, we suggest that naturally occurring S. flavescens extract might be useful as a new whitening agent in cosmetics.
Introduction
Skin pigmentation is accomplished by production of melanin, which is synthesized in the melanosomes of melanocytes and by transfer of these organelles from melanocytes to surrounding keratinocytes. It is well known that racial differences in skin pigmentation depend both on the amount and the type of melanin and also on the differences in size, number and distribution pattern of melanosomes within keratinocytes (Boissy, Citation2003; Cardinali et al., Citation2008).
Tyrosinase (TYR), a rate-limiting enzyme, catalyzes the conversion of tyrosine to 3,4-dihydroxyphenylalanine (l-DOPA) and further oxidizes it to dopaquinone, which is used for the ultimate formation of melanin (Kim et al., Citation2003). Therefore, many tyrosinase inhibitors are useful in cosmetics as skin-whitening agents. For example, kojic acid and arbutin are currently commercially available in Northeast Asia. However, these exhibited side effects, toxicity and low stability toward oxygen and water (Kim & Uyama, Citation2005). Nowadays, many studies are beginning to focus on deriving tyrosinase inhibitors from natural sources such Sophora flavescens Ait. (Leguminosae) (Kim et al., Citation2003), Glycyrrhiza uralensis Fisch. (Leguminosae) (Kim et al., Citation2005), Morus alba Linn. (Moraceae) (Lee et al., Citation2002), Glycyrrhiza glabra Linn. (Leguminosae) (Jung et al., Citation2001) and green tea (No et al., Citation1999). S. flavescens, known as the Chinese drug “Kushen”, is used as a folk medicine for its antipyretic, analgesic, anthelmintic and stomachic properties (Ryu et al., Citation1997, Citation2008). S. flavescens is known to contain numerous prenylated flavonoids, including kushenol E, kushenol B, sophoraflvanone G, kushenol L, kushenol M, kuraridin, kurarinone, kushenol N, kosamol A, norkurarinol, kurarinol and kushenol H. Among these compounds, kushenol F, sophoraflavanone G, kuraridin and kurarinone in the dichloromethane fraction of the ethanolic extract of S. flavescens were recently reported to be tyrosinase inhibitors. In particular, kurarinol, kuraridinol and trifolirhizin from the ethyl acetate fraction of S. flavescens exhibited higher inhibitory activities on tyrosinase activity than kojic acid with low cytotoxicity (Hyun et al., Citation2008; Ryu et al., Citation2008; Son et al., Citation2003).
To elucidate the mechanism of action of S. flavescens extract, we used DNA microarray technology to investigate the whitening effect of S. flavescens on differential gene expression profiling. Moreover, we investigated the changes in the mRNA levels of genes associated with the formation and transport of melanosomes, such as MITF, RAC1, RAB27A and PAR2, using the real-time polymerase chain reaction (RT-PCR) technique. We also investigated protein levels of MITF using western blotting and identified the formation and transport of melanosomes with immunohistochemistry and immunofluorescence analyses. Finally, the skin-whitening effect of S. flavescens extract was analyzed on human skin. Therefore, in this study, we investigated the whitening effect of a natural product, S. flavescens extract, as a new whitening agent for cosmetics.
Materials and methods
Materials
The ethanol extracts of the roots of S. flavescens and G. uralensis were obtained from Bioland (conditions not shown) (Cheonan, Korea). Both positive controls (kurarinone and arbutin) and melanocyte-stimulating hormone (α-MSH) were purchased from Sigma Chemical Company (St. Louis, MO).
In vitro tyrosinase inhibition assay
Each sample was assayed for tyrosinase inhibition by measuring its effect on tyrosinase activity in a 96-well reader (Model: spectra MAX 340). The reaction was carried out in 100 mM sodium phosphate buffer (pH 6.7) containing 1 mM l-tyrosine and 80 unit/mL mushroom tyrosinase at 37 °C. The reaction mixture was pre-incubated for 10 min before adding substrate. The change of the absorbance at 475 nm was measured. The percentage inhibition of tyrosinase was calculated as follows: Inhibition (%) = [(A − B)/A] × 100. Where A is absorbance at 475 nm without sample and B is the change in absorbance at 475 nm with each sample.
Keratinocyte and melanocyte cell culture
Human HaCaT keratinocyte and SK-MEL-2 melanoma cell lines were purchased from the CLS (Cell Lines Service, Eppelheim, Germany) and American Type Culture Collection (Rockville, MD), respectively. Cells were grown in DMEM media supplemented with 10% (v/v) FBS (Gibco/Invitrogen, Grand Island, NY) and 1% (w/v) penicillin-streptomycin (Gibco/Invitrogen) in a 37 °C incubator with 5% (v/v) CO2 in a humidified atmosphere. Cells were grown to confluence, trypsinized and then subcultured.
Cell proliferation assay (MTT assay)
Cell proliferation was measured by counting viable cells by using the 3-(4,5-dimethylthiazol-2-yl)-2,5-diphenyltetrazolium bromide (MTT; Sigma Chemical Company) colorimetric dye-reduction method. Exponentially growing HaCaT cells (5 × 10³ cells/well) were plated in a 96-well plate and incubated in growth medium treated with 0, 1, 2.5, 5, 10 and 25 μg/mL S. flavescens extract, G. uralensis extract, kurarinone and arbutin at 37 °C. After 24 h, the medium was aspirated by centrifugation, and MTT-formazan crystals were solubilized in 100 μL DMSO. The optical density of each sample at 570 nm was measured using an ELISA reader. The optical density of the medium was proportional to the number of viable cells. Inhibition of proliferation was evaluated as a percentage of control growth (0.1% DMSO in the medium). All experiments were repeated in at least two experiments in triplicate.
RNA isolation
HaCaT cells were seeded at 1 × 10⁶ cells into 100-mm diameter cell culture dishes. After 24 h, the cells were treated (GI50 concentration) with 14.67 μg/mL S. flavescens extract, 4.41 μg/mL kurarinone, 1.97 μg/mL G. uralensis extract and 1005.07 μg/mL arbutin for 6 h. Total RNA from each sample was extracted using TRIZOL reagent (GibcoBRL, Rockville, MD) according to the manufacturer’s protocol. RNA was treated with the RNase-free DNase I (Promega, Madison, WI) to reduce DNA contamination. Total RNA concentration and purity were determined spectrophotometrically by the absorbance ratio at 260:280 nm. Only samples with absorbance ratios greater than 1.8 were used. The integrity of RNA samples was also ascertained by the appearance of distinct bands of 28S and 18S ribosomal RNA using a Bioanalyzer 2100 system (Agilent Technology, Santa Clara, CA).
DNA microarray analysis
For control and test RNAs, the synthesis of target cRNA probes and hybridization were performed using Agilent’s Low RNA Input Linear Amplification Kit PLUS (Agilent Technology) according to the manufacturer’s instructions. Briefly, 0.5 µg total RNA was mixed with the diluted Spike mix and T7 promoter primer mix and incubated at 65 °C for 10 min. cDNA master mix (5× First Strand buffer, 0.1 M DTT, 10 mM dNTP mix, RNase-Out and MMLV-RT) was prepared and added to the reaction mixture. The samples were incubated at 40 °C for 2 h and then the RT and dsDNA synthesis was terminated by incubating at 65 °C for 15 min. The transcription master mix was prepared according to the manufacturer’s protocol (4× Transcription buffer, 0.1 M DTT, NTP mix, 50% PEG, RNase-Out, inorganic pyrophosphatase, T7-RNA polymerase and Cyanine 3/5-CTP). Transcription of dsDNA was performed by adding the transcription master mix to the dsDNA reaction samples and incubating at 40 °C for 2 h. Amplified and labeled cRNA was purified on RNase Mini Spin Columns (Qiagen, Hilden, Germany) according to the manufacturer’s protocol. The labeled cRNA target was quantified using ND-1000 spectrophotometer (NanoDrop Technologies, Wilmington, DE). After checking labeling efficiency, each 750 ng of cyanine 3-labeled and cyanine 5-labeled cRNA target were mixed and the fragmentation of cRNA was performed by adding 10× blocking agent and 25× fragmentation buffer and incubating at 60 °C for 30 min. The fragmented cRNA was resuspended with 2× hybridization buffer and directly pipetted onto an assembled Agilent Whole Human Genome Oligo Microarray. The arrays were hybridized at 65 °C for 17 h using an Agilent hybridization oven. The hybridized microarrays were washed according to the manufacturer’s washing protocol.
Microarray data analysis
Data from the hybridization images were acquired using an Agilent DNA microarray scanner and quantified using Agilent Feature Extraction software. The average fluorescence intensity for each spot was calculated and local background was subtracted. All data normalization and selection of fold-changed genes were performed using GeneSpring GX 7.3 (Agilent Technology). Intensity-dependent normalization (LOWESS) was performed, where the ratio was reduced to the residual of the Lowess fit of the intensity vs. ratio curve. The averages of normalized ratios were calculated by dividing the average of normalized signal channel intensity by the average of normalized control channel intensity.
Real-time PCR
To verify and quantify the changes in expression of some of the genes obtained using the microarray method, we used real-time PCR (SYBR green method). The sequences of forward and reverse primers for MITF, microphthalmia-associated transcription factor (NM_198159), RAC1, ras-related C3 botulinum toxin substrate 1 (NM_198829), F2RL1, coagulation factor II (thrombin) receptor-like 1 (PAR2, NM_005242) and GAPDH (NM_002046, as loading control) were as follows: MITF (forward) 5′-GCACCATCACCTTCAACAAC-3′ and (reverse) 5′-TGTCGTCCATCAGGATGTCT-3′; PAR2 (forward) 5′-CCCACGTCACTGGAAAAGGA-3′ and (reverse) 5′-GGCAAACCCACCACAAACAC-3′; RAC1 (forward) 5′-GCAGTAGATGATGAAAGAAAGGTTG-3′ and (reverse) 5′-ATTGCTCAGTCAGAAGGGGTT-3′; and GAPDH (forward) 5′-GGTCTCCTCTGACTTCAACA-3′ and (reverse) 5′-AGCCAAATTCGTTGTCATAC-3′. Total RNA (1 μg) was reverse transcribed to cDNA according to the manufacturer’s instructions using M-MLV reverse transcriptase (Invitrogen, Carlsbad, CA). Reactions were carried out in the Roche LightCycler® 480 (Roche Diagnostics GmbH, Mannheim, Germany) and relative transcript levels were determined using glyceraldehyde-3-phosphate dehydrogenase (GAPDH) as the endogenous control gene. Each reaction was performed in triplicate. Crossing-point (cycle number in a log-linear region) value for each curve was calculated using the LightCycler® 480 quantification software.
Western blot and immunohistochemistry analysis
SK-MEL-2 cells were lysed in a lysis buffer from iNtRON (Seoul, Korea), and protein concentration was determined using a BCA protein assay kit (Pierce Chemical, Rockford, IL), according to the manufacturer’s protocol. Equal amounts of total protein were resolved using SDS-polyacrylamide gel electrophoresis and transferred to Immobilon NC membranes (Millipore, Billerica, MA). Blots were blocked with 5% (w/v) non-fat dried milk and 0.1% (v/v) Tween 20 and were incubated overnight at 4 °C with primary antibody. Western blot analysis was performed with the following antibodies: tyrosinase (Santa Cruz Biotechnology, CA), MITF (Abcam, Cambridge, UK) and β-actin (Sigma-Aldrich, St. Louis, MO). Blots were washed and incubated with horseradish peroxidase-conjugated anti-rabbit IgG secondary antibody (Invitrogen). Specific antigen-antibody complexes were detected using enhanced chemiluminescence (PerkinElmer Life Sciences, MA). For immunohistochemistry, cultured SK-MEL-2 cells on a standard microscope slide were incubated with 4% (wt/vol) paraformaldehyde in PBS (pH 7.4). Slides were quenched in hydrogen peroxide (0.3–3.0%) to block endogenous peroxidase activity and then washed in an automation buffer (Biomeda, Foster City, CA). Slides were blocked in 5% normal serum for 1 h at room temperature and then incubated overnight at 4 °C or for 1 h at room temperature with the primary anti-melanosome (DAKO Corp., Carpinteria, CA). Slides were then probed with HRP-conjugated secondary antibodies for 30 min. Anti-rabbit secondary antibodies from DakoCytomation EnVision detection system (Carpinteria, CA) were used for detection. The immune complexes were detected by incubating with a HRP substrate 3,3′-diaminobenzidine (DAB). Slides were dehydrated sequentially in ethanol, cleared with xylene and mounted with Permount. The stained tissues were magnified (×200) using a Leica DEF 280 microscope and photographed.
Immunofluorescence assay
Complementary DNA for human full-length RAB27A, a member of the RAS oncogene family, was cloned into pCNS vectors (NM 183235) purchased from 21C Frontier Human Gene Bank (21C Frontier Human Gene Bank, Daejeon, Korea). SK-MEL-2 cells were seeded at 5 × 10⁴ cells/well in an 8-well chamber slide. After 24 h, the cells were transfected using the Hilymax transfection reagent (Dojindo, Kumamoto, Japan) with pCNS-RAB27A for 24 h. After transfection, cells were treated with 14.67 μg/mL S. flavescens extract, 1.97 μg/mL G. uralensis extract and 4.41 μg/mL kurarinone for 6 h. Cells were washed twice with PBS and fixed with 4% (v/v) formaldehyde for 15 min. Cells were then permeabilized with cell permeabilization reagents (Invitrogen) and blocked with 3% (w/v) bovine serum albumin (BSA) for 1 h. Cells were incubated in primary antibody (RAB27A, Abcam) diluted to 1:100 in 3% (w/v) BSA overnight at 4 °C. After washing three times for 5 min with PBS, cells were incubated in the dark for 1 h with FITC-anti mouse secondary antibody (Invitrogen) diluted to 1:200 in 3% (w/v) BSA. Coverslips were washed with PBS and mounted. Images were obtained using a laser-scanning confocal microscope (LSM 710; Carl Zeiss, Germany) equipped with a C-Apochromat ×40/1.2 water immersion lens (488 nm argon laser/505–550 nm detection range). For co-cultures, SK-MEL-2 melanoma and HaCaT keratinocyte cell lines were seeded at 5 × 10⁴ and 3 × 10⁸ cells/well in an 8-well chamber slide, respectively. The seeding ratio of the cell line co-culture was 1:20. After 24 h, co-cultures were treated with or without 160 ng/mL α-MSH for 6 h. Next, the cells were treated (GI50 concentration) with S. flavescens extract, G. uralensis extract and kurarinone for 6 h later and double immunofluorescence stained overnight at 4 °C using anti-tyrosinase (1:50; Santa Cruz Biotechnology) and anti-cytokeratin (1:50; DAKO Corp.). The primary antibodies were visualized after appropriate washing with PBS, using the following secondary antibodies: rabbit anti-goat IgG (Alexa Fluor® 488; Invitrogen) (1:200 in PBS), goat anti-mouse IgG (Alexa Fluor® 568; Invitrogen) (1:200 in PBS).
Clinical evaluation of a 0.05% S. flavescens lotion
The clinical trials were performed in a randomized, double-blind and vehicle-controlled study. Twenty-five subjects between 21 and 53 years old were selected and the minimal erythemal dose (MED) of individual subjects was determined (Tejasvi et al., Citation2007). After determination of MED, UVB irradiation on each of three consecutive days with 0.7 MED was performed on the upper arm of the subjects using a solar UV simulator (Oriel Instrument, Irvine, CA). Three days after irradiation, subjects applied 0.05% S. flavescens lotion and vehicle (without 0.05% S. flavescens) on their respective sites twice a day (in the morning and evening) for 8 weeks. During this period, the subjects were evaluated using visual assessment by experts. Subjects were also measured for whitening effects using a chromameter CR-400 at 0, 4, 6 and 8 weeks. Safety of the subjects was monitored by visual examination for local cutaneous side effects such as erythema, edema, scaling, itching, stinging, burning, tightness and prickling. In addition, a completed questionnaire to assess their satisfaction with the treatment was completed at 4, 6 and 8 weeks. The study was externally monitored by Ellead Skin Research Center (Seongnam, Gyeonggi-Do, Korea) (http://www.ellead.com) and was conducted in accordance with the International Committee of Harmonisation (ICH) guidelines for Good Clinical Practice (GCP).
Statistical analysis
The results obtained were expressed as the mean ± standard deviation (SD) from at least three independent experiments. The data were analyzed using Student’s t-test. p Values less than 0.05 were considered statistically significant.
Results
IC50 and GI50 concentrations of S. flavescens extract, kurarinone, G. uralensis extract and arbutin
The 50% inhibitory concentration (IC50) values of S. flavescens extract, kurarinone, G. uralensis extract and arbutin were evaluated using an in vitro tyrosinase inhibition assay and were found to be 10.4, 3.59, 0.31 and 82 μg/mL, respectively (Supplementary Figure S1). We also performed a cytotoxicity test to calculate the 50% of growth inhibition (GI50) concentration using an MTT assay to determine the challenging dose for DNA microarray analysis. After a 24-h incubation, we found that the concentrations of S. flavescens extract, kurarinone, G. uralensis extract and arbutin required 14.67, 4.41, 1.97 and 1005.07 μg/mL, respectively, to achieve GI50 (Supplementary Figure S2).
Identification of differential gene expression by S. flavescens extract, kurarinone, G. uralensis extract and arbutin in HaCaT keratinocyte cells
To identify the potential genes involved in the skin-whitening effects, we performed microarray analysis of gene expression in HaCaT keratinocyte cells upon treatment with S. flavescens extract. Among the 41000 unique genes (using Agilent’s Human GE 4x44K Microarray) tested, 27 821 genes were identified as differentially expressed in S. flavescens extract, kurarinone, G. uralensis extract and arbutin compared with the DMSO-treated control (Supplementary Table S1). These genes were selected because they were altered on a two-fold cutoff value in at least one of four samples (two extracts and two compounds). In the line graph from the microarray analysis, gene expression patterns of the three groups (S. flavescens extract, kurarinone and G. uralensis extract) were not significantly different compared with that of arbutin (Supplementary Figure S3). Inspection of these genes in a four-group hierarchical gene cluster showed scattered expression characterized by several distinct patterns, including up- or downregulation, as two clusters (Supplementary Figure S4). It is possible that the inhibitory mechanisms of the three samples may have been different from those of arbutin.
The genes up- or down-regulated by more than twofold (p < 0.05) in replicated microarray experiments were significantly handled in data mining categories. Among 27 821 genes, 6017, 5803 and 4998 genes were upregulated by S. flavescens extract, G. uralensis extract and kurarinone treatment at 6 h, respectively. Conversely, these treatments downregulated 61, 74 and 57 genes, respectively. We performed gene ontology and pathway analysis using the DAVID program (http://david.abcc.ncifcrf.gov) and targeted genes that were up- or down-regulated by more than twofold by S. flavescens extract-simulated HaCaT cells. The overexpressed genes were found to be related to various signal transduction pathways, including apoptosis, cell growth, angiogenesis, ectoderm development and hormone secretion. The significantly down-regulated genes were also related to various signal transduction pathways, including the formation and transport of melanosomes, proteolysis, epidermis development, activation of MAPK activity, inflammatory response and others (data not shown).
To compare our results upon treatment with the S. flavescens extract with potential genes that are involved in the formation and transport of melanosomes, we identified candidate genes in the GeneCards gene database (http://www.genecards.org/). We then independently evaluated the association between the formation and transport of melanosomes and genes that had a greater than twofold change in at least one sample. The results of this analysis are illustrated schematically as Venn diagrams in Supplementary Figure S5. These candidate gene lists are provided in Supplementary Table S2. These data mining tools showed that the transcription regulatory gene, MITF, a regulating factor at the transcription level during pigmentation, was down-regulated by S. flavescens extract, G. uralensis extract and kurarinone. The melanosome transporter genes, RAB27A and PAR2 (Sakuraba et al., Citation2004), and dendrite formation mediated gene, RAC1, were down-regulated on treatment with S. flavescens extract, G. uralensis extract and kurarinone (Supplementary Table S2). Because these genes are involved in the regulation of skin pigmentation, we selected them for further analysis of the whitening effect of S. flavescens extract.
Inhibitory effect of S. flavescens extract, G. uralensis extract and kurarinone on expression of MITF, PAR2 and RAC1 genes in the HaCaT cells
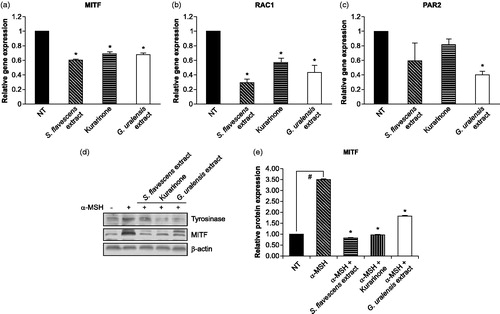
Three genes, MITF, RAC1 and PAR2, known to regulate melanosome formation and pigmentation were selected for further analysis by real-time PCR (). Results show that compared with the untreated control (0.1% DMSO), S. flavescens extract significantly decreased MITF and PAR2 expression by 42 and 43%, whereas G. uralensis extract and kurarinone decreased the expressions by 33 and 59% and 25 and 13%, respectively. Further, S. flavescens extract, G. uralensis extract and kurarinone down-regulated RAC1 expression by 73, 62 and 49%, respectively. Therefore, MITF, RAC1 and PAR2 genes were downregulated by S. flavescens, G. uralensis extract and kurarinone. Thus, these results indicate that S. flavescens, G. uralensis extract and kurarinone inhibits the expression of MITF, RAC1 and PAR2, resulting in a reduction of melanin pigment in the epidermis. Furthermore, the S. flavescens extract inhibited expression of MITF and RAC1 more than G. uralensis extract and kurarinone, suggesting that it is more effective as a natural skin-whitening agent.
Figure 1. Effects of S. flavescens extract on mRNA and protein expressions of melanosome formation and pigmentation-related genes in keratinocyte and melanoma cell lines. S. flavescens extract, G. uralensis extract and kurarinone regulate the expressions of MITF (a), RAC1 (b) and PAR2 (F2RL1) (c) genes, and MITF protein expression (d and e). (a–c) HaCaT keratinocyte cell lines were treated (GI50 concentration) with S. flavescens extract, G. uralensis extract and kurarinone for 6 h. The levels of related gene expression were determined by real-time PCR analysis. (d and e) SK-MEL-2 melanoma cell lines were treated with or without 160 ng/mL α-MSH for 6 h, and then cells were treated with S. flavescens extract, G. uralensis extract and kurarinone for 6 h. (d) The levels of tyrosinase and MITF expression were determined by western blot analysis. β-actin was used as an internal control for relative quantitation. (e) The S. flavescens extract decreased the level (approx. threefold) of α-MSH-induced MITF expression. Values are mean ± SD from three independent experiments. #p < 0.01 versus DMSO alone-treated group (NT). *p < 0.01 versus α-MSH alone-treated group.
Inhibitory effect of S. flavescens extract, G. uralensis extract and kurarinone on tyrosinase and MITF proteins in SK-MEL-2 melanoma cells
Western blot analysis was performed to determine the expression level of tyrosinase and MITF proteins in SK-MEL-2 cells treated either α-MSH alone or α-MSH plus S. flavescens extract, G. uralensis extract and kurarinone for 6 h. α-MSH, which is known to induce tyrosinase and MITF gene transcription (Bertolotto et al., Citation1998; Fuller et al., Citation1987), induced MITF expression in SK-MEL-2 cells ().
Tyrosinase protein expression was slightly induced by α-MSH alone; however, its expression was decreased in cells treated with α-MSH and kurarinone or G. uralensis extract. This inhibitory effect was more apparent in cells treated with α-MSH and S. flavescens extract (). In addition, MITF protein expression was strongly induced by α-MSH alone, but decreased in cells treated with S. flavescens extract and kurarinone (approx. three-fold) (). This result clearly demonstrates that the S. flavescens extract may inhibit melanin biosynthesis and melanosome formation by regulating the expression of MITF.
Effect of S. flavescens extract and kurarinone on the inhibition of melanosome formation in SK-MEL-2 cells
To confirm the hypopigmentation activity effect of the S. flavescens extract, SK-MEL-2 cells were treated with either α-MSH alone or α-MSH plus S. flavescens extract, G. uralensis extract and kurarinone for 6 h. Cells were then analyzed using immunohistochemistry. As shown in Supplementary Figure S6b--c, S. flavescens extract and kurarinone had a strong inhibitory effect in a number of melanosomes compared with the α-MSH stimulation, while G. uralensis extract had no significant inhibitory effect (Supplementary Figure S6d). This result suggests that the S. flavescens extract might have inhibited melanosome formation.
Inhibitory effect of S. flavescens extract and kurarinone on RAB27A protein in the SK-MEL-2 cells
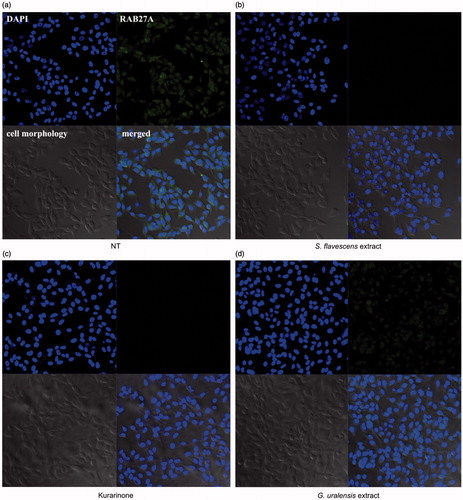
RAB27A is a major regulator in melanosome transfer to melanocyte dendrites, which is a process that induces skin pigmentation (Bahadoran et al., Citation2001). Therefore, the inhibition of RAB27A may result in a reduction in skin pigmentation. We performed immunofluorescence analysis on SK-MEL-2 cells transfected with pCNS-RAB27A. As shown in , S. flavescens extract and kurarinone had a strong inhibitory effect on RAB27A protein expression compared with the DMSO-treated control, whereas G. uralensis extract showed no significant inhibitory effect (). These results suggest that the S. flavescens extract may have inhibited melanosome transport.
Figure 2. Effects of S. flavescens extract on RAB27A expression in melanoma cell lines. S. flavescens extract and kurarinone regulate expression of RAB27A. SK-MEL-2 melanoma cell lines were transfected with pCNS-RAB27A for 24 h. After transfection, cells were treated with S. flavescens extract, G. uralensis extract and kurarinone for 6 h. (a) The 0.1% DMSO control shows normal distribution of RAB27A. However, levels of RAB27A were reduced by the S. flavescens extract and kurarinone (b, c), whereas higher levels of RAB27A were observed in the cells treated with G. uralensis extract (d).
Inhibitory effect of S. flavescens extract and kurarinone on melanosome transfer in a co-culture of melanocytes and keratinocytes
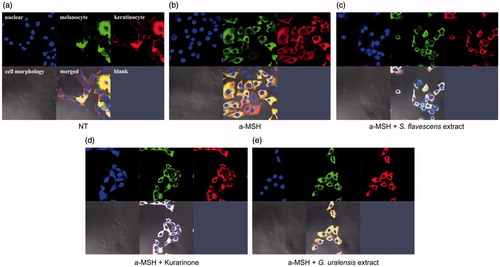
To evaluate the inhibition of melanosome transport by S. flavescens extract, we performed double-immunofluorescence staining using anti-tyrosinase antibody (green) to detect melanosomes and anti-cytokeratin antibody (red) to detect keratinocytes in co-cultures. Co-cultures of SK-MEL-2 and HaCaT cells were treated with or without α-MSH alone or α-MSH plus S. flavescens extract, G. uralensis extract, and kurarinone for 6 h. The anti-tyrosinase image was merged with the red fluorescence signal emitted by keratinocytes, which shows the degree of melanosome transfer (yellow). As shown in , S. flavescens extract- and kurarinone-treated cells had a yellow fluorescence signal with less intensity than the control, suggesting a decrease in melanosome transfer. Therefore, they had a strong inhibitory effect on the melanosome transport compared with α-MSH stimulation (). In contrast, G. uralensis extract showed no significant inhibitory effect (). This means that the G. uralensis extract in the presence of α-MSH did not modify melanosome transfer from melanocytes to keratinocytes. These results suggest that the S. flavescens extract has the potential to be further developed into an effective skin-whitening agent.
Figure 3. Effects of S. flavescens extract on melanosome transfer in co-cultures of melanoma and keratinocyte cell lines. S. flavescens extract and kurarinone regulate melanosome transfer in co-cultures of SK-MEL-2 melanoma and HaCaT keratinocyte cell lines. Co-cultures were treated with or without α-MSH for 6 h, and then treated with S. flavescens extract, G. uralensis extract and kurarinone for 6 h. Double-immunofluorescence staining using anti-tyrosinase (green) to detect melanosomes and anti-cytokeratin (red) to detect keratinocytes was performed. The anti-tyrosinase image was merged with the red fluorescence signals emitted by keratinocytes, and shows the degree of melanosome transfer (yellow). (a, b) Degree of melanosome transfer in the absence or presence of α-MSH. (c, d) The degree of melanosome transfer is reduced in cells treated with S. flavescens extract and kurarinone, whereas those treated with G. uralensis extract had increased melanosome transfer (e).
Whitening effect of S. flavescens extract in clinical evaluations
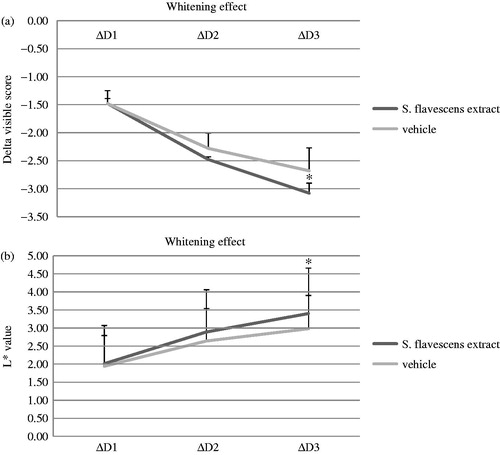
To identify the whitening efficacy of S. flavescens extract on human skin, we performed a double-blind study in 25 subjects for 8 weeks. As shown in , the clinical efficacy after use of the formulation containing 0.05% S. flavescens extract for 8 weeks showed that subjects had a significant effect in skin whitening compared with vehicle, as determined by visual assessment by dermatologists and chromameter measurement. Visual assessment by dermatologists was significantly (p < 0.05) lower in subjects treated with 0.05% S. flavescens extract at 8 week (n = 25) compared with the vehicle (control group, n = 25). The value of visual assessment indicates brightness ranging from white (visible score = 0) to black (visible score = 7) (). Next, compared with the control group (n = 25), the L* value was significantly (p < 0.05) higher in subjects treated with 0.05% S. flavescens extract at 8 weeks (n = 25). The L* value indicates brightness ranging from black (L* = 0) to white (L* = 100) (). We also investigated the side effects of S. flavescens extract on human skin; no side effects were observed during the clinical trial (data not shown). These results suggest that the S. flavescens extract might have a whitening effect on human skin and can be used as a natural agent for skin whitening.
Figure 4. The whitening effects of S. flavescens extract in human skin. Whitening effect of the formulation containing 0.05% S. flavescens extract on UVB-induced skin pigmentation. Three days after irradiation, subjects applied 0.05% S. flavescens lotion and vehicle (without 0.05% S. flavescens) on their respective sites twice a day (in the morning and evening) for 8 weeks. For a period of 8 weeks, the subjects were evaluated through visual assessment by experts and measured using a chromameter CR-400 for measuring the whitening effect at 0, 4, 6 and 8 weeks. The clinical efficacy evaluation after the use of the formulation containing 0.05% S. flavescens extract for 8 weeks showed that there was a significant effect on skin whitening compared with vehicle by visual assessment by a dermatologist (a) and chromameter measurement (b). The value of visual assessment indicates brightness ranging from white (visible score = 0) to black (visible score = 7). The L* value indicates brightness ranging from black (L* = 0) to white (L* = 100). X-axis index: ΔD1, 4-week (W) - 0W; ΔD2, 6W - 0W; and ΔD3, 8W - 0W.
Discussion
Skin color is determined by melanin biosynthesis in melanocytes and the subsequent transfer of melanin to neighboring keratinocytes. Therefore, skin color whitening can be achieved by inhibiting either the pathway by which melanin is synthesized in the melanocytes or the pathway responsible for the transfer of melanin to the surrounding keratinocytes (Koo et al., Citation2010).
We conducted this study to determine if the S. flavescens extract can be used as a whitening cosmetic agent. To accomplish our goals, we evaluated the whitening effect of S. flavescens extract by altered expression in HaCaT keratinocyte cells and the inhibitory effect of melanosome transport on α-MSH-treated SK-MEL-2 melanoma cells. Finally, the skin-whitening effect of S. flavescens extract was analyzed on human skin.
To investigate gene expression profiles for the mechanism of action of the S. flavescens extract, we utilized DNA microarrays. In the microarray analysis, many changes in gene expression were observed (the detailed gene expression profiles obtained using the microarray are shown in additional file Supplementary Table S1). Gene ontology and pathway analysis were performed to understand the action of S. flavescens extract. The altered genes (<two-fold) in S. flavescens extract were related to the formation and transport of melanosomes (data not shown). Therefore, we obtained consistent results, which allowed us to identify the genes involved in the formation and transport of melanosomes (Supplementary Figure S5). These candidate gene lists are provided in Supplementary Table S2. The microarray analysis revealed that arbutin was significantly different compared with the three groups (S. flavescens extract, kurarinone and G. uralensis extract) (Supplementary Figures S3 and S4). Because it is possible that the actions of the three samples may have been different from the inhibitory mechanism of arbutin, validation of the microarray experiments was performed. The candidate genes MITF, RAC1, RAB27A and PAR2 selected in this study were downregulated by S. flavescens extract, G. uralensis extract and kurarinone ().
As shown in , the MITF protein increased more than threefold upon treatment with α-MSH. The anti-melanogenic activity of S. flavescens extract was clearly demonstrated by the reduction of MITF expression to the level of untreated control. G. uralensis extract and kurarinone also induced significant reduction of MITF expression. S. flavescens extract had a stronger inhibitory effect on the expression of MITF than G. uralensis extract under these experimental conditions. MITF is implicated as the master gene for survival of melanocytes, as well as a key transcription factor regulating the expression of major melanogenic proteins such as tyrosinase and the tyrosinase-related proteins (TRP-1 and -2) (Gillbro & Olsson, Citation2011; Goding, Citation2000; Park & Gilchrest, Citation2002). However, the inhibitory effect of S. flavescens extract, G. uralensis extract and kurarinone on expression of tyrosinase was mild (). Thus, we focused on the inhibitory effect of S. flavescens extract on the formation and transport of melanosomes in melanocytes.
In melanocytes, RAC1 mediates dendrite formation in response to melanocyte-stimulating hormone and ultraviolet light (Scott, Citation2002; Scott & Cassidy, Citation1998). The active form of RAC1 promotes dendrite and lamellipodium formation (Ito et al., Citation2006; Kim et al., Citation2010). Dendrites are critically important for efficient melanosome transfer, because one melanocyte makes contact with numerous keratinocytes in the epidermis through dendrite cell processes (Scott & Cassidy, Citation1998). The S. flavescens extract exhibited a lower expression of RAC1 than G. uralensis extract and kurarinone (). In addition, in the presence of α-MSH, S. flavescens extract and kurarinone reduced the number of melanosomes, resulting in the inhibition of melanosome formation, whereas G. uralensis extract had a mild inhibitory effect (Supplementary Figure S6).
Maturing melanosomes, through the activity of MITF transported to the tips of melanocyte dendrites, associate with RAB27A-MLPH-MYO5A complex and RAC1. The RAB27A-MLPH-MYO5A complex promotes the association of melanosomes with cortical actin within the dendrites of melanocytes, promoting their detachment from microtubules and positioning them close to the plasma membrane (Wasmeier et al., Citation2008). RAB27A, like the tubulin and actin-dependent motor proteins, is essential for melanosome transport to dendrite tips in human melanocytes (Bahadoran et al., Citation2001). Melanosomes pass from the dendrites of melanocytes to neighboring keratinocytes in a process that involves exocytosis of melanin cores from melanocytes followed by their phagocytic uptake into keratinocytes. Keratinocyte cell surface receptors, including the proteinase-activated receptor PAR2, have been identified as possible regulators of melanosome internalization (Boissy, Citation2003; Wasmeier et al., Citation2008). PAR2 is expressed in keratinocyte, not melanocytes. Stimulation of this receptor enhances the phagocytosis rate of keratinocytes and leads to increased melanin transfer, which has been proven in vitro as well as in vivo (Van Den Bossche et al., Citation2006). The levels of MITF, RAC1 and PAR2 mRNAs were down-regulated on treatment with S. flavescens extract (). In addition, S. flavescens extract and kurarinone showed a strong inhibitory effect on the expression of the RAB27A protein compared with the DMSO-treated control, whereas G. uralensis extract showed no significant inhibitory effect. This result suggests that the S. flavescens extract might have inhibited melanosome transport. Melanosome transport whereby melanosomes pass from the dendrites of melanocytes to neighboring keratinocytes is generally evaluated using in vitro co-culture systems (Berens et al., Citation2005; Minwalla et al., Citation2001; Virador et al., Citation2002). Our co-culture studies revealed that S. flavescens extract in the presence of α-MSH showed a significant inhibitory effect on melanosome transfer compared with the α-MSH stimulation, whereas G. uralensis extract showed no significant inhibitory effect. Therefore, we demonstrated that S. flavescens extract exerts a pigment-whitening effect by inhibiting the melanosome transfer from melanocytes to keratinocytes.
Use of a formulation containing 0.05% S. flavescens extract for 8 weeks showed that it had a significant effect on skin whitening compared with vehicle, as determined by visual assessment of dermatologists and chromameter measurement, suggesting that it is an effective hypopigmentation agent. In conclusion, the results of this study suggest that the S. flavescens extract might have a whitening effect on human skin and can be used as a natural agent for skin whitening.
Declaration of interest
This study was partially supported by grants of the Korea Healthcare technology R&D Project, Ministry of Health & Welfare, Republic of Korea (Grant No.: A103017), and the Research of Aging Regulation by the Energy Metabolisms, Korea Institute of Oriental Medicine (KIOM), Republic of Korea (Grant No.: K12101). None of the authors has any potential conflict of interest.
Supplementary Material
Download PDF (459 KB)Supplementary Material
Download MS Excel (15.6 MB)References
- Bahadoran P, Aberdam E, Mantoux F, et al. (2001). Rab27a: A key to melanosome transport in human melanocytes. J Cell Biol 152:843–50
- Berens W, Van Den Bossche K, Yoon TJ, et al. (2005). Different approaches for assaying melanosome transfer. Pigment Cell Res 18:370–81
- Bertolotto C, Abbe P, Hemesath TJ, et al. (1998). Microphthalmia gene product as a signal transducer in cAMP-induced differentiation of melanocytes. J Cell Biol 142:827–35
- Boissy RE. (2003). Melanosome transfer to and translocation in the keratinocyte. Exp Dermatol 12:5–12
- Cardinali G, Bolasco G, Aspite N, et al. (2008). Melanosome transfer promoted by keratinocyte growth factor in light and dark skin-derived keratinocytes. J Invest Dermatol 128:558–67
- Fuller BB, Lunsford JB, Iman DS. (1987). Alpha-melanocyte-stimulating hormone regulation of tyrosinase in Cloudman S-91 mouse melanoma cell cultures. J Biol Chem 262:4024–33
- Gillbro JM, Olsson MJ. (2011). The melanogenesis and mechanisms of skin-lightening agents-existing and new approaches. Int J Cosmet Sci 33:210–21
- Goding CR. (2000). Mitf from neural crest to melanoma: Signal transduction and transcription in the melanocyte lineage. Genes Dev 14:1712–18
- Hyun SK, Lee WH, Jeong da M, et al. (2008). Inhibitory effects of kurarinol, kuraridinol, and trifolirhizin from Sophora flavescens on tyrosinase and melanin synthesis. Biol Pharm Bull 31:154–8
- Ito Y, Kanamaru A, Tada A. (2006). Centaureidin promotes dendrite retraction of melanocytes by activating Rho. Biochim Biophys Acta 1760:487–94
- Jung GD, Yang JY, Song ES, Par JW. (2001). Stimulation of melanogenesis by glycyrrhizin in B16 melanoma cells. Exp Mol Med 33:131–5
- Kim HJ, Seo SH, Lee BG, Lee YS. (2005). Identification of tyrosinase inhibitors from Glycyrrhiza uralensis. Planta Med 71:785–7
- Kim MY, Choi TY, Kim JH, et al. (2010). MKK6 increases the melanocyte dendricity through the regulation of Rho family GTPases. J Dermatol Sci 60:114–19
- Kim SJ, Son KH, Chang HW, et al. (2003). Tyrosinase inhibitory prenylated flavonoids from Sophora flavescens. Biol Pharm Bull 26:1348–50
- Kim YJ, Uyama H. (2005). Tyrosinase inhibitors from natural and synthetic sources: Structure, inhibition mechanism and perspective for the future. Cell Mol Life Sci 62:1707–23
- Koo JH, Lee I, Yun SK, et al. (2010). Saponified evening primrose oil reduces melanogenesis in B16 melanoma cells and reduces UV-induced skin pigmentation in humans. Lipids 45:401–7
- Lee SH, Choi SY, Kim H, et al. (2002). Mulberroside F isolated from the leaves of Morus alba inhibits melanin biosynthesis. Biol Pharm Bull 25:1045–8
- Minwalla L, Zhao Y, Cornelius J, et al. (2001). Inhibition of melanosome transfer from melanocytes to keratinocytes by lectins and neoglycoproteins in an in vitro model system. Pigment Cell Res 14:185–94
- No JK, Soung DY, Kim YJ, et al. (1999). Inhibition of tyrosinase by green tea components. Life Sci 65:PL241–6
- Park HY, Gilchrest BA. (2002). More on MITF. J Invest Dermatol 119:1218–19
- Ryu SY, Lee HS, Kim YK, Kim SH. (1997). Determination of isoprenyl and lavandulyl positions of flavonoids from Sophora flavescens by NMR experiment. Arch Pharm Res 20:491–5
- Ryu YB, Westwood IM, Kang NS, et al. (2008). Kurarinol, tyrosinase inhibitor isolated from the root of Sophora flavescens. Phytomedicine 15:612–18
- Sakuraba K, Hayashi N, Kawashima M, Imokawa G. (2004). Down-regulated PAR-2 is associated in part with interrupted melanosome transfer in pigmented basal cell epithelioma. Pigment Cell Res 17:371–8
- Scott G. (2002). Rac and rho: The story behind melanocyte dendrite formation. Pigment Cell Res 15:322–30
- Scott GA, Cassidy L. (1998). Rac1 mediates dendrite formation in response to melanocytes stimulating hormone and ultraviolet light in a murine melanoma model. J Invest Dermatol 111:243–50
- Son JK, Park JS, Kim JA, et al. (2003). Prenylated flavonoids from the roots of Sophora flavescens with tyrosinase inhibitory activity. Planta Med 69:559–61
- Tejasvi T, Sharma VK, Kaur J. (2007). Determination of minimal erythemal dose for narrow band-ultraviolet B radiation in north Indian patients: Comparison of visual and Dermaspectrometer readings. Indian J Dermatol Venereol Leprol 73:97–9
- Van Den Bossche K, Naeyaert JM, Lambert J. (2006). The quest for the mechanism of melanin transfer. Traffic 7:769–78
- Virador VM, Muller J, Wu X, et al. (2002). Influence of alpha-melanocyte-stimulating hormone and ultraviolet radiation on the transfer of melanosomes to keratinocytes. FASEB J 16:105–7
- Wasmeier C, Hume AN, Bolasco G, Seabra MC. (2008). Melanosomes at a glance. J Cell Sci 121:3995–9