
Abstract
Context: Isoliquiritigenin (ISL) has been shown to exhibit a variety of biological activities. However, there is little research on the pharmacokinetic behavior and tissues distribution of ISL.
Objective: Pharmacokinetics, biodistribution and bioavailability of ISL after intravenous and oral administration were determined by systematic investigation in Sprague–Dawley rats.
Materials and methods: ISL was dissolved in medicinal ethanol-Tween 80–0.9% sodium chloride saline in a volume ratio of 10:15:75. The ISL solution was injected in rats via a tail vein at a single dose of 10, 20 and 50 mg/kg and administered orally in rats at a single dose of 20, 50 and 100 mg/kg, respectively. Blood samples were collected at time intervals of 0.08, 0.25, 0.5, 0.75, 1, 1.5, 2, 3, 6, 8 and 12 h after intravenous injection. Tissues of interests in mice were collected immediately at each determined time point (0.5, 1, 2, 3 and 6 h) after cervical dislocation.
Results: The dose-normalized AUC values were 7.3, 7.6 and 8.7 μg × h/ml (calculated based on the dose of 10 mg/kg) for intravenous doses of 10, 20 and 50 mg/kg, respectively. The elimination half-lifes (t1/2λ) were 4.9, 4.6 and 4.8 h at 10, 20 and 50 mg/kg intravenous doses, respectively. The F values were 29.86, 22.70, 33.62% for oral doses of 20, 50 and 100 mg/kg, respectively. Liver, heart and kidney were major distribution tissues of ISL in mice. The plasma protein binding of ISL in rats was 43.72%.
Conclusion: The work may useful for further study of the bioactive mechanism of ISL.
Introduction
Isoliquiritigenin (ISL), a flavonoid with chalcone structure (2,4,4′-trihydroxychalcone), which exists in licorice and in vegetables including shallots and bean sprouts (Cao et al., Citation2004; Ii et al., Citation2004; Kape et al., Citation1992), has been shown to exhibit a variety of biological activities, including antioxidant (Chin et al., Citation2007; Haraguchi et al., Citation1998), antiinflammatory (Kim et al., Citation2008), estrogenic properties (Tamir et al., Citation2001), analgesic (Chan et al., Citation1998; Morteza et al., Citation2004), cytoprotective effects (Kim et al., Citation2004), antiplatelet aggregation (Chisato et al., Citation2008; Tawata et al., Citation1992), antipeptic ulcer actions (Kim et al., Citation2006), chemopreventive agent (Hsu et al., Citation2005a), antiangiogenic effect (Kobayashi et al., Citation1995), radical-scavenging activity (Yamamoto et al., Citation1991) and antitumor activities (Baba et al., Citation2002; Iwashita et al., Citation2000; Jung et al., Citation2006b; Kanazawa et al., Citation2003; Ma et al., Citation2001; Maggiolini et al., Citation2002; Takahashi et al., Citation2004; Yamazaki et al., Citation2002). In particular, ISL can suppress proliferation of many types of cancer cells and induce their apoptosis, including HL-60 human promyelocytic cell line (Chowdhury et al., Citation2005), colon cancer cells (Takahashi et al., Citation2004), gastric cancer cells (Ma et al., Citation2001), breast cancer cells (Maggiolini et al., Citation2002), human prostate cancer (Jung et al., Citation2006a,b) and human hepatoma cells (Hsu et al., Citation2005b). ISL suppresses pulmonary metastasis of mouse renal cell carcinoma (Yamazaki et al., Citation2002). With the growing of its potential role, there is an increasing demand for systematically evaluating its pharmacokinetic behavior and tissue distribution for a better understanding of the mechanism of its action and facilitating further research. Little is known regarding the pharmacokinetics, metabolism and tissue distribution of ISL. Much of the research to date on ISL has focused more on the potential therapeutic use and not on the pharmacokinetics and distribution of ISL. Only in our previous work, pharmacokinetics of ISL in rats at a single dose of 10 mg/kg was studied with an HPLC method after intravenous administration of ISL (Zhang et al., Citation2009). To date, there are no research reports on the pharmacokinetic behavior and tissues distribution of ISL after oral administration of ISL. Therefore, it is necessary for an intensive investigation on pharmacokinetics and tissues distribution of ISL. This work helps fill some of the gaps in overall knowledge of ISL. The main purpose of this study is to report the detailed pharmacokinetics of ISL after intravenous administration at doses of 10, 20 and 50 mg/kg and oral administration at doses of 20, 50 and 100 mg/kg in rats, and the tissue distribution after intravenous and intragastric administration at a dose of 20 mg/kg in mice. Plasma protein binding rate was also investigated. Sprague–Dawley (SD) rats and Kunming mice were chosen for this work because they are standard species used in preclinical pharmacokinetics and tissue distribution studies.
Materials and methods
Materials
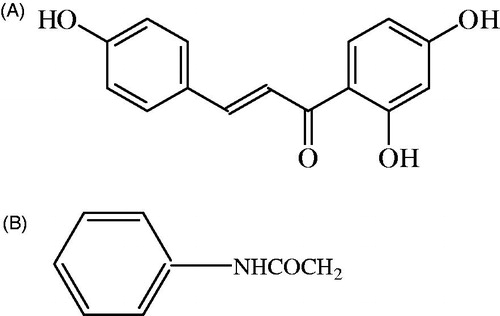
Isoliquiritigenin (ISL, 99.0% purity) was purchased from Shanghai Bangcheng Chemical Co. (Shanghai, China). Acetanilide (ACE) was obtained from the National Institute for the Control of Pharmaceutical and Biological Products (Beijing, China) and used as an internal standard (IS). The molecular structure of ISL and ACE are shown in . HPLC grade methanol and acetonitrile were obtained from Shandong Yuwang (Shandong, China). HPLC grade water was provided by the first hospital of Lanzhou University. Sodium chloride (analytical grade) was purchased from Beijing Beihua Fine Chemicals Company, Limited (Beijing, China). Other commercial reagents and solvents were of analytical grade.
Figure 1. Molecular structures of isoliquiritigenin (A) and acetanilide (B).
HPLC analysis
Plasma concentrations of ISL in rat were measured using a HPLC method previously reported by Zhang et al. (Citation2009). The HPLC system was performed on an Agilent 1200 HPLC (Boeblingen, Germany) system consisting of G1322A Vacuum Degasser, G1311A Quat Gradient Pump, G1316A Thermostatted Column Compartment, G1329A Autosampler, G1315B Diode Array Detector and LC 3D instrument Chem Station. Chromatographic separation was achieved on a YMC-packed ODS-A C18 column, 150 mm × 4.6 mm, 5 µm (YMC Co. Ltd., Kyoto, Japan) preceded by an Agilent Zorbax Reliance Cartridge guard column (Eclipse XDB-C18, 12.5 mm × 4.6 mm, 5-Micron). The mobile phase was composed of acetonitrile, 0.05 mol/l potassium dihydrogen phosphate and triethylamine in a volume ratio of 50:50:0.5. The pH of the mobile phase was adjusted to 2.00 with 85% phosphoric acid. Prior to use, the mobile phase was filtered through a 0.45-μm hydrophilic membrane filter. Detection wavelength was set at 242 nm while reference wavelength was set at 360 nm from 0 to 5 min, and 360 and 700 nm from 5 to 9 min, respectively. The mobile phase was delivered at a flow rate of 1.0 ml/min. The temperature of the thermostated oven containing the column was set at 30 °C and the injection volume was 50 μl.
Analytical method validation
Following the bioanalytical method validation (FDA, Citation2001), the analytical method in mice plasma and tissues was validated to demonstrate the specificity, recovery, linearity, accuracy and precision of measurements and stability of samples. Analytical method of ISL in rat plasma was reported in our previous research (Zhang et al., Citation2009).
Specificity was established by the lack of interference peaks at the retention time for ISL and the internal standard.
Recovery was determined by comparing the mean peak area obtained from either the extracted plasma or tissue samples with the peak area obtained by the direct injection of the corresponding spiked standard solutions. Different concentrations of ISL (0.038, 0.625, 1.25, 5 and 20 μg/ml in plasma and 0.019, 0.156, 0.313 and 2.5 μg/g in tissue samples) were measured.
Linearity was tested covering a range of 0.019–30 μg/ml in plasma and 0.009–5 μg/g in tissue samples. The calibration curves were established by plotting the peak area ratio of ISL to internal standards versus the ISL concentration. The regression parameters of the slope, intercept and correlation coefficient were calculated by linear least-squares regression.
Accuracy and precision were determined in six replicates of 0.038, 0.625, 1.25, 5 and 20 μg/ml of ISL in blank mice plasma and 0.019, 0.156, 0.313 and 2.5 μg/g in blank tissue samples, which were prepared and analyzed on three consecutive days. Accuracy was determined by comparing the calculated concentration to the added concentration, using calibration curves. The intra-day and inter-day precisions were assessed by calculating the relative standard deviation (RSD). The mean value of accuracy should be within 15% of the actual value except when at a lower limit of quantification (LLOQ), where it should not deviate by more than 20%. The RSD determined at each concentration level should not exceed 15% of the coefficient of variation (CV) except for the LLOQ, which should not exceed 20% of the CV.
ISL stability in plasma was assessed by analyzing QC samples at concentrations of 0.038, 0.156, 1.25, 5 and 20 μg/ml, respectively (n = 5), for three freeze-thaws, short-term, long-term and post-preparative stabilities. For the short-term stability, the plasma samples were kept at room temperature (∼25 °C) for 6 h before sample preparation. The freeze-thaw stability of ISL was determined over three freeze-thaw cycles within 3 days. In each freeze-thaw cycle, the spiked plasma samples were frozen at −45 °C for 24 h and thawed at room temperature. When completely thawed, the samples were refrozen for 12–24 h under the same conditions. After three cycles, the percent loss of the analyte was determined by comparing the concentrations with those obtained before freezing. The long-term stability was evaluated after keeping the plasma samples frozen at −45 °C for 30 days. The stability of the prepared plasma samples was tested after keeping the samples in an autosampler at ∼25 °C for 24 h. The samples were analyzed and the results compared with those obtained from the freshly prepared samples.
Animals
Male SD rats (220 ± 20 g) and Kunming mice (20 ± 2 g), obtained from the Laboratory Animal Center of Lanzhou University (Lanzhou, China), were used for pharmacokinetic and biodistribution studies, respectively. They were kept in an environmentally controlled breeding room for 5 days and fasted for 12 h with free access to water before experiments. All protocols and procedures were approved by the Lanzhou University Animal Care and Use Committee.
Protein binding
Isoliquiritigenin binding to rat plasma proteins was determined by ultrafiltration. Various ISL concentrations (0.5, 5 and 10 μg/ml) were investigated. Plasma samples spiked with ISL were incubated at 37 ± 1 °C for 1 h and aliquots were separated for the determination of total plasma concentration. Aliquots of 1 ml were placed into the upper part of the Vivaspin 500 ultrafiltration devices (5000 MWCO PES; Startorius Stedim Biotech GmbH, Germany) and centrifuged at 15 000 × g for 1 h at 4 °C. Ultrafiltrates were collected and the ISL concentration was determined in each sample by HPLC as described previously. Duplicates were analyzed for each concentration. ISL-free fraction was determined by the ratio between ultrafiltrates and total plasma concentrations. ISL binding to the ultrafiltration device was determined in the same range of concentrations employing drug aqueous solutions. The plasma protein binding was calculated according to the following equation:
Drug administration and sampling
For the pharmacokinetic study, 36 rats were randomly assigned to six groups. Each group contained six rats. ISL was dissolved in medicinal ethanol Tween 80–0.9% sodium chloride saline (10:15:75, v/v/v) to the concentration of 12 mg/ml and filtered through a 0.22 -μm filter before experiment. The ISL solution was injected in rats (n = 6) via a tail vein injection at a dose of 10, 20 and 50 mg/kg to groups 1, 2 and 3, respectively, and administered orally at a dose of 20, 50 and 100 mg/kg to groups 4, 5 and 6, respectively. Then a ∼0.3 ml aliquot of blood samples were collected by retro-orbital venous plexus puncture at time intervals of 0.08, 0.25, 0.5, 0.75, 1, 1.5, 2, 3, 6, 8 and 12 h after the injection, and 0.08, 0.25, 0.5, 1, 1.5, 2, 3, 4, 6, 9 and 12 h after p.o. administration. Plasma was obtained by centrifugation at 4500 × g for 10 min and stored at −45 °C before analysis. Blank plasma was collected by the same method before rats were treated.
Tissue distribution studies
The Kunming mice were randomly divided into two groups. ISL solutions were intravenously administrated via tail vein and orally administered at a dose of 20 mg/kg to mice of each group. At determined time points (0.5, 1, 2, 3 and 6 h), six animals at each time point from each group were given anaesthesia and blood was collected from the postorbital vein into heparinized tubes and was centrifuged to get the plasma samples. Tissues of interest (heart, liver, spleen, lung, kidney, brain, fat and muscle) were collected immediately after cervical dislocation at different time points and weighed rapidly. They were placed into normal saline solution to remove the blood or content and blotted dry with tissue paper. The plasma and tissue samples were frozen at −45 °C until analysis.
Plasma and tissue sample analysis
A previously validated HPLC method (Zhang et al., Citation2009) was used to analyze the drug in the samples. Briefly, a 100 μl of each plasma sample was transferred into a 1.5-ml polyethylene centrifuge tube. Acetonitrile (500 μl) containing 20 μl of IS solution (100 μg/ml) were added to each plasma sample and vortex-mixed (SW-80 A vortex shaker, Shanghai Medical University Instrument Plant, Shanghai, China) for 3 min. Thereafter, 300 mg of sodium chloride were added to the mixture and vortex-mixed for 1 min. After 1 min, the mixture was centrifuged for 5 min at 12 000 × g to separate precipitated proteins. The supernatant (acetonitrile layer) was transferred into a new 1.5 ml Eppendorf tube and evaporated to dryness at 40 °C under a gentle stream of nitrogen. The residue was then reconstituted with 100 μl of a mixed solution of methanol and water in the ratio of 50:50 (v/v), and ultrasonitated for 1 min and vortex-mixed for 1 min again, then centrifuged at 12 000 × g for 5 min and an aliquot (50 μl) of the clear supernatant was injected into the LC system.
Tissue sample was weighed accurately and homogenized using a glass tissue homogenizer after addition of 1 ml physiologic saline. Tissue homogenates were processed similarly as plasma samples and analyzed by HPLC.
Pharmacokinetic analysis
Compartmental and non-compartmental pharmacokinetic analysis of ISL concentrations versus time data were performed using DAS 2.0 (Drug and Statistics 2.0, the Committee of the Mathematic Pharmacology, the Chinese Society of Pharmacology, Hefei, China) to estimate the pharmacokinetic parameters. The pharmacokinetic parameters, such as maximum plasma concentration (Cmax) and time of maximum concentration (Tmax), were obtained directly from the plasma concentration–time plots. For intravenous injection, the appropriate pharmacokinetic model was determined by visual examination of individual concentration–time curves and by application of Akaike’s Information Criterion (AIC) (Akaike, Citation1986; Yamaoka et al., Citation1978) and the fitted degree (R2). The distribution and terminal elimination half-lives (t1/2α and t1/2λ, respectively) and the apparent volume of distribution (V) were calculated using standard equations (Gibaldi & Perrier, Citation1982). The program also calculated the non-compartmental parameters using the statistical moment theory (Yamaoka et al., Citation1978). The terminal elimination half-life (t1/2λ) was calculated as ln 2/λ. The apparent volume of distribution (V) was calculated as V = Di.v./(λ × AUCi.v.) following intravenous administration and V/F = Dp.o./(λ × AUCp.o.) following oral administration. The area under concentration–time curve (AUC) and area under the first moment curve (AUMC) were calculated by the method of trapezoids, and extrapolation to infinity was performed. The total body clearance was calculated as Cl = Di.v./AUCi.v. following intravenous administration and Cl/F = Dp.o./AUCp.o. following oral administration. Mean residence time (MRT) was given by the AUMC0−∞ to AUC0−∞ ratio. The oral mean absorption time (MAT) is the oral mean residence time (MRTp.o.) minus the mean i.v. residence time (MRTi.v.). The MAT value was calculated based on the MRTi.v. after intravenous administration of ISL at a dose of 10 mg/kg. Absolute bioavailability (F) was calculated as (AUCp.o. × Di.v.)/(AUCi.v. × Dp.o.) × 100%. Where p.o. and i.v., respectively, express oral and intravenous administration, and D was dose of administration. The F value was calculated based on the AUC after intravenous administration of ISL at a dose of 20 mg/kg.
Statistic analysis
The pharmacokinetic model and the parameters were calculated by the DAS 2.0 (Drug and Statistics 2.0) edited by the Committee of the Mathematic Pharmacology, the Chinese Society of Pharmacology. The data were presented as mean ± SD, comparisons between groups were performed by one-way ANOVA. The statistical differences were evaluated using t-test. A p value of 0.05 or less was considered significant.
Results
Method validation
The resulting chromatograms were essentially free from endogenous interference. The retention time for ISL and the internal standard was 7.94 and 3.21 min, respectively, and the peak shapes were satisfactory and suitable for quantitative analysis. The results of linear regression analysis showed that the correlation coefficients of the calibration curves for all sample types were >0.99. The results summarized in for accuracy and precision indicated that the method was reliable and reproducible. The mean recoveries (n = 5) for ISL (0.038, 0.625, 1.25, 5 and 20 μg/ml) in plasma were 89.51 ± 3.92, 87.26 ± 1.48, 91.35 ± 2.94, 90.28 ± 4.05 and 96.18 ± 2.36%, respectively. The results of stabilities for samples demonstrated that no significant degradation of ISL in plasma occurred under these experimental conditions. The mean concentrations following the storage period ranged from 94.74 to 99.78% in plasma.
Table 1. Precision and accuracy data for ISL in plasma and tissues (n = 6).
Protein binding
Plasma protein binding of ISL was determined over the plasma concentrations range observed in the animals. ISL binding to the ultrafiltration device was 3.22 ± 0.13% and this value was taken into consideration for the protein binding determination. Protein binding was concentration-independent and was determined to be 43.72 ± 2.03% in the range of ISL concentrations evaluated (0.50–10.00 μg/ml).
Pharmacokinetics of ISL after intravenous administration in rats
The mean plasma concentration–time profiles of ISL after intravenous administration at doses of 10, 20 and 50 mg/kg in rats are shown in , and some relevant pharmacokinetic parameters are listed in . A two compartment open model (weight = 1) gave the best fit to the plasma concentration time curves obtained in rats. Using one-way ANOVA, statistical comparisons of individual pharmacokinetic parameters such as t1/2α, t1/2λ, the total body clearance (Cl) and apparent volume of distribution (V) demonstrated no significant (p > 0.05) differences when each parameter was compared for the three test doses. Note that the AUC values of ISL were proportional to intravenous doses studied. For example, the dose-normalized (based of 10 mg/kg) AUC values were 7.3 ± 0.43, 7.6 ± 0.27 and 8.7 ± 0.18 μg × h/ml for 10, 20 and 50 mg/kg, respectively. The slope between log AUC and log dose of ISL was close to 1.0 (the value was 0.9077). depicts the plot of Cmax and AUC as a function of dose. Proportionality was also tested after normalization of Cmax and AUC to a 10 mg/kg dose. Comparisons of Cmax and AUC normalized to 10 mg/kg dose did not result in any significant differences among the three doses studied. The peak plasma concentrations (Cmax) and the AUC increased in proportion with increasing doses of ISL. Also, MRT was not changed over the dose range studied. The volume of distribution was larger than the total water (60–70% body-weight) (Granero & Amidon, Citation2008), suggesting that ISL appeared to be widely distributed throughout the body.
Figure 2. Mean plasma concentration–time profiles of ISL after intravenous administration at doses of 10 mg/kg (n = 6), 20 mg/kg (n = 6) and 50 mg/kg (n = 6) in rats. Vertical bars represent SD.
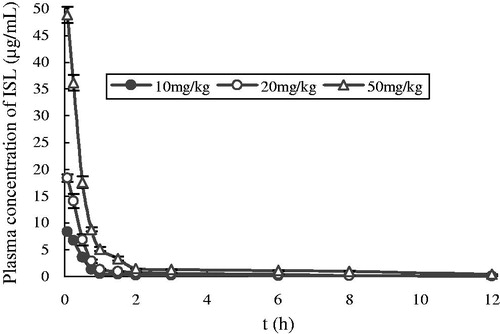
Figure 3. Relationship between Cmax and AUC versus dose in rats receiving single 10, 20 and 50 mg/kg intravenous doses of ISL.
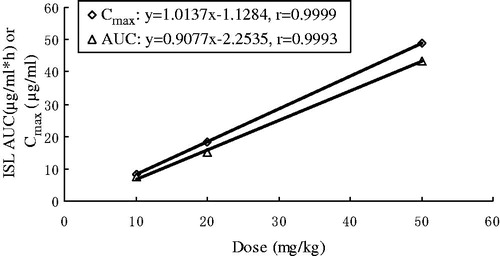
Table 2. The main pharmacokinetic parameters of ISL after single intravenous administration at different doses in rats.
Pharmacokinetics of ISL after oral administration in rats
After oral administration of ISL at doses of 20, 50 and 100 mg/kg to rats, the mean plasma concentration–time profiles of ISL are shown in , and some relevant pharmacokinetic parameters are listed in . After oral administration of ISL, the absorption of the drug from the rat gastrointestinal tract was rapid. ISL was detected in plasma from the first blood sampling time (5 min) and rapidly reached Tmax (30 min) for all three oral doses studied. Moreover, multiple peaks were observed in the plasma concentration versus time profiles, regardless of the dose. Note that the dose-normalized (based on 20 mg/kg) AUC values of ISL were also comparable (not significantly different) among the three doses studied. For example, the dose-normalized (based on 20 mg/kg) AUC values were 4.5 ± 0.21, 3.4 ± 0.20 and 5.1 ± 0.13 μg × h/ml for 10, 30 and 100 mg/kg, respectively. The slope between log AUC and log dose of ISL was close to 1.0 (the value was 1.0543). The F values were 29.86, 22.70 and 33.62% for oral doses of 20, 50 and 100 mg/kg, respectively. Moreover, other pharmacokinetic parameters of ISL listed in were also not significantly different among three oral doses studied, except Cmax, indicating that the pharmacokinetic parameters of ISL are also independent of three oral doses studied.
Figure 4. Mean plasma concentration–time profiles of ISL after oral administration at doses of 20 mg/kg (n = 6), 50 mg/kg (n = 6) and 100 mg/kg (n = 6) in rats. Vertical bars represent SD.
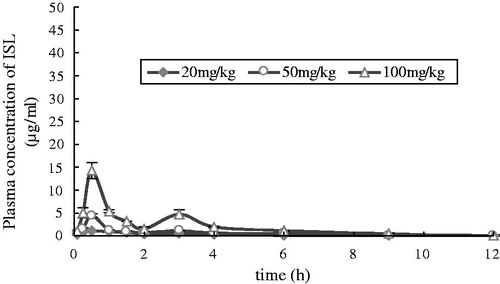
Table 3. The main pharmacokinetic parameters of ISL after single oral administration at different doses in rats.
Tissues distribution study
Intravenous injection
Concentrations of ISL were determined in various tissues of mice including heart, liver, lung, spleen, kidney, brain, muscle and fat, respectively (). At 0.5 h after i.v. administration of ISL to mice, the highest level of ISL was observed in tissues. And at 6 h, ISL was few in all collected tissues. shows the concentrations of the ISL in mice tissues at 0.5, 1, 2, 4 and 6 h after i.v. dose of ISL. At 2 h after i.v. administration, the concentrations of ISL were low in all collected tissues, that is, there was no long-term accumulation after i.v. dose of ISL. In tissue distribution studies, the pharmacokinetics of ISL was analyzed following a non-compartment model and the parameters are presented in . Results showed that the order of AUC was liver > kidney > heart > spleen > lung > fat > muscle > brain. The order of peak ISL concentration was liver > kidney > heart > spleen > lung > fat > muscle > brain. The maximum concentration (13.9 μg/g) was found in the liver. ISL was eliminated most rapidly in kidney and the order of ISL elimination half lives (t1/2λ) was spleen > muscle > liver > brain > heart > fat > kidney > lung.
Figure 5. Concentration of ISL in tissues after single intravenous administration (A) and oral administration (B) to mice at 20 mg/kg doses.
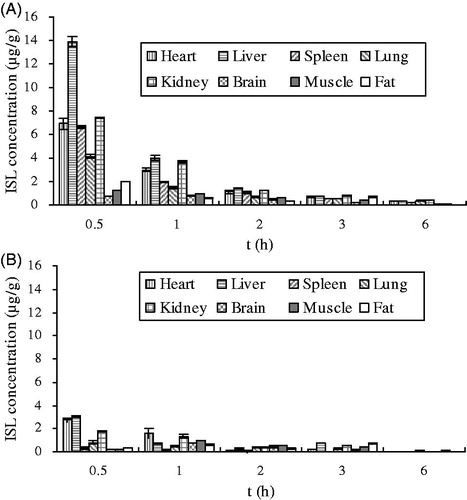
Table 4. Non-compartmental pharmacokinetic parameters of ISL in mice following a single intravenous dose of 20 mg/kg.
Oral administration
The distribution of ISL in each tissue after (20 mg/kg b.w) p.o. administration are shown in and the pharmacokinetic parameters have been calculated (). At 0.5 h after i.v. administration of ISL, the highest level of ISL was observed in heart, liver, spleen, lung and kidney, but in brain and muscle, the highest level of ISL was observed at 1 h exception fat. The order of Cmax was liver > heart > kidney > muscle > brain > lung > fat > spleen, which is different from i.v. administration. ISL was rapidly eliminated from tissues and the order of half-lives (t1/2λ) of ISL was liver > heart > kidney > spleen > muscle > lung > fat > brain. The order of MRT was lung > muscle > fat > brain > kidney > liver > spleen > heart.
Table 5. Non-compartmental pharmacokinetic parameters of ISL in mice following a single oral dose of 20 mg/kg.
Discussion and conclusion
The LC method (Zhang et al., Citation2009) we developed was simple, rapid and sensitive, and could be used for the analysis of large numbers of biological samples including rats plasma and mice tissues. The assay was validated to meet the requirements of pharmacokinetic and biodistribution studies. Because of the relatively short chromatographic run time and simple sample preparation procedure, a sample throughput of ∼140 per day was achieved. The method proved to be effective in measuring the concentration of ISL in rat plasma and mice tissues without any endogenous substance peaks interfering with the analyte and IS.
A comprehensive knowledge of the absorption, distribution, metabolism and elimination of a compound is important for the interpretation of pharmacology and toxicology studies. The present study describes the pharmacokinetics of ISL after single oral and intravenous administration of the ISL solution to rats. The compartment model was established by the methods of the Akaike’s information criterion, AIC (Akaike, Citation1986) and the fitted degree (R2). In our study, a two compartment open model (weight = 1) after i.v. injection gave the best fit to the plasma concentration time curves obtained in rats, which was reported by Zhang et al. (Citation2009). After i.v. administration in rats, plasma concentrations of ISL rapidly declined (). This could account for the rapid distribution with half-life of distribution (t1/2α) of 0.3 h and fastly eliminated with an elimination half-life (t1/2λ) of 4.9, 4.6 and 4.8 h at dose of 10, 20 and 50 mg/kg, respectively.
The apparent volumes of distribution (V) obtained after i.v. administration at doses of 10, 20 and 50 mg/kg in our study indicate that ISL is widely distributed (). On the other hand, the total body clearance (Cl) of 1.0–1.4 l/h/kg () were considerably much lower than the reported cardiac output in rats, 17.76 l/h/kg, based on blood data (Davies & Morris, Citation1993). This suggested that the first pass effects of ISL in the lung and heart could not be considered in rats.
The concentration-time profiles of ISL exhibited double peaks after p.o. administration route but no double peaks by i.v. administration. Several mechanisms have been proposed to explain this phenomenon, such as enterohepatic recycling, presence of absorption windows along the gastrointestinal tract, variations in the condition of the intestinal lumen pH and time-related fluctuations in gastric emptying (Godfrey et al., Citation2011). All these reasons, except enterohepatic cycling, are related to the absorption process. Similar double peak phenomena with the present study have been described for other drugs such as clomipramine and desmethylclomipramine (Lainesse et al., Citation2006), the pharmacokinetics of which were measured following both oral and i.v. administration, producing a second peak in the oral responses, but no second peak in the i.v. responses, from which Lainesse et al. (Citation2006) concluded that enterohepatic recirculation was not a possible explanation for the second peak following the oral dose. Hence, the presence of peaks after oral administration suggests the reason most commonly advanced for the double peak phenomenon following oral administration in ISL plasma concentrations is variability of absorption within different regions of the gut, in particular, zero or very low absorption from the stomach, jejunum, compared with the absorption from the duodenum and ileum, which was in accordance with our experiment results of the in situ gastric and intestinal perfusion in the rats. This has been cited as the reason for the phenomenon following oral administration of acebutolol (Mostafavi & Foster, Citation2003), cimetidine (Piyapolrungroj et al., Citation2000) and ranitidine (Yin et al., Citation2003). So, this was thought to be by far the most probable physiological explanation for the double peak phenomenon in the responses examined in this article.
This study has shown that ISL was absorbed rapidly and eliminated quickly in mice following an i.v. or p.o. administration at a dose of 20 mg/kg. In tissue distribution studies after i.v. administration (), it was showed that ISL was mainly distributed in abundant blood-supply tissues such as heart, liver, kidney and lung, which implied that the distribution of ISL was depended on the blood flow or perfusion rate of the organ. The high distribution in heart, lung, kidney and liver confirms that ISL has good curative effects on cardiac, respiratory, urinary system and liver tumor. Meanwhile, the high level in kidney demonstrated that kidney might be the primary excretion organ of ISL. The lowest level founded in brain implied that ISL had difficulty crossing the blood–brain barrier because of its high polarity (Hua et al., Citation2010; Li et al., Citation2008).
The drug reached peak concentrations within 1 h after p.o. administration, suggesting ISL was absorbed rapidly. In mice, the order of Cmax was: liver > heart > kidney > muscle > brain > lung > fat > spleen when administered p.o. In contrast, the order was liver > kidney > heart > spleen > lung > fat > muscle > brain after a single dose i.v. injection. The results indicate that pharmacokinetics of ISL is affected by variation of administration routes. ISL presented different pharmacokinetic characteristics in different tissues. After a single dose injection, ISL was most rapidly eliminated from kidney. The order of t1/2λ was spleen > muscle > liver > brain > heart > fat > kidney > lung. However, after p.o. administration, the order was liver > heart > kidney > spleen > muscle > lung > fat > brain.
In conclusion, after a single i.v. administration of 10, 20 and 50 mg/kg ISL to rats, ISL was quickly eliminated in rat and manifested linear dynamics in the dose range of 10–50 mg/kg. But absolute bioavailability of ISL was lower, which suggested that ISL should be prepared as a suitable dosage form or given by a fitting administration route. Kidney excretion may be the main ISL elimination pathway due to increased drug exposure. Further work is needed to understand the pharmacokinetics of ISL more clearly in rats and other species, and to obtain an accurate and reasonable explanation of double peaks phenomenon after oral administration. The achieved pharmacokinetics and tissue distribution results may be useful for further study of the bioactive mechanism of ISL.
Declaration of interest
This work has been financially supported by the Administration of Traditional Chinese Medicine of Gansu Proviance (No. GZK-2008-21). The authors declare that they have no conflict of interest.
References
- Akaike A. (1986). An information criterion (AIC). Math Sci 14:5–9
- Baba M, Asano R, Takigami I, et al. (2002). Studies on cancer chemoprevention by traditional folk medicines XXV. Inhibitory effect of isoliquiritigenin on azoxymethane-induced murine colon aberrant crypt focus formation and carcinogenesis. Biol Pharm Bull 25:247–50
- Cao Y, Wang Y, Ji C, Ye J. (2004). Determination of liquiritigenin and isoliquiritigenin in Glycyrrhiza uralensis and its medicinal preparations by capillary electrophoresis with electrochemical detection. J Chromatogr A 1042:203–9
- Chan SC, Chang YS, Wang JP, et al. (1998). Three new flavonoids and antiallergic, anti-inflammatory constituents from the heartwood of Dalbergia odorifera. Planta Med 64:153–8
- Chin YW, Jung HA, Liu Y, et al. (2007). Antioxidant constituents of the roots and stolons of licorice (Glycyrrhiza glabra). J Agric Food Chem 55:4691–7
- Chisato N, Yang J, Kazuho S, et al. (2008). Inhibitory effects of isoliquiritigenin and licorice extract on voltage-dependent K+ currents in H9c2 cells. J Mol Cell Cardiol 44:444–61
- Chowdhury SA, Kishino K, Satoh R, et al. (2005). Tumor-specificity and apoptosis-inducing activity of stilbenes and flavonoids. Anticancer Res 25:2055–63
- Davies B, Morris T. (1993). Physiological parameters in laboratory animals and humans. Pharm Res 10:1009–95
- FDA. (2001). US Department of Health and Human Services, Food and Drug Administration, Center for Drug Evaluation and Research (CDER), Guidance for Industry, Bioanalytical Method Validation
- Gibaldi M, Perrier D. (1982). Non-Compartmental Analysis Based on Statistical Moment Theory. Pharmacokinetics. 2nd ed. New York: Marcel Dekker, 409–17
- Godfrey KR, Arundel PA, Dong ZM, Bryant R. (2011). Modelling the double peak phenomenon in pharmacokinetics. Comput Meth Prog Bio 104:62–9
- Granero GE, Amidon GL. (2008). Possibility of enterohepatic recycling of ketoprofen in dogs. Int J Pharm 349:166–71
- Haraguchi H, Ishikawa H, Mizutani K, et al. (1998). Antioxidative and superoxide scavenging activities of retrochalcones in Glycyrrhiza inflate. Bioorg Med Chem 6:339–47
- Hsu YL, Kuo PL, Lin CC. (2005a). Isoliquiritigenin induces apoptosis and cell cycle arrest through p53-dependent pathway in Hep G2 cells. Life Sci 77:279–92
- Hsu YL, Kuo PL, Lin LT, Lin CC. (2005b). Isoliquiritigenin inhibits cell proliferation and induces apoptosis in human hepatoma cells. Planta Med 71:130–4
- Hua X, Fu YJ, Zu YG, et al. (2010). Plasma pharmacokinetics and tissue distribution study of cajaninstilbene acid in rats by liquid chromatography with tandem mass spectrometry. J Pharm Biomed Anal 52:273–9
- Ii T, Satomi Y, Katoh D, et al. (2004). Induction of cell cycle arrest and p21(CIP1/WAF1) expression in human lung cancer cells by isoliquiritigenin. Cancer Lett 207:27–35
- Iwashita K, Kobori M, Yamaki K, Tsushida T. (2000). Flavonoids inhibit cell growth and induce apoptosis in B16 melanoma 4A5 cells. Biosci Biotechnol Biochem 64:1813–20
- Jung JI, Chung E, Seon MR, et al. (2006a). Isoliquiritigenin (ISL) inhibits ErbB3 signaling in prostate cancer cells. Biofactors 28:159–68
- Jung JI, Lim SS, Choi HJ, et al. (2006b). Isoliquiritigenin induces apoptosis by depolarizing mitochondrial membranes in prostate cancer cells. J Nutr Biochem 17:689–96
- Kanazawa M, Satomi Y, Mizutani Y, et al. (2003). Isoliquiritigenin inhibits the growth of prostate cancer. Eur Urol 43:580–6
- Kape R, Parniske M, Brandt S, Werner D. (1992). Isoliquiritigenin a strong nod gene- and glyceollin resistance-inducing flavonoid from soybean root exudate. Appl Environ Microb 58:1705–10
- Kim DC, Choi SY, Kim SH, et al. (2006). Isoliquiritigenin selectively inhibits H2 histamine receptor signaling. Mol Pharmacol 70:493–500
- Kim JY, Park SJ, Yun KJ, et al. (2008). Isoliquiritigenin isolated from the roots of Glycyrrhiza uralensis inhibits LPS-induced iNOS and COX-2 expression via the attenuation of NF-kappaB in RAW 264.7 macrophages. Eur J Pharmacol 584:175–84
- Kim SC, Byun SH, Yang CH, et al. (2004). Cytoprotective effects of Glycyrrhizae radix extract and its active component liquiritigenin against cadmium-induced toxicity (effects on bad translocation and cytochrome c-mediated PARP cleavage). Toxicol 197:239–51
- Kobayashi S, Miyamoto T, Kimura I, Kimura M. (1995). Inhibitory effect of isoliquiritin, a compound in licorice root, on angiogenesis in vivo and tube formation in vitro. Biol Pharm Bull 18:2–6
- Lainesse C, Frank D, Meucci V, et al. (2006). Pharmacokinetics of clomipramine and desmethylclomipramine after single-dose intravenous and oral administration in cats. J Vet Pharmacol Ther 29:271–8
- Li DQ, Wang Q, Yuan ZF, et al. (2008). Pharmacokinetics and tissue distribution study of orientin in rat by liquid chromatography. J Pharm Biomed Anal 47:429–34
- Ma J, Fu NY, Pang DB, et al. (2001). Apoptosis induced by isoliquiritigenin in human gastric cancer MGC-803 cells. Planta Med 67:754–7
- Maggiolini M, Statti G, Vivacqua A, et al. (2002). Estrogenic and antiproliferative activities of isoliquiritigenin in MCF7 breast cancer cells. J Steroid Biochem Mol Biol 82:315–22
- Morteza SK, Saeedi M, Hamidian M. (2004). Anti-inflammatory and analgesic activity of the topical preparation of Glaucium grandiflorum. Fitoterapia 75:123–9
- Mostafavi SA, Foster RT. (2003). Influence of cimetidine co-administration on the pharmacokinetics of acebutolol enantiomers and its metabolite diacetolol in a rat model: The effect of gastric pH on double-peak phenomena. Int J Pharm 255:81–6
- Piyapolrungroj N, Zhou YS, Li C, et al. (2000). Cimetidine absorption and elimination in rat small intestine. Drug Metab Dispos 28:65–72
- Takahashi T, Takasuka N, Iigo M, et al. (2004). Isoliquiritigenin, a flavonoid from licorice, reduces prostaglandin E2 and nitric oxide, causes apoptosis, and suppresses aberrant crypt foci development. Cancer Sci 95:448–53
- Tamir S, Eizenberg M, Somjen D, et al. (2001). Estrogen-like activity of glabrene and other constituents isolated from licorice root. J Steroid Biochem Mol Biol 78:291–8
- Tawata M, Aida K, Noguchi T, et al. (1992). Anti-platelet action of isoliquiritigenin, an aldose reductase inhibitor in licorice. Eur J Pharmacol 212:87–92
- Yamamoto S, Aizu E, Jiang H, et al. (1991). The potent anti-tumor-promoting agent isoliquiritigenin. Carcinogenesis 12:317–23
- Yamaoka K, Nakagawa T, Uno T. (1978). Statistical moment in pharmacokinetics. J Pharm Biopharm 6:547–58
- Yamazaki S, Morita T, Endo H, et al. (2002). Isoliquiritigenin suppresses pulmonary metastasis of mouse renal cell carcinoma. Cancer Lett 183:23–30
- Yin OQ, Tomlinson B, Chow AH, Chow MS. (2003). A modified two-portion absorption model to describe double-peak absorption profiles of ranitidine. Clin Pharmacokinet 42:179–92
- Zhang XY, Liu JP, Qiao H, et al. (2009). Determination and pharmacokinetics of isoliquiritigenin in rat plasma by reverse phase high-performance liquid chromatography after intravenous administration. Chromatographia 70:423–30