
Abstract
Context: Mefenamic acid (MEF) and the dried root of Scutellaria baicalensis Georgi (Radix Scutellariae, RS) share a high possibility of combined medication to treat inflammation.
Objective: The present study investigates the impact of MEF on absorption/disposition of three major components in RS (baicalein, B; wogonin, W; oroxylin A, OA) and further pharmacological changes.
Materials and methods: The apparent permeability (Papp) and percentage of metabolism of B, W and OA at 10 μΜ were measured at the absence/presence of MEF (100 μΜ) in the Caco-2 cell monolayer model. A modified whole blood assay was employed to quantify prostaglandin E2 (PGE2) 4, 6 and 8 h post-oral administration with water suspension of MEF at 40 mg/kg and RS at 200 mg/kg.
Results: In the presence of MEF, Papp of B, W and OA were increased from 1.69 ± 0.89 × 10⁻⁶, 1.57 ± 0.10 × 10⁻⁶ and 3.09 ± 0.70 × 10⁻⁶ cm/sec to 5.24 ± 0.27 × 10⁻⁶, 6.08 ± 0.19 × 10⁻⁶ and 4.13 ± 0.38 × 10⁻⁶, whereas their percentage of metabolism was decreased from 72.75 ± 2.44%, 73.27 ± 3.25% and 89.84 ± 2.99% to 21.11 ± 0.69%, 17.90 ± 5.55% and 45.44 ± 3.38%. PGE2 level was much lower in the co-administration group (49.04 ± 2.03 pg/ml) than in the MEF group (73.13 ± 3.03 pg/ml) or RS group (494.37 ± 11.75 pg/ml) 4 h post MEF dosing, suggesting a synergic effect.
Discussion and conclusion: Co-administration of MEF and RS could induce potential alterations in their pharmacokinetic profiles and anti-inflammatory effects.
Introduction
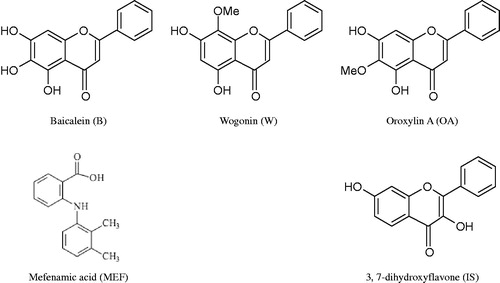
Radix Scutellariae (RS) is the dried root of the Labiatae plant Scutellaria baicalensis Georgi and it is officially listed in the Chinese Pharmacopoeia and has been extensively employed in various proprietary traditional Chinese medicines indicated for inflammation and infections (Shang et al., Citation2010). Flavonoids are abundant in RS and six flavones are identified to be its major ingredients, namely baicalein (B), baicalin (BG), wogonin (W), wogonoside (WG), oroxylin A (OA) and oroxylin A-7-glucuronide (OAG) (Li et al., Citation2009; Li & Sheu, Citation1995) (). In our previous studies on the pharmacokinetic characterization of bioactive flavones in RS, it was found that B, W and OA could be absorbed directly and underwent extensive Phase II metabolism mainly mediated by UDP-glucuronosultransferases (UGTs) (Li et al., Citation2012a,Citationb; Zhang et al., Citation2007).
Figure 1. Chemical structures of baicalein (B), wogonin (W), oroxylin A (OA), mefenamic acid (MEF) and 3,7-dihydroxyflavone (IS).
More and more herbal remedies and phytomedicines have been consumed worldwide as complementary and alternative medicines for their beneficial effects (Oqa et al., Citation2012). In clinics, the chance of the combinational use of herbal medicines and synthesized medicines is considerably high. The issue of herb–drug interactions has been recognized since the 1990s and its consequences on pharmacokinetics and pharmacodynamics have been comprehensively investigated (Mohamed & Frye, Citation2011). However, most of the studies focus on the influence of herbal remedies on western drugs. The corresponding impact on herbal medicines due to herb–drug interaction also warrant investigation.
In the treatment of inflammation-related diseases such as minor pains, rheumatic arthritis and osteoarthritis, non-steroidal anti-inflammatory drugs (NSAIDs) are most frequently used, in which MEF is extensively prescribed. In vitro enzymatic studies proved that MEF would inhibit the glucuronidation of 3β-estradiol, aldosterone, zidovudine and mycophenolic acid in rat liver microsomes, human liver and kidney microsomes, human hepatocyte as well as recombinant UGTs (Knights et al., Citation2009; Mano et al., Citation2007, Citation2008). Since B, W and OA are also substrates of UGTs, this study was performed to investigate the impact of MEF on the intestinal glucuronidation of three flavones during their absorption. Furthermore, the pharmacological consequences of co-administrations of RS and MEF were also explored in vitro and in vivo.
Materials and methods
Chemicals and reagents
Baicalein (B) and baicalin (BG) with purity over 98% were purchased from Sigma-Aldrich Chem. Co. (Milwaukee, WI). Wogonin (W) and wogonoside (WG) with purity over 98% were purchased from AvaChem Scientific LLC (San Antonio, TX). Oroxylin A (OA, purity over 98%) and Oroxylin A-7-O-glucuronide (OAG, purity over 95%) as well as Radix Scutellariae extract were supplied by Shanghai U-Sea Biotech Co., Ltd (Shanghai China). Mefenamic acid (MEF) and lipopolysaccharide were supplied by Sigma-Aldrich Chem. Co. (Milwaukee, WI). 3,7-Dihydroxyflavone (IS) as internal standard with purity of 97% was purchased from Indofine Chemical Company (Hillsborough, NJ). Potassium dihydrogen phosphate was purchased from Merck (Darmstadt, Germany). Acetonitrile (Labscan Asia, Thailand) and methanol (TEDIA company, Inc., Fairfield, OH) were HPLC grade and used without further purification. All other reagents were of at least analytical grade. Distilled and deionized water were used throughout the experiment.
For cell culture, Dulbecco’s modified Eagle’s medium, fetal bovine serum, 0.25% trypsin-EDTA, penicillin–streptomycin and non-essential amino acids were purchased from Gibco BRL (Carlsbad, CA) and Life Technologies (Grand Island, NY). Phosphate buffered saline tablets were purchased from Sigma Chemical Co. (St. Louis, MO).
Cell culture
Caco-2 cells (American Type Culture Collection) were cultured in Dulbecco’s modified Eagle’s medium at 37 °C, supplemented with 10% fetal bovine serum, 1% non-essential amino acids, in an atmosphere of 5% CO2 and 90% relative humidity. Caco-2 cells were sub-cultured at 70–80% confluence by trypsinization with 0.25% trypsin-EDTA and plated onto 6-well plates Transwell® inserts (24 mm I.D., 0.4 mM pore size, 4.71 cm2, polycarbonate filter, Corning Costar Co., NY) coated with a collagen layer at a density of 3 × 10⁵ cells/well and cultured for 21 days prior to transport studies. Caco-2 monolayers with TEER (transepithelial electrical resistance) above 600 ohms cm2 were employed in the transport study.
Absorption transport (apical to basolateral) study in Caco-2 cell monolayer model
Apical to basolateral transport study was conducted in phosphate buffer supplemented with 0.45 mM calcium chloride and 0.4 mM potassium chloride (pH 6.0, PBS+). B/W/OA at concentration of 10 μM in PBS+ was loaded into the apical side with the presence/absence of MEF at 100 μM. The transport study of MEF at 100 μM was also conducted. Aliquots of 0.5 ml samples were taken from basolateral side at different time intervals of 30, 60, 90 and 120 min. The same volume of blank PBS+ was added to basolateral side after each sampling. All the samples were stabilized with 0.2 ml mixture of methanol: 20% ascorbic acid solution (1:1, v:v) and stored at −80 °C until analysis.
Animal surgery and drug administration
Male Sprague-Dawley rats (body weight, 230–250 g) were supplied by the laboratory Animal Services Center at the Chinese University of Hong Kong. The experiment was conducted under the approval by Animal Ethics Committee of the Chinese University of Hong Kong.
Eighteen rats were randomly divided into three groups: RS group, MEF group and MIX group. Rats were orally administrated with RS extract at 200 mg/kg (RS group), MEF at 40 mg/kg (MEF group) and a mixture of RS and MEF (MIX group) by intragastric gavages, respectively for 5 days (t.i.d., each formula).
After the last dosing on the 4th day, the rats were anesthetized with an intramuscular injection of a cocktail containing 60 mg/kg ketamine and 6 mg/kg xylazine. The right jugular vein was cannulated with polyethylene tubing (0.5 mm ID, 1 mm, Portex Ltd., Hythe, Kent, England) for blood sampling. After surgery, rats were allowed to recover overnight under fasting condition with free access to water. On the 5th day, rats were first treated with MEF (MEF and MIX group) and then RS extract (RS and MIX Group) 2 h later. Blood samples were taken at 4, 6 and 8 h post MEF dosing, respectively.
Assay of PGE2 in rat plasma
The assay method was modified based on human whole blood assay (Brideau et al., Citation1996). Fresh blood was collected from the jugular vein. For in vitro cyclooxygenase-2 (COX-2) assay, 500 μl of heparinized blood (15 units/ml) were incubated with 2 μl of B/W/OA in DMSO at 10 μM as well as the combination of B/W/OA with MEF at the concentration of 100 μM for 15 min at 37 °C. Incubation with 2 μl of blank DMSO was set as vehicle control group. For the in vivo COX-2 assay, blood was collected with no compound added. Then lipopolysaccharide which was prepared in phosphate buffer saline was added at a concentration of 2 μg/ml for the induction of COX-2. The incubation was continued at 37 °C for 24 h in a shaking water bath. After the incubation, blood was centrifuged at 12 000 rpm for 5 min at 4 °C to separate plasma. The plasma was further ultra-centrifuged in an Amicon® Ultra-0.5 Centrifugal Filter Devices (30 K NMWL, Millipore Corp., Billerica, MA) at 14 000 × g for 30 min. The supernatant was obtained and the concentration of prostaglandin E2 (PGE2) was assayed using a monoclonal EIA kit (Cayman Chemical Co., Ann Arbor, MA).
Data analysis
The permeability coefficients (Papp) was calculated as described previously using the following equations (Artersson & Karlsson, Citation1991).
where, dC/dt: change of the drug concentration in the receiver chambers over time; V: volume of the solution in the receiver chambers; A: membrane surface area; C: loading concentration in the donor chambers.
Besides, the percentage of metabolism of B/W/OA was calculated according to the following equation, in which “AP” represented cumulative amount in apical side, “BL” represented cumulative amount in basolateral side and “uptake” represented cell uptake.
Results
Metabolism of B/W/OA and MEF in Caco-2 cells
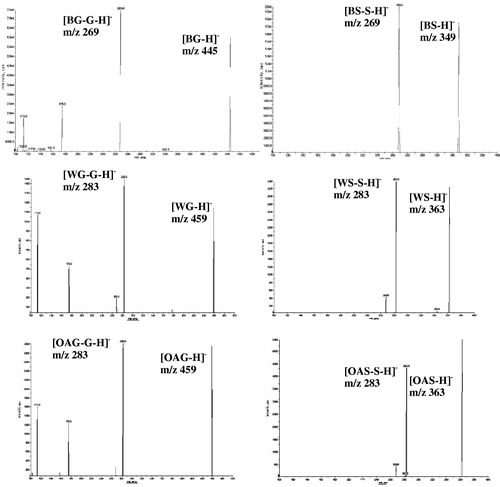
Similar to our previous findings, individual flavones of B/W/OA underwent extensive phase II metabolism in the form of glucuronidation and sulfation. Their glucuronidated metabolites were identified by comparing their HPLC/UV and the LC/MS/MS chromatograms with the corresponding authentic standards, namely BG, WG and OAG. Under negative mode of LC/MS/MS, the sulfate conjugates of B/W/OA exhibited molecular ions and major fragment ions appearing at m/z 349 and m/z 239 for B and at m/z 363 and m/z 283 for W/OA, indicating the loss of a sulfate group. However, there was no phase II metabolite detected for MEF in Caco-2 monolayer. The representative mass spectra are shown in for the identification of glucuronic acid and sulfate conjugate of B, W and OA.
Figure 2. Representative mass spectra of glucuronic acid and sulfate conjugates of B/W/OA in Caco-2 samples from apical to basolateral transport study. BG (445/269): Baicalein-7-O-glucuronide; BS (349/269): Baicalein-O-sulfate; WG (459/283): Wogonin-7-O-glucuronide; WS (363/283): Wogonin-O-sulfate; OAG (459/283): Oroxylin A-7-O-glucuronide; OAS (363/283): Oroxylin A-O-sulfate.
Influence of MEF on the intestinal absorption of B/W/OA
The cumulative amounts of B/W/OA transported to the basolateral side were plotted versus time and shown in . The transported aglycones of B/W/OA increased linearly with time and the amount were compared at different time intervals between two groups. It was shown that MEF could significantly enhance the permeated amounts of B and W, but not OA. Besides, the Papp values of individual flavones were calculated and listed in . After the co-administration of MEF, the Papp values of B and W were increased with significant differences, whereas the Papp value of OA showed a trend of increase, however, with no significant difference.
Figure 3. Cumulative amount of B, W and OA at the receiver side as a function of time during absorption transport in Caco-2 cell monolayer model.
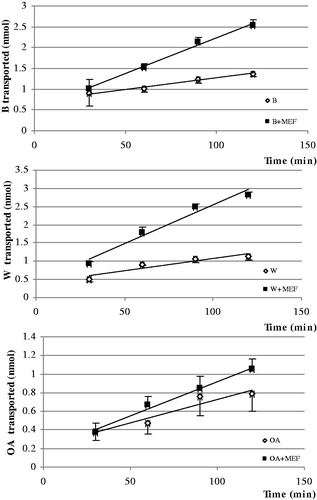
Table 1. Effect of MEF on the absorption (Papp) and metabolism (% of metabolism) of B/W/OA (10 μM) in the Caco-2 monolayer model (n = 3).
Influence of MEF on the intestinal metabolism of B/W/OA
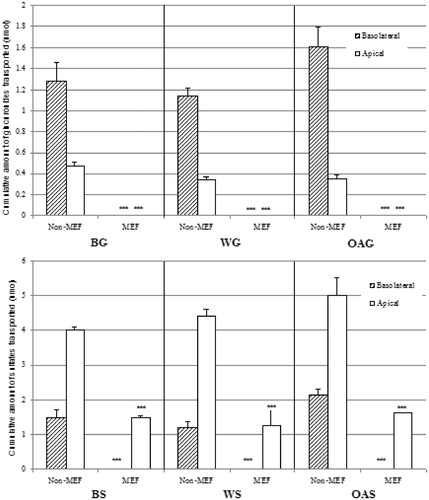
During their intestinal absorption, B/W/OA all showed extensive phase II metabolism in the form of glucuronidation and sulfation. The cumulative amount of produced phase II metabolites of B/W/OA either in the apical side or in the basolateral side were calculated and shown in . The metabolism of B/W/OA by glucuronidation was completely inhibited both on the apical side and the basolateral side (p < 0.001). With regard to the sulfation, there was no formation of sulfated conjugates on the basolateral side for B/W/OA after the co-administration with MEF. Furthermore, the sulfate formation of B/W/OA was significantly decreased by MEF on the apical side.
Figure 4. Efflux transport of glucuronides and sulfates of B, W and OA at the apical and basolateral sides during absorption in the Caco-2 cell monolayer model.
Impact on anti-inflammation effect after co-administration of MEF and RS
In the in vitro COX-2 assay, concentrations of PGE2 were found to be 309.8 ± 11.56, 334.41 ± 42.64, 297.03 ± 38.43 pg/ml for the single compound of B, W, OA at 10 μM, which were decreased to 115.88 ± 0.50, 132.99 ± 14.02 and 108.79 ± 10.36 pg/ml (p < 0.001) after the incubation of MEF at 100 μM. The concentration of PGE2 was 300.96 ± 20.64 pg/ml when MEF was incubated alone.
In the in vivo COX-2 assay, the impact of co-administration on the production of PGE2 showed different profiles across time. The concentration of PGE2 in rat blood after the multiple dosing of RS and MEF alone as well as their mixture are shown in . In these three treatment groups, the inhibition effects on the production of PGE2 were found to be enhanced with time. The anti-inflammatory effect of MEF was much stronger than RS while a synergic anti-inflammatory effect was observed 4 h post MEF dosing after co-administration of RS and MEF.
Table 2. Effect of RS, MEF and co-administration on the production of PGE2 in rat (n = 3).
Discussion
MEF was able to inhibit the glucuronidation of a number of synthesized drugs. In our initial screening tests, MEF also exhibited a strong inhibitory effect on the glucuronidation of B/W/OA after incubation with human and rat liver microsomes as well as in human recombinant UGTs (data not shown). Despite the importance of hepatic metabolism studies, attention should also be given to intestinal metabolism the since intestine is the first barrier that drugs meet after oral consumption and B/W/OA did undergo extensive intestinal metabolism. Therefore, it is of great importance to investigate the influence of MEF on their intestinal absorption and metabolism.
The apical to basolateral transport study of MEF was conducted in the Caco-2 cell model and the Papp value of MEF was comparable to a previously reported value (Wiwattanawongsa et al., Citation2005). B/W/OA showed no impact on the permeability of MEF. Interestingly, it is reported that 52% of MEF is excreted from urine in the form of glucuronide (American Society of Health-System Pharmacists, 2003). The sulfate conjugate of MEF was found in rat plasma (Lam et al., Citation2007). However, under our analytical method, no Phase II metabolites of MEF were detected in Caco-2 samples, which might be due to higher affinity to hepatic UGTs rather than those abundant in intestine such as UGT 1A8 and UGT 1A10 or the species difference between humans and rats (Cheng et al., Citation1998; Strassburg et al., Citation1997). Further enzymatic reactions in human intestinal sub-cellular fractions and recombinant human UGTs or sulfotransferases (SULTs) are warranted to verify the metabolic pathways of MEF in human intestinal epithelium.
By the action of cyclooxygenases (COX-1 and COX-2), arachidonic acid is catalyzed into a series of bioactive metabolites such as prostaglandin E2 which would induce inflammation and pain (Giuliano & Warner, Citation2002). MEF could selectively inhibit COX-2 (Cryer & Feldman, Citation1998). B, BG, W and OA were reported to directly inhibit the activity of COX-2, or lower COX-2 gene expression based in RAW 264.7 murine macrophages, sub-chronic skin model or NIH/3T3 mouse skin fibroblast (Chen et al., Citation2000, Citation2001; Chi & Kim, Citation2005; Woo et al., Citation2006). The inhibition of COX-2 would reduce PGE2 production. Therefore, the concentration of PGE2 was chosen as the indicator of an anti-inflammation effect. A vehicle control group has been employed. The production of PGE2 with the incubation of blank DMSO was quantified to be 881.39 ± 25.83 pg/ml, which indicated that three flavones as well as MEF could effectively inhibit the production of PEG2. Notably, the inhibitory effect of MEF at 100 μM was comparable to those of B/W/OA at 10 μM in vitro (300.96 ± 20.64 pg/ml); whereas, the concentration of PGE2 in rat plasma was 6.88 ± 0.45 pg/ml after oral administration of MEF at 40 mg/kg which was much lower than the concentration in rats treated with RS. This discrepancy between in vitro and in vivo might be due to the poor bioavailability of bioactive flavones in RS. Besides, the in vivo situation is much more complicated. Drugs undergo intenser phase II metabolism due to the wider surface area of rat intestine and hepatic metabolism. Excretion from urine is also a cause for which drug concentration could not be maintained high enough to induce differences in anti-inflammation effects. Since the majority of flavonoids undergo intestinal and hepatic Phase II metabolism, the conjugated metabolites are their major form of existence in systemic circulation. Therefore, further studies about the pharmacological effects of these Phase II metabolites are of great necessity.
The clinical dose of MEF is 250 mg/50 kg = 5 mg/kg for humans. According to guidance by FDA (Office of New Drugs in the Center for Drug Evaluation and Research at Food and Drug Administration, 2005), the dose is conversed to be 5 × 6.25 = 31.25 mg/kg for the rat. Considering the loss in drug preparation, a dose of 40 mg/kg for MEF was employed. Since RS extract is a mixture of various flavones, it is difficult to take each flavone into account to set the dosing schedule. In addition, the oral bioavailability of flavones in RS is quite low based on our previous studies. In order to maintain sufficient flavone concentration in vivo, the dose of RS extract to MEF was set at a ratio of 1:5 in the current study. In our pilot study, the impact of MEF on the anti-inflammation effect of RS was conducted after their single co-administration. Blood was taken at 8 h after MEF was administrated and the concentrations of PEG2 were quantified to be 127.15 ± 0.71, 104.69 ± 7.72 and 106.14 ± 12.17 pg/ml in RS, MEF and the mixture group, respectively. No difference was observed among these groups, which might be due to insufficient exposure to the compounds since MEF and the bioactive flavones in RS were all quickly eliminated. As a result, the multiple co-administrations were further employed to ensure the plasma concentration of each compound reached the steady state. The synergic effect by RS and MEF on the production of PEG2 was found to be time-dependent. Four hours after MEF administration, the concentration of PEG2 in the mixture group was lower than the RS and MEF groups. However, although the co-administration of MEF could significantly reduce the production of PGE2 in comparison with RS single group, the inhibition effect was not significantly different between the MEF group and the mixture group at the other time points. The current pharmacodynamic study demonstrated that the anti-inflammatory effect of MEF was much stronger than RS in vivo. With a Tmax of 2–4 h, the impact of MEF on the production of PGE2 declined with time due to the gradually decreased plasma concentration during its elimination phase, which might lead to the time-dependent pharmacodynamic profile. The current pharmacodynamic study was conducted in a regular rat model. Inflammation was induced after the drug entered systemic circulation by the addition of lipopolysaccharide, which might not be sensitive enough to exert the synergistic effect. In order to better simulate the pathological condition and drug effect, an inflammatory rat model should be developed such as inflammatory Lewis rats (more susceptible to inflammation-related diseases). Further investigations with regard to the synergistic effect in pharmacodynamics are warranted upon clarification of pharmacokinetic profiles of tested compounds under inflammatory conditions.
Conclusion
MEF could influence the absorption and metabolism of major flavones and their co-administration would lead to potential alterations in anti-inflammatory effects.
Declaration of interest
The authors are grateful for CUHK 478607 and CUHK 480010 from the Research Grants Council of the Hong Kong SAR, China and the China Postdoctoral Science Foundation Grant (2012M521806).
References
- American Society of Health-System Pharmacists. (2003). Nonsteroidal anti-inflammatory agents. In: AHFS Drug Handbook, 2nd ed. Bethesda: Lippincott Williams & Wilkins, 1902–2021
- Artersson P, Karlsson J. (1991). Correlation between oral drug absorption in humans and apparent drug permeability coefficients in human intestinal epithelial (Caco-2) cells. Biochem Biophys Res Commun 175:880–5
- Brideau C, Kargman S, Liu S, et al. (1996). A human whole blood assay for clinical evaluation of biochemical efficacy of cyclooxygenase inhibitors. Inflamm Res 45:68–74
- Chen YC, Shen SC, Chen LG, et al. (2001). Wogonin, baicalin, and baicalein inhibition of inducible intric oxide synthase and cyclooxygenase-2 gene expressions induced by nitric oxide synthase inhibitors and lipopolysaccharide. Biochem Pharmacol 61:1417–27
- Chen Y, Yang L, Lee TJ. (2000). Oroxylin A inhibition of lipopolysaccharide-induced iNOS and COX-2 genen expression via suppression of nuclear factor-kappaB activation. Biochem Pharmacol 59:1445–57
- Cheng Z, Radominska-Pandya A, Tephly TR. (1998). Cloning and expression of human UDP-glucuronosyltransferase (UGT) 1A8. Arch Biochem Biophys 356:301–5
- Chi YS, Kim HP. (2005). Suppression of cyclooxygenase-2 expression of skin fibroblasts by wogonin, a plant flavone from Scutellaria radix. Prostaglandins Leukot Essent Fatty Acids 72:59–66
- Cryer B, Feldman M. (1998). Cyclooxygenase-1 and cyclooxygenase-2 selectivity of widely used nonsteroidal anti-inflammatory drugs. Am J Med 104:413–21
- Giuliano F, Warner TD. (2002). Origins of prostaglandin E2: Involvments of cyclooxygenase (COX)-1 and (COX)-2 in human and rat systems. J Pharmacol Exp Ther 303:1001–6
- Knights KM, Winner LK, Elliot DJ, et al. (2009). Aldosterone glucuronidation by human liver and kidney microsomes and recombinant UDP-glucuronosyltransferases: Inhibition by NSAIDs. Br J Clin Pharmacol 68:402–12
- Lam W, Loi CM, Atherton J, et al. (2007). Application of in-line liquid chromatography-accurate radioisotope counting-mass spectrometry (LC-ARC-MS) to evaluate metabolic profile of [3H]-mefenamic acid in rat plasma. Drug Metab Lett 1:179–88
- Li C, Zhang L, Wo SK, et al. (2012a). Pharmacokinetic interactions among major bioactive components in Radix Scutellariae via metabolic competition. Biopharm Drug Dispos 33:487–500
- Li C, Zhang L, Zhou L, et al. (2012b). Comparison of intestinal absorption and disposition of structurally similar bioactive flavones in Radix Scutellariae. AAPS J 14:23–34
- Li C, Zhou L, Lin G, Zuo Z. (2009). Contents of major bioactive flavoens in proprietary traditional Chinese medicine products and reference herb of Radix Scutellariae. J Pharm Biomed Anal 50:298–306
- Li KL, Sheu SJ. (1995). Determination of flavonoids and alkaloids in the scute-coptis herb couple by capillary electrophoresis. Anal Chim Acta 313:113–20
- Mano Y, Usui T, Kaminura H. (2007). Comparison of inhibition potentials of drugs against zidovudine glucuronidation in rat hepatocytes and liver microsomes. Drug Metab Dispos 35:602–6
- Mano Y, Usui T, Kamimura H. (2008). Species differences in inhibition potential of nonsteroidal anti-inflammatroy drugs against estradiol 3beta-glucuronidation between rats, dogs, and humans. J Pharm Sci 97:2805–10
- Mohamed ME, Frye RF. (2011). Effects of herbal supplments on drug glucuronidation. Review of clinical, animal, and in vitro studies. Planta Med 77:311–21
- Office of New Drugs in the Center for Drug Evaluation and Research at Food and Drug Administration. (2005). Estimating the Maximum Safe Starting Dose in Initial Clinical Trials for Therapeutics in Adult Healthy Volunteers. Guidance for Industry. Page 19. Available from: http://www.fda.gov/downloads/Drugs/Guidances/UCM078932.pdf [last accessed 27 Aug 2013]
- Oqa EF, Sekine S, Shitara Y, Horie T. (2012). P-Glycoprotein mediated efflux in Caco-2 cell monolayers: The influence of herbals on digoxin transport. J Ethnopharmacol 144:612–17
- Shang X, He X, He X, et al. (2010). The genus Scutellaria an ethnopharmacological and phytochemical review. J Ethnopharmacol 128:279–313
- Strassburg CP, Oldhafer K, Manns MP, Tukey RH. (1997). Differential expression of the UGT1A locus in human liver, biliary, and gastric tissue: Identification of UGT1A7 and UGT1A10 transcripts in extrahepatic tissues. Mol Pharmacol 52:212–20
- Wiwattanawongsa K, Tantishaiyakul V, Lomlin L, et al. (2005). Experimental and computational studies of epithelial transport of mefenamic acid ester prodrugs. Pharm Res 22:721–7
- Woo KJ, Lim JH, Suh SI, et al. (2006). Differential inhibitory effects of baicalein and baicalin on LPS-induced cyclooxygenase-2 expression through inhibition of C/EBPbeta DNA-binding activity. Immunobiology 211:359–68
- Zhang L, Lin G, Kovacs B, et al. (2007). Mechanistic study on the intestinal absorption and disposition of baicalein. Eur J Pharm Sci 31:221–31