
Abstract
Context: Andrographis paniculata (Burm.f.) Nees (Acanthaceae) is widely used in tribal medicine in India and some other countries for multiple clinical applications. It contains andrographolide (AG) (diterpenoid lactone), a major phytomarker which probably accounts for its medicinal properties.
Objective: This study investigates the site-specific distribution of AG in different tissues of rats and its pharmacokinetic parameter evaluation by using a validated liquid chromatography tandem mass spectrometry (LC-MS/MS) method.
Materials and methods: A simple and sensitive LC-MS/MS method has been developed and validated to quantify the presence of AG in plasma and various tissues of rat following oral administration of A. paniculata extract and AG in a dose of 133.33 and 100 mg/kg/day, respectively, for four weeks.
Results: The present study showed that the highest concentration of AG was in kidney (156.12 ng/g) followed by liver, spleen and brain while almost same concentration was found in heart and lung. The apparent Cmax, Tmax, elimination half-life and total exposure (AUC0–α) were 115.81 ng/ml, 0.75, 2.45 and 278.44 ngh/ml, respectively.
Conclusion: This was an attempt to determine the presence of AG (a known biomarker) in tissues such as kidney, heart, lungs, brain and plasma of rats using a validated LC-MS/MS method. Furthermore, the observed reduced concentration in plasma and various tissues from 1 to 8 h might be attributed to relatively rapid elimination or distribution of AG from the central compartment.
Introduction
Andrographolide (AG), a diterpenoid lactone was first isolated as a major constituent of Andrographis paniculata (Burm.f.) Nees (Acanthaceae) (AP) and chemically it is 3-(2-(decahydro-6-hydroxy-5-(hydroxymethyl)-5,8a-dimethyl-2-methylenenaphthyl)ethylidene) dihydro-4-hydroxyfuran-2(3H)-one. AP is an erect annual herb found in India, China and Southeast Asia. Despite its wide spread medicinal use, very few comprehensive and validated pharmacokinetic analysis are available in the literature. Besides being used as a single herb, it is also a common constituent of a variety of ayurvedic preparations used in the treatment of chronic malaria, diabetes, hepatic toxicity, common cold and loss of appetite (Cáceres et al., Citation1999; Chopra et al., Citation1982; Elango et al., Citation2011; Kapil et al., Citation1993; Misra et al., Citation1992; Rahman et al., Citation1999; Raina et al., Citation2013; Roxas & Jurenka, Citation2007; Zhang & Tan, Citation2000). Pharmacokinetic studies constitute an important phase in the development of new medicine and also to determine the disposition process (absorption, distribution, metabolism and elimination) for selection of the most appropriate route of administration and dose regimen (Liu et al., Citation2010; Uys et al., Citation2010).
Tissue distribution studies are essential in providing information on distribution and accumulation of the compound and/or metabolites, especially in relation to potential sites of action. For most compounds, it is expected that multi-dose tissue distribution studies with sufficient sensitivity and specificity provide an adequate assessment of tissue distribution and the potential site for accumulation (Lanao & Fraile, Citation2005).
Quite a number of techniques have already been reported by investigators for the quantification of AG in rat and human plasma by high-performance liquid chromatography (HPLC) (Pinthong et al., Citation1991) or liquid chromatography tandem mass spectrometry (LC-MS/MS) (Yang et al., Citation2012) and solid phase extraction for sample preparation which are expensive eventually owing to longer runtime for analysis (Wangboonskul et al., Citation2006).
The objective of the present work was to develop a simple, accurate, sensitive LC-MS/MS method with appropriate validation for determination and quantification of AG in rat plasma, liver, heart, spleen, kidney, testes and lung tissues using diclofenac as an internal standard (IS). The total run time for analysis was short with simpler process of sample preparation, i.e., protein precipitation. These parameters are generally believed to be advantageous as compared with the previously published methods. The method was also validated for selectivity, sensitivity, recovery, linearity, accuracy, precision and stability according to the USFDA guideline, 2001. The method was successfully applied for oral pharmacokinetic and tissue distribution study to determine AG concentration.
Materials and methods
Chemicals and reagents
HPLC grade water (resistivity of 18 Mcm) generated from Milli Q water purification system (Billerica, MA), methanol (9093–68) and acetonitrile (9017–03) from JT Baker (Center Valley, PA), diclofenac sodium (037K1588) from Sigma (St. Louis, MO) and AG from Natural Remedies (Bangalore, India) were purchased. Blank rat plasma with tripotassium ethylenediamine tetraacetic acid (EDTA-K3) anticoagulant was used throughout the analysis.
Instrumentation and chromatographic conditions
The LC system consisting of LC-20ADvp pump (Shimadzu, Kyoto, Japan), CTC PAL (HTS) autosampler and the mass spectrometer composed of turbo ion spray with atmospheric pressure ionization source (API-4000, AB Sciex Instruments, Foster City, CA). Detection and quantification were performed using Analyst 1.4.2.
LC-MS/MS analysis was performed on a C18 column (2 × 30 mm, 5 µm) from phenomenex (Torrance, CA) with a flow rate of 0.8 ml/min at room temperature. The mobile phases were 2 mM ammonium acetate in water (A) and a mixture of acetonitrile and solvent A (80:20, v/v) (B). The gradient elution program was as follows: first 66 s only A for washing and then 24 s for gradient up to 100% B and it was continued for next 60 s and total run time was 3 min. The column eluent was split and approximately 350 µl was introduced in the mass spectrometer.
Preparation of A. paniculata extract and isolation of AG
The plant was collected from Tarakeshwar, West Bengal, India in the month of October and was identified by Dr. S. Biswas, Botanical Survey of India (the voucher specimen number is CNH/83/2012/Tech. II/901). The leaves of the plant were air-dried and powdered using a mechanical grinder followed by cold maceration with petroleum ether for 24 h. After filtering, the residue was treated with chloroform for 48 h and then filtered again. The final residue was treated with methanol for three days with occasional shaking. The methanol extract was filtered and concentrated in a rotary evaporator and the yield of the extract was found to be 0.30–0.38% (w/w) in terms of dried leaves. The preparation and isolation of AG were performed according to the method described by Senthil et al. (Citation2003).
Preparation of stock and working solutions
The primary stock solution of AG and IS, diclofenac, were prepared by dissolving the accurately weighed standard compounds in dimethyl sulfoxide to obtain 2 mg/ml for each. The working stock solutions of AG for a calibration curve were 50 000, 25 000, 12 500, 6250, 3125, 1562.5, 781.25, 390.63 and 195.31 ng/ml and for quality control (QC) samples the concentrations were 600, 10 000 and 40 000 ng/ml. Throughout the experiment, the concentration of IS in samples was maintained at 300 ng/ml.
Preparation of calibration standards and QC samples
A nine point standard curve was prepared by spiking 2 µl from working stock to 98 µl blank plasma/tissue homogenate to get the final concentration of 1000.00, 500.00, 250.00, 125.00, 62.50, 31.25, 15.63, 7.81 and 3.91 ng/ml while that of the IS in plasma and tissues was 300 ng/ml. Three levels of QC samples along with lower limit of quantitation (LLOQ) at a concentration of 3.91, 12 ng/ml (lower QC, LQC), 200 ng/ml (medium QC, MQC) and 800 ng/ml (high QC, HQC) for AG were also prepared following the appropriate dilution method. QC samples were bulk spiked and then aliquoted into pre-labeled 2-ml polypropylene vials and stored at −20 °C.
Sample preparation
The aliquot of 0.05 ml of plasma/tissue homogenate samples was taken into Eppendorf tube and direct precipitation of matrix was done by adding ice cold acetonitrile (3× of sample volume) containing IS. The mixture was vortexed in a thermomixer and centrifuged at 5000 rpm for 10 min at 10 °C. Clear supernatant (120 µl) was transferred to a 96-deep well plate and diluted with 50 µl of water. After thorough mixing, the final plate was loaded into the CTC PAL autosampler cabinet and 20 µl aliquots were used for LC-MS/MS.
Method validation
The bioanalytical method was validated for selectivity, linearity, precision, accuracy, recovery, matrix effect (ME) and stability according to the principles of Food and Drug Administration (FDA) industry guide. Three precision accuracy batches were processed on three separate days. Each batch included two sets of calibration standards and six replicates of LLOQ, LQC, MQC and HQC samples to evaluate the accuracy and precision of the method.
Selectivity and specificity
The selectivity and specificity were carried out by analyzing six different blank plasma and tissue samples from rats to demonstrate the lack of chromatographic interference from endogenous plasma or tissue components at the retention time of the analyte and IS.
LLOQ, linearity
LLOQ was determined from the analyte peak signal and baseline noise level. Calibration curves were acquired by plotting the peak-area ratio of the analyte to that of IS (300 ng/ml) against the nominal concentration of calibration standards. Analyte concentrations of different CC and QC samples were prepared as mentioned above. Results were fitted to the linear regression analysis to determine the linearity of calibration curve. Acceptance criterion for each back-calculated standard concentration was ±15% deviation from the nominal value except at LLOQ, which was set at ±20% (U.S. F.D.A., Citation2001).
Accuracy and precision
For determination of within day accuracy for this method, analysis was performed on three different sets (QC levels – LQC, MQC, HQC and LLOQ) at different time intervals of the same day taking six replicates for each such set. Similarly, inter-day precision and accuracy of the method was determined by analyzing three such different sets on three different days within a period of two weeks. The criteria for acceptability of these data included accuracy within ±15% deviations (SD) from nominal values and the precision of within ±15% coefficient of variation (CV) for QC, while for LLOQ it was not exceeding ±20% of SD (Dams et al., Citation2003; U.S. F.D.A., Citation2001).
Extraction recovery and ME
The extraction recovery of AG at three different QC levels (n = 6) was evaluated by comparing the peak area of analyte spiked in blank matrix with the peak area of analyte spiked in post-extracted matrix. ME (n = 6) was determined by comparing the corresponding peak area of the analyte from the spiked-after-protein precipitation samples with the standard solution of the analyte in the mobile phase at low, medium and high concentration levels. The extraction recovery and ME for IS were also done at a particular concentration (300 ng/ml).
Stability
Stability study was evaluated as part of the method validation. The processed sample stability was evaluated by comparing the precipitated samples that were injected immediately (time = 0 h), with the samples that were re-injected after loading into the autosampler at 4 °C for 24 h. Stability of analyte in the biomatrix after 8 h exposure on bench-top at two QC levels in six replicates was determined and analyzed against freshly spiked standard curve and QC samples for short-time stability. The long-term stability of spiked rat plasma/tissues homogenate was stored at −20 °C and evaluated by analyzing all QC samples that were stored at −20 °C for 30 days together with freshly spiked standard curve and QC samples. The freeze-thaw stability was conducted by comparing the stability samples that had been frozen and thawed thrice, with the plasma/tissues samples thawed once (U.S. F.D.A., Citation2001).
Animals used
The care and use of laboratory animals were strictly in accordance with the guidelines prescribed by the Institutional Ethical Committee (constituted under the guidelines of Committee for the Purpose of Control and Supervision of Experiments on Animals, CPCSEA, and Reg. No. 367).
Application to pharmacokinetic and tissue distribution studies
To assess the applicability of the present work, the validated method was used to analyze plasma and different tissue samples after oral administration of A. paniculata extract (APE) at 133.33 mg/kg/day and AG at 100 mg/kg/day for four weeks.
In vivo tissue distribution studies with AG was carried out in male Wister rats. The control group contained eight rats and treated with vehicle (0.5% w/v sodium-carboxymethyl cellulose solution in water containing 0.025% v/v Tween 80) only. Forty-eight animals were divided into two groups (A and B) each having 24 animals. Furthermore, 24 animals of both the groups were divided into three sub-groups (A-I, A-II and A-III, n = 8; B-I, B-II and B-III, n = 8) for three different time points, e.g., 1, 3 and 8 h, respectively. All animals of Groups A and B were administered AG and APE at 100 and 133.33 mg/kg/day for four weeks, respectively. The animals (150–200 g) were maintained for 28 days on 18% casein-containing semisynthetic diet with free access to food and water. On the 28th day, animals of all the groups and sub-groups were anaesthetized at predetermined time points (1, 3 and 8 h) and blood samples were collected by cardiac puncture. The animals were then sacrificed by cervical decapitation to collect different tissue samples. About 150 µl of the collected blood was centrifuged at 3500 rpm for 10 min at 10 °C for plasma and around 100 µl of the whole blood was stored for bioanalysis to determine the blood to plasma ratio. All tissues were rinsed immediately after collection with ice-cold saline and then stored at −80 °C until bio-analysis using LC-MS/MS.
In separate pharmacokinetic studies (n = 4), AG was administered orally at 30 mg/kg to determine the pharmacokinetic parameters. Approximately 100 µl of blood was collected with EDTA-K3 via retro orbital plexus at each time point (0, 0.17, 0.5, 1, 2, 3, 6, 8 and 10 h). The blood sample was centrifuged at 3500 rpm for 5 min at 15 °C to harvest plasma which was stored at −20 °C until bioanalysis.
Pharmacokinetic analysis
The concentration of AG in plasma and tissues was determined at each time point. The pharmacokinetic parameters, like area under the plasma-concentration-time curve from zero to last measurable plasma sample time and to infinity (AUC0–8 and AUC0–inf), maximum concentration (Cmax), time to reach maximum concentration (Tmax), elimination rate constant (Kel) and elimination half-life (t1/2), were determined by the non-compartmental method. The area under the plasma concentration-time curve (), AUC0–tlast, was calculated from time 0 to the last quantifiable time point, using the linear trapezoidal method. The area from the tlast to infinity (AUCtlast-α) was estimated as Cest(last)/Kel, where Cest(last) represents the quantifiable concentration at the last time point. The total area under the curve (AUC0–α) was estimated as the sum of AUC0–last and AUCtlast-α.
Results
Optimization of chromatography
Chromatographic conditions were optimized to obtain high sensitivity, reproducibility and sample throughput. A silica-based C8, phenyl-hexyl and C18 column remain a good starting point because of their high efficiency and stability. Analyte was retained on C18 column which benefited the retention time of the analyte due to its hydrophobicity. Mobile phase systems consisted of 0.1% v/v acetic acid or formic acid in water or 2 mM ammonium acetate buffer or acetonitrile or methanol or in various proportions of the following were tested whereas flow rate and loop size were fixed at 0.8 ml/min and 25 µl, respectively. Adjustment of pH was also investigated for proper retention, peak shape as well as improved response. Finally, optimal separation as well as with good sensitivity and peak shape was achieved with solvent A = 2 mM ammonium acetate buffer and solvent B = acetonitrile:solvent A (80:20 v/v) at a flow rate of 0.8 ml/min in C18 column.
Specificity and selectivity
Negative electrospray mass spectra of AG showed an intense [MH]− ion at m/z = 349.20 and for diclofenac [M − H]− ion at m/z = 294.10. After fragmentations of these parents (Q1) ions produce most intense daughter ions at m/z = 287.10 and 214.10, respectively ( and ). The collision energy and other optimized parameters for analyte and IS are reported ().
Figure 1. (a) Q1 and product ion scan data of AG in LC-MS/MS and (b) Q1 and product ion scan data of diclofenac in LC-MS/MS.
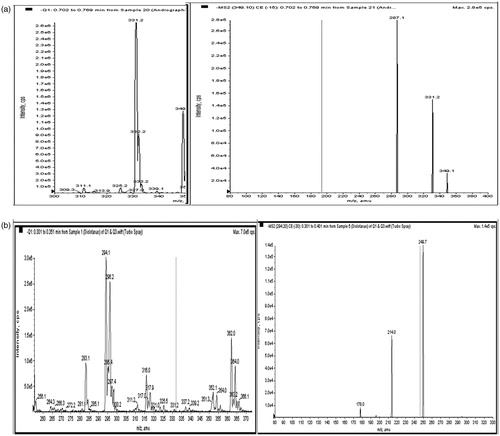
Table 1. MS parameters of AG and diclofenac.
Separation and specificity
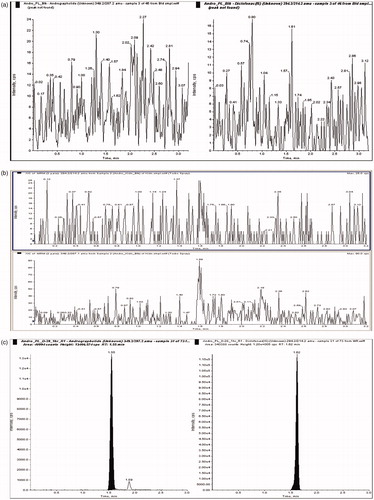
No interference peak was found in the multiple reaction monitoring profile for double blank plasma and tissues samples ( and ) at the retention time for both IS and analyte. The total chromatographic run time was 3.0 min ().
Figure 2. (a) Representative chromatogram of blank plasma, (b) representative chromatogram of blank kidney and (c) representative chromatogram of unknown plasma sample with analyte and IS.
Limit of quantitation, linearity
LLOQ was established as 3.91 ng/ml for plasma and all other tissues. The curve was linear in the concentration range 3.91–1000.00 ng/ml with average regression coefficient of 0.9956 ± 0.0013. The calibration curve shows with the average slope and intercept 0.0100 (±0.006) and 0.0109 (±0.004), respectively. All back calculated values indicate excellent accuracy and precision.
Accuracy and precision
The back calculated concentration values for QCs run in six triplicate at each concentration level on six different occasions were used to assess the accuracy and precision of the assay. The between-run and within-run precision for the various concentrations ranged from 1.74–8.72% to 1.28–7.38% and accuracy were between 89.33–108.44% and 91.67–107.93%, respectively ().
Table 2. Intra-day and inter-day accuracy and precision of AG.
Stability
Stability results, accuracy and back calculated concentration, are presented in . In rat plasma and tissue homogenate, AG was found to be stable for three freeze-thaw cycles and up to one month frozen time at −20 °C. The experimental data of the stability tests, i.e., autosampler (24 h), bench-top (8 h), three repeated freeze-thaw cycles and at −20 °C for 30 days, showed that predicted concentrations for analyte at LQC, MQC and HQC samples deviated within the assay variability limits (±15%) of the nominal concentrations ().
Table 3. Stability study data of AG.
Recovery and ME
Six replicates of LQC and HQC samples were prepared for recovery as well as ME determination. Mean extraction recovery and ME were at LQC, MQC and HQC levels and ranged from 82.47–0.15% to 1.82–4.37% ().
Table 4. Extraction recovery and ME of AG.
Application to pharmacokinetic and tissue distribution studies
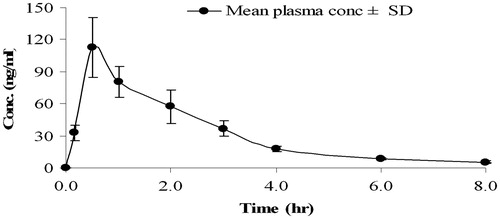
The apparent maximum plasma concentration Cmax (115.81 ± 17.56 ng/ml) and the time at which it was achieved Tmax (0.75 ± 0.29 h) were determined. The area under the plasma concentration-time curve, i.e., AUC0–tlast (259.16 ± 32.68 ngh/ml) and AUC0-α (278.44 ± 28.64 ngh/ml) were also measured. The elimination rate constant, Kel, and the terminal half-life, T1/2, after oral administration were found to be 0.29 ± 0.06 h−1 and 2.45 ± 0.44 h, respectively ().
Figure 3. Mean (±SD) plasma exposure profile of AG after oral administration at 30 mg/kg in rats.
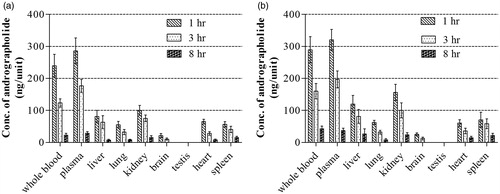
The distribution of AG in the various tissues, namely, liver, kidney, lung, brain, testes, spleen, heart and body fluids like whole blood and plasma were determined. The maximum concentration was observed at 1 h in all tissues and plasma upon oral administration of AG to rats at a dose 100 mg/kg/day for 28 days. Highest concentration of AG was found to be in kidney (156.12 ± 25.37 ng/g) among all the tissues irrespective of the groups () and AG was present in the brain (21.26 ± 6.64 ng/g) at 1 h this indicates that it can cross the blood brain barrier.
Figure 4. (a) Concentration of AG in whole blood, plasma and different tissues after multiple oral administration of AG and (b) concentration of AG in whole blood, plasma and different tissues after multiple oral administration of APE.
Discussion and conclusion
In this study, the pharmacokinetic parameters of AG were determined and the apparent Cmax reported was 115.81 ng/ml and it was achieved within 0.75 h post dose. The elimination half-life was found to be 2.45 h while the total exposure (AUC0–α) was 278.44 ngh/ml.
The tissue distribution study revealed highest tissue concentration of AG in kidney followed by liver, spleen and brain while almost same concentration was observed in heart and lung. The observed reduced area under the plasma profile and decrease in the tissue concentration level from 1 to 8 h might be attributed to relatively rapid elimination or distribution from the central compartment.
AG is well known as a potent hepatoprotective agent (Nagalekshmi et al., Citation2011; Visen et al., Citation1993). Accordingly, from the tissue distribution study, a pronounced exposure of AG in liver was observed after multiple administrations of both AG and APE. Furthermore, maximum AG concentration was found to be 156.12 ng/g of tissue in the kidney at 1 h which gradually decreased to 23.65 ng/g of tissue at 8 h. From our study, among other organs, kidney is likely to be the most susceptible organ for AG toxicity, if any. The presence of AG in kidney as compared with liver might be attributed to high capability for xenobiotic metabolism in the latter tissue besides other factors such as lipophilicity and protein binding. During the study, AG was not detectable in testes throughout the time course this is particularly important in the context of reports on anti-fertility activity of this plant (Akbarsha & Murugaian, Citation2000; Raina et al., Citation2013). Similarly, reports on anti-malarial activity of AG (Cáceres et al., Citation1999; Chopra et al., Citation1982; Kapil et al., Citation1993; Misra et al., Citation1992; Rahman et al., Citation1999) are also available, although, the blood to plasma ratio of AG was found to be 0.93 which indicates AG was not sufficiently presented/accumulated in the red blood cells.
The LC-MS/MS method described here has significant advantages over the other techniques already described in the literature. The method has proved to be sensitive, simple and it was successfully applied for pharmacokinetics and tissue distribution study of AG in experimental rats.
Therefore, this study suggests a precise and validated method for assessment of absorption, distribution and elimination of A. paniculata following oral administration expressed in terms of one of its major biomarkers, andrographolide in experimental rats.
Declaration of interest
We express our sincere thanks to Government of India -- AICTE (RPS) and University Grants Commission (UPE) for financial assistance.
References
- Akbarsha MA, Murugaian P. (2000). Aspects of the male reproductive toxicity/male antifertility property of andrographolide in albino rats: Effect on the testis and the cauda epididymidal spermatozoa. Phytother Res 14:432–5
- Cáceres DD, Hancke JL, Burgos RA, et al. (1999). Use of visual analogue scale measurements (VAS) to assess the effectiveness of standardized Andrographis paniculata extract SHA-l0 in reducing the symptoms of common cold. A randomized double blind-placebo study. Phytomedicine 6:217–23
- Chopra RN, Chopra IC, Handa KL, et al. (1982). Indigenous Drugs of India. New Delhi, India: CBS Publishers
- Dams R, Huestis MA, Lambert WE, et al. (2003). Matrix effect in bioanalysis of illicit drugs with LC-MS/MS: Influence of ionization type sample preparation and biofluid. J Am Soc Mass Spectrom 14:1290–4
- Elango G, Rahuman AA, Kamaraj C, et al. (2011). Efficacy of medicinal plant extracts against malarial vector, Anopheles subpictus Grassi. Parasitol Res 108:1437–45
- Food and Drug Administration of the United States. (2001). Guidance for Industry-Bioanalytical Method Validation. US Department of Health and Human Services, Center for Drug Evaluation and Research (CDER), Center for Veterinary Medicine (CVM). Available from: http://www.fda.gov/downloads/Drugs/Guidances/ucm070107.pdf [last accessed 8 Mar 2011]
- Kapil A, Koul IB, Banerjee SK, et al. (1993). Antihepatotoxic effects of major diterpenoid constituents of Andrographis paniculata. Biochem Pharmacol 46:182–5
- Lanao JM, Fraile MA. (2005). Drug tissue distribution: Study methods and therapeutic implications. Curr Pharm Des 11:3829–45
- Liu J, Zhao T, Tan H, et al. (2010). Pharmacokinetic analysis of in vivo disposition of heparin-superoxide dismutase. Biomed Pharmacotherapy 64:686–91
- Misra P, Pal NL, Guru PY, et al. (1992). Antimalarial activity of Andrographis paniculata (Kalmegh) against Plasmodium berghei NK65 in Mastomys natalensis. Pharm Biol 30:263–74
- Nagalekshmi R, Menon A, Chandrasekharan DK, et al. (2011). Hepatoprotective activity of Andrographis paniculata and Swertia chirayita. Food Chem Toxicol 49:3367–73
- Pinthong T, Bunyagidi C, Mounhong A, et al. (1991). HPLC determination of andrographolide, neoandrographolide and dehydroandrographolide in biological fluid. Siriraj Hosp Gaz 43:760–8
- Rahman NNNA, Furuta T, Kojima S, et al. (1999). Antimalarial activity of extracts of Malaysian medicinal plants. J Ethnopharmacol 64:249–54
- Raina AP, Kumar A, Pareek SK, et al. (2013). Evaluation studies on kalmegh (Andrographis paniculata nees). Acta Horticulturae 972:117–20
- Roxas M, Jurenka J. (2007). Colds and influenza: A review of diagnosis and conventional, botanical, and nutritional considerations. Altern Med Rev 12:25–48
- Senthil KK, Thirugnanasambantham P, Viswanathan S, et al. (2003). An HPLC method for the estimation of andrographolide in rabbit serum. Indian J Pharmacol 35:109–12
- Uys JD, Manevich Y, DeVane LC, et al. (2010). Preclinical pharmacokinetic analysis of NOV-002, a glutathione disulfide mimetic. Biomed Pharmacother 64:493–8
- Visen PK, Shukla B, Patnaik GK, et al. (1993). Andrographolide protects rat hepatocytes against paracetamol-induced damage. J Ethnopharmacol 40:131–6
- Wangboonskul J, Daodee S, Jarukamjorn K, et al. (2006). Pharmacokinetic study of Andrographis paniculata tablets in healthy Thai male volunteers. Thai Pharm Health Sci J 1:209–18
- Yang CHU, Xiaolin BAI, Zhang S, et al. (2012). Pharmacokinetics of andrographolide dripping pills, a modern Chinese herb medicine, by LC-MS/MS method in Beagle dogs. Lat Am J Pharm 31:904–8
- Zhang XF, Tan BK. (2000). Anti-diabetic property of ethanol extract of Andrographis paniculata in streptozotocin-diabetic rats. Acta Pharmacol Sin 21:1157–64