
Abstract
Context: Hepatic fibrosis ultimately leads to cirrhosis if not treated effectively. Hepatic stellate cells (HSC) are a main mediator of hepatic fibrosis through the accumulation of extracellular matrix proteins. Suppression activation of passaged HSC has been proposed as therapeutic strategies for the treatment and prevention of hepatic fibrosis.
Objective: To evaluate the effect of hydroxysafflor yellow A (HSYA), an active chemical compound derived from the flowers of Carthamus tinctorius L. (Compositae), on HSC inhibition, and to begin elucidating underlying mechanisms.
Materials and methods: Primary HSCs were isolated from rats by in situ pronase/collagenase perfusion. Culture-activated HSCs were treated with or without HSYA at 30 μM in the presence or absence of PD98059 for 48 h, and then cell proliferation was measured by MTS assays. Messenger RNA (mRNA) expression was quantified by polymerase chain reaction, and protein was quantified by Western blots or enzyme-linked immunosorbent assays.
Results: HSYA significantly inhibits culture-activated HSC proliferation in a dose-dependent and time-dependent manner with an IC50 value of 112.79 μM. HSYA (30 μM) induce the suppression of HSC activation, as indicated by decreases in contents of type I alpha collagen in HSC-cultured media and expression of α-smooth muscle actin protein in culture-activated HSC by 55 and 71%, respectively. HSYA (30 μM) also caused significant decreases in mRNA expression of type III alpha collagen in HSC by 28%. HSYA (30 μM) suppresses myocyte enhancer factor 2 C (MEF2C) expression both at its mRNA and protein levels by 60 and 61%, respectively. Further study demonstrated that HSYA (30 μM) caused significant decreases in p-ERK5 by 49%. Blocking extracellular signal-regulated protein kinase 5 (ERK5) activity by XMD 8--92, an ERK5 inhibitor, markedly abrogated the inhibitive effects of HSYA on HSC activation, and blocked the HSYA-mediated MEF2C down-regulation.
Conclusions: HSYA suppress HSC activation by ERK5-mediated MEF2C down-regulation and makes it a potential candidate for prevention and treatment of hepatic fibrogenesis.
Introduction
Hepatic fibrosis occurs as a wound healing process after many forms of chronic liver injury, including alcohol abuse, hepatitis C virus infection, diabetes or obesity (Mee et al., Citation2010; Purohit et al., Citation2004). Without effective treatments, reversible hepatic fibrosis at an early stage leads to irreversible cirrhosis. Suppression of hepatic fibrogenesis has attracted the attention of researchers from a therapeutic perspective (Debernardi-Venon et al., Citation2007). Hepatic stellate cells (HSC) play a key role in the pathogenesis of hepatic fibrosis (Trebicka et al., Citation2010). Upon stimulation, quiescent HSC become activated and trans-differentiate into myofibroblast-like cells characterized by several key phenotypic changes, including an increase in proliferation, accumulation of extracellular matrix (ECM) and expression of α-smooth muscle actin (α-SMA) (Zheng et al., Citation2007). Recently, many reports have shown that the molecular mechanism for activation of HSC was involved in the intracellular signal cascade and transcriptional regulation of certain genes, for example, mitogen-activated protein kinases (MAPKs) in HSC (Che et al., Citation2007).
Studies from several laboratories have shown that early induction of myocyte enhancer factor 2 (MEF2) messenger RNA (mRNA) and protein accompanied culture-induced HSC activation (Wang et al., Citation2004). Increased MEF2 protein also correlated with fibrosis in vivo (Kimura et al., Citation2010). MEF2 interference RNA significantly inhibited expression of α-SMA, type I alpha collagen (Col I) and proliferating cell nuclear antigen (Wang et al., Citation2004). Extracellular signal-regulated protein kinase 5 (ERK5) is an atypical MAPK, as it is more than twice the size of the other MAPKs owing to a very large C-terminal domain. It is suggested that the role of this unique C-terminal tail is to regulate MEF2 transcriptional activities and ERK5 subcellular localization (Liu et al., Citation2003). Upon exposure to various stimuli, ERK5 is activated by phosphorylation downstream of MEK5 (Clark et al., Citation2011). An important step in deciphering the function of ERK5 is to identify its downstream targets, and myocyte enhancer factor 2 C (MEF2C) is among the best-characterized substrates of ERK5 (Wang et al., Citation2009). ERK5 enhances expression of the MEF2 family of transcription factors thereby inducing MEF2-dependent gene expression and accelerates cell proliferation (Iñesta et al., Citation2010). The discovery that ERK5 is an important contributor to cell survival has increased interest in this signaling pathway (Drew et al., Citation2011).
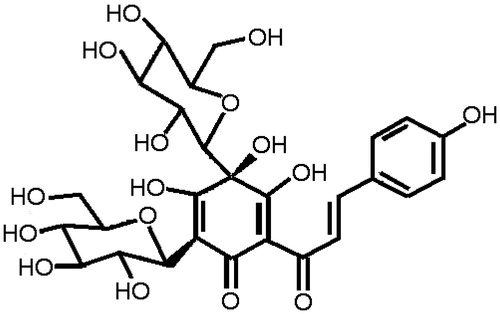
Natural products have established a strong position as leads for drug discovery (Mishra & Tiwari, Citation2011). Hydroxysafflor yellow A (HSYA) (for its structure, see ) is a major constituent in the hydrophilic fraction of Carthamus tinctorius L. (Compositae) (known as Honghua in China), which has been traditionally widely used in traditional Chinese medicine for the treatment of cirrhosis in clinics (Bie et al., Citation2010). Several lines of evidence indicate that polyphenolic components, including curcumin (Wang et al., Citation2012), resveratrol (Di Pascoli et al., Citation2013) and epigallocatechin-3-gallate (Zhen et al., Citation2007), have antifibrosis activity on liver.
Figure 1. Chemical structure of HSYA.
The aim of this study is to investigate the hypothesis that interruption of the ERK5 signaling pathways by HSYA might block gene expression of MEF2C in culture-activated HSC. Results in this report support our hypothesis.
Materials and methods
Stellate cell isolation and culture
HSC were isolated from normal male Sprague-Dawley retired breeder rats (less than 400 g) by sequential pronase and collagenase perfusion as previously described (Weiskirchen & Gressner, Citation2005). Purity was assessed by vitamin A autofluorescence that is unique to this cell type; routinely, it was >95%. Primary cells were incubated in Dulbecco’s modified Eagle medium (DMEM) with 20% of fetal bovine serum (FBS), and passaged cells were maintained in DMEM supplemented with 10% FBS on Petri dishes to allow culture activation. Culture-activated HSC with four to nine passages were used for experiments in this report.
Treatment of cells
HSYA (98% purity by HPLC; Ruigu Bio-Technology Company, Shanghai, China) were dissolved in sterile pyrogen-free water at a concentration of 1 × 10⁻⁴ M. These solutions were subjected to autoclaving for 15 min. Semi-confluent HSC were serum-starved for 24 h in DMEM containing 0.4% FBS. Cells were maintained in DMEM with 10% FBS in the presence or absence of HSYA at the indicated concentrations for the indicated times. To determine whether the ERK5 signaling pathway is involved in the inhibitive effect of HSYA on HSC activation, XMD 8--92 (5 μM), a selective inhibitor of ERK5, was used, which was added to cell cultures 30 min before treatment with HSYA (Yang et al., Citation2010). Control HSC was treated with the appropriate amount of sterile pyrogen-free water. At the end of treatment, cells were washed with cold phosphate buffered solution and scraped in the sterile pyrogen-free water.
Determination of cell proliferation
Semi-confluent HSC were serum-starved for 24 h in DMEM containing 0.4% FBS. Cells at 2 × 10⁴ cells/well were maintained in DMEM with 10% FBS in the presence or absence of HSYA at the indicated concentrations for the indicated times. After cells were washed, cell proliferation was determined by the MTS assay using the CellTiter 96 Aqueous Non-Radioactive Cell Proliferation Assay (Promega, Madison, WI) according to the manufacturer’s instructions. In brief, MTS solution (20 μl) was added into each well and incubated at 37 °C for 1 h. Absorbance at 490 nm was measured using a microplate reader (Safire2, Tecan Group Ltd., Maennedorf, Switzerland). Results were expressed as the relative percentage of living HSC using respective values for the cells with no treatment as 100%.
Enzyme-linked immunosorbent assay analyses
Concentrations of Col I in culture media were measured using Rat Col I EIA kits (R&D Systems Inc., Minneapolis, MN) according to the manufacturer’s instructions. The culture medium was collected, centrifuged to remove cellular debris and stored at −70 °C until assay for Col I. A microplate reader (Safire2, Tecan Group Ltd.) was used to measure absorbance at 450 nm, and concentrations were calculated using a standard curve developed simultaneously with study samples. Results were normalized to the cell number.
Real-time polymerase chain reaction
Total RNA was isolated from culture-activated HSC using RNAiso Reagent kit (Takara Biotechnology, Dalian, China). The concentration and purity of RNA were determined using a UV-2550 spectrophotometer (Shimadzu, Kyoto, Japan). Synthesis of cDNA was performed using ExScriptTM RT kit (Takara Biotechnology) according to the manufacturer’s recommendation. Gene expression levels were measured by real-time polymerase chain reaction (PCR) on an ABI7300 real-time PCR system (Applied Biosystems, Carlsbad, CA) with SYBR® Premix Ex TaqTM (Takara Biotechnology). Primers were designed by Primer Express Software version 3.0 (Applied Biosystems) (). Threshold cycle (Ct) data were collected using the Sequence Detection Software version 1.2.3 (Applied Biosystems). We used the comparative 2−ΔΔCt method (Livak & Schmittgen, Citation2001) to calculate the relative fold changes normalized against the glyceraldehyde-3-phosphate dehydrogenase (GAPDH).
Table 1. Primers used for real-time PCR detection of gene expression.
Western blot analysis
Proteins were extracted from culture-activated HSC using Cytoplasmic Protein Extraction kit (Beyotime Biotechnology, Haimen, China), and protein concentrations were determined using the BCA Protein Assay kit according to the protocol provided by the manufacturer (Beyotime Biotechnology). Protein (20 μg) was separated by 10% sodium dodecyl sulfate polyacrylamide gel electrophoresis and transferred to nitrocellulose membrane. Membrane was blocked with 5% milk in TBST (10 mM Tris, pH 7.4, 150 mM NaCl and 0.05% Tween 20) for 2 h at room temperature and then incubated overnight at 4 °C with antibodies against COL1A1 and GAPDH, which were obtained from Santa Cruz Biotechnology (Santa Cruz, CA), antibody against α-SMA, which were obtained from Abcam (Cambridge, MA), as well as antibodies to MEF2C, phospo-ERK5 and ERK5, which were obtained from Cell Signaling Technology (Beverly, MA). Protein bands of interest were developed using an ECL Western blotting kit (Amersham Biosciences, Piscataway, NJ). Equal protein loading was verified by immunoblotting for GAPDH. The level of target protein bands was densitometrically determined by using an AlphaImagerTM 2200 using the SpotDenso function of AlphaEaseFCTM Software version 3.1.2 (Witec, Littau, Switzerland). The variation in the density was expressed as fold changes compared to the control in the blot.
Statistical analysis
Unless indicated differently, the results are presented as means ± S.D. of at least three independent experiments. All data were analyzed employing one-way analysis of variance with Student--Newman--Keuls post hoc test using SPSS 13.0 software (SPSS Inc., Chicago, IL). The criterion for statistical significance was set at p < 0.05.
Results
HSYA inhibits culture-activated HSC proliferation
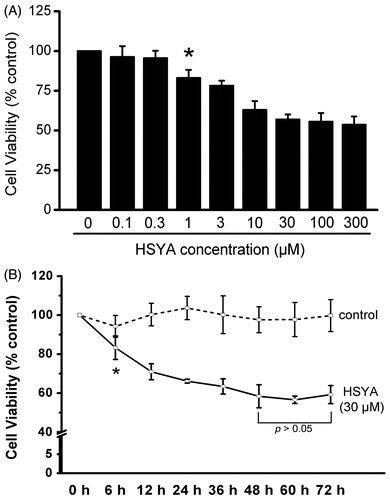
Culture-activated HSC proliferation was determined by the MTS assay. As shown in , compared with the control, HSYA at 0.1, 0.3, 1, 3, 10, 30, 100 and 300 μM for 48 h reduced viability by 4, 5, 17, 22, 38, 44, 45 and 47%, respectively. The inhibitory effect of HSYA on proliferation of culture-activated HSC was observed at a minimal concentration of 1 μM HSYA and reached maximal levels at 30 μM HSYA. HSYA at 30 μM was chosen for the following experiments. As shown in , compared with the control, 30 μM HSYA caused a significant time-dependent inhibition in cellular proliferation by 17, 30, 34, 37, 42, 44 and 41% at 6, 12, 24, 36, 48, 60 and 72 h, respectively. It reached a plateau after 48 h of treatment. Longer times of HSYA incubation yielded no further decrease in cells viability. Therefore, 48-h incubation time was used in all further experiments.
Figure 2. HSYA inhibit culture-activated HSC viability in a dose- and time-dependent manner. Culture-activated HSC were either treated with HSYA at indicated concentrations for 48 h (A), or HSYA at 30 µM for the indicated times (B), and then assayed for cell viability using the MTS assay. Cell viability was expressed as percentage changes compared to that in the control either without HSYA treatment (A) or at the time 0 (B). Data represent means ± SD of three separate experiments. Significance is defined as follows: *p < 0.05 compared with control by ANOVA.
HSYA suppresses the expression of Col I and type III alpha collagen collagen in culture-activated HSC
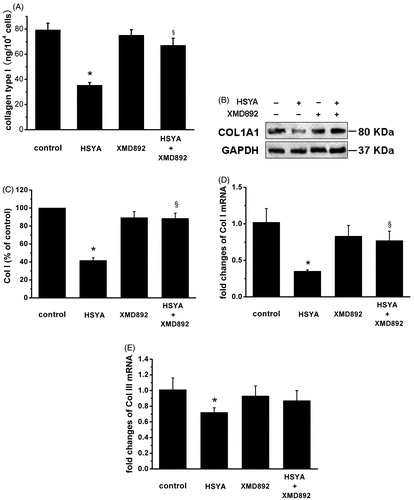
HSC activation is characterized by expression of overproduction of ECM components, including Col I and type III alpha collagen (Col III) (Cho et al., Citation2004). To assess the effect of HSYA on ECM production in culture-activated HSC, real-time PCR analysis were performed for mRNA expression of Col I and Col III, enzyme-linked immunosorbent assay and Western blot analysis for content of Col I in culture-activated HSC or HSC-cultured media. As shown in , compared with control, HSYA caused significant decreases in contents of Col I in HSC-cultured media by 55%. No effect of 5 μM XMD 8–92 on contents of Col I could be observed. However, XMD 8–92 significantly reversed the inhibitive effect of HSYA on Col I secretion. HSYA significantly repress Col I as assessed by Western blot analysis (). Similar trends were also observed in Col I mRNA transcript (). As shown in , compared with control, HSYA caused significant decreases in mRNA expression of Col III in HSC by 28%. XMD 8–92 tend to reverse the inhibitive effect of HSYA on mRNA expression of Col III. However, lack of Col III antibody prevented from conducting the experiments for detection of Col III content. These data suggest the possibility that the inhibitory effect of HSYA on Col I and Col III contents may involve ERK5 signaling.
Figure 3. HSYA suppresses Col I and Col III collagen in culture-activated HSC. Culture-activated HSC, after serum-starvation for 24 h, were treated with HSYA (30 µM), XMD 8–92, or a combination of HSYA and XMD 8–92 for 48 h, then cell and culture supernatants were harvested. (A) Collagen type I secretion was measured in culture supernatants by ELISA, and concentrations were calculated by means of a standard curve. (B) HSC lysates were then subjected to Western blotting to evaluate COL1A1, and blots were reprobed with antibody against GAPDH to assure equal sample loading. The blots shown are representatives of three independent experiments with similar results. (C) The density of bands representing COL1A1 was quantified by densitometric scanning from three independent experiments. Total RNA extracted from culture-activated HSC was used to determine mRNA expression of Col I (D) and Col III (E) by real-time PCR and normalized to the expression of GAPDH. Results represent means ± SD of three separate experiments. Significance is defined as follows: *p < 0.05 compared with control; §p < 0.05 compared with cells treated with HSYA alone by ANOVA.
HSYA induce the suppression of HSC activation
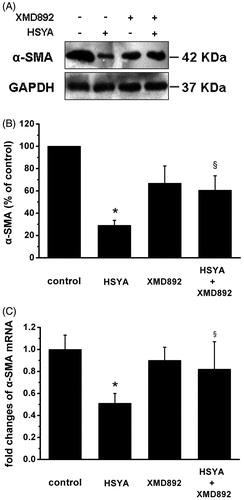
Alpha-SMA is the unique marker for activated HSC (Abergel et al., Citation2006). To further evaluate the effect of HSYA on activation of HSC, real-time PCR and Western blot analysis were performed for gene expression of α-SMA in culture-activated HSC. As shown in , compared with control, HSYA caused significant decreases in protein expression of α-SMA by 71%. XMD 8–92 alone also led to similar decreases in protein expression of α-SMA by 34%. Compared with cells treated with HSYA, cells treated with both HSYA and XMD 8–92 partially abrogated the inhibitive effect of HSYA protein expression of α-SMA. Consistent with the results of protein levels, real-time PCR revealed that HSYA treatment significantly inhibit mRNA expression of α-SMA in culture-activated HSC (). These findings support the notion that the inhibition of HSC activation by HSYA might be at least partially mediated by ERK5 signaling.
Figure 4. HSYA suppresses α-SMA gene expression in culture-activated HSC. Culture-activated HSC, after serum-starvation for 24 h, were treated with HSYA (30 µM), XMD 8–92 or combination of HSYA and XMD 8–92 for 48 h, then cell were harvested. (A) HSC lysates were then subjected to Western blotting to evaluate α-SMA and blots were reprobed with antibody against GAPDH to assure equal sample loading. The blots shown are representatives of three independent experiments with similar results. (B) The density of bands representing α-SMA was quantified by densitometric scanning from three independent experiments. (C) Total RNA extracted from culture-activated HSC was used to determine mRNA expression of α-SMA by real-time PCR and normalized to the expression of GAPDH. Results represent means ± SD of three separate experiments. Significance is defined as follows: *p < 0.05 compared with control; §p < 0.05 compared with cells treated with HSYA alone by ANOVA.
HSYA suppresses MEF2C in culture-activated HSC
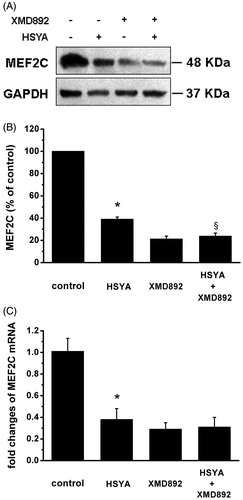
MEF2 as a key nuclear mediator participate in the pathologic process of fibrogenesis in vivo (Konno et al., Citation2010). Therefore, we examined the effect of HSYA on MEF2C gene expression in culture-activated HSC. As shown in , HSYA or XMD 8–92 significantly inhibited protein expression of MEF2C in culture-activated HSC by 61 and 80%, respectively. The inhibitory effects of HSYA on MEF2C appeared to be enhanced by XMD 8–92. These observations were confirmed at the transcription level by real-time PCR analyses ().
Figure 5. HSYA suppresses MEF2C gene expression in culture-activated HSC. Culture-activated HSC, after serum-starvation for 24 h, were treated with HSYA (30 µM), XMD 8–92 or combination of HSYA and XMD 8–92 for 48 h, then cell were harvested. (A) HSC lysates were then subjected to Western blotting to evaluate MEF2C, and blots were reprobed with antibody against GAPDH to assure equal sample loading. The blots shown are representatives of three independent experiments with similar results. (B) The density of bands representing MEF2C was quantified by densitometric scanning from three independent experiments. (C) Total RNA extracted from culture-activated HSC was used to determine mRNA expression of MEF2C by real-time PCR and normalized to the expression of GAPDH. Results represent means ± SD of three separate experiments. Significance is defined as follows: *p < 0.05 compared with control; §p < 0.05 compared with cells treated with HSYA alone by ANOVA.
The blockade of activation of the ERK5 by HSYA results in the reduction in culture-activated HSC proliferation
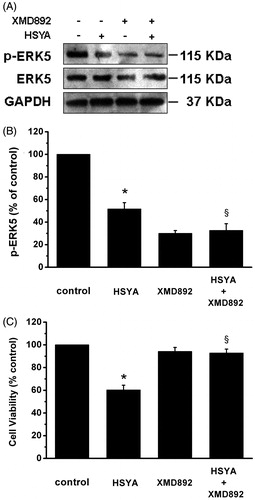
Substantial evidence has indicated that the activation of ERK5 stimulates HSC proliferation (Rovida et al., Citation2008). As shown in , compared with control, HSYA caused significant decreases in p-ERK5 by 49%, and XMD 8–92 robustly inhibit phosphorylation of ERK5. The inhibitory effects of XMD 8–92 on phosphorylation of ERK5 appeared not to be enhanced by with HSYA. This inhibition pattern of p-ERK5 correlated closely with the pattern of MEF2C presented above. Cell proliferation was determined by numbers of viable cells using MTS assays. As demonstrated in , HSYA significantly reduced viability of culture-activated HSC, as expected. XMD 8–92 itself had no detectable effect on viability of culture-activated HSC. Culture-activated HSC treated with both HSYA and XMD 8–92 apparently abrogated the inhibitory effect of HSYA on cell viability. Thus, ERK5 plays an important, but not exclusive role, in the inhibitive effects of HSYA on culture-activated HSC proliferation.
Figure 6. HSYA suppresses phosphorylation of ERK5 in culture-activated HSC. Culture-activated HSC, after serum-starvation for 24 h, were treated with HSYA (30 µM), XMD 8–92 or a combination of HSYA and XMD 8–92 for 48 h, then cell were harvested. (A) HSC lysates were then subjected to Western blotting to evaluate phosphorylation of ERK5, and blots were reprobed with antibodies against total ERK5 and also GAPDH to assure equal sample loading. The blots shown are representatives of three independent experiments with similar results. (B) The density of bands representing phosphorylated ERK5 was quantified by densitometric scanning from three independent experiments. (C) Cell viability was determined using the MTS assay, and untreated cells were assumed to be vital (100% viability). Results represent means ± SD of three separate experiments. Significance is defined as follows: *p < 0.05 compared with control; §p < 0.05 compared with cells treated with HSYA alone by ANOVA.
Discussion
To elucidate the molecular mechanism underlying HSYA action on culture-activated HSC, which is known to play an important role in the development of liver fibrosis, in this report, we observed, for the first time, effects of the HSYA, a major component of safflower, on passaged HSC activation and its underlying mechanism in vitro. Our results revealed that HSYA markedly suppressed the activation of cultured HSC as inhibiting the α-SMA, Col I and Col III. In addition, HSYA significantly inhibited culture-activated HSC proliferation. HSYA interrupted ERK5 signaling in culture-activated HSC by reducing the phosphorylation of ERK5 and its downstream MEF2C gene, leading to the inhibition of HSC activation.
An effective therapeutic strategy for suppressing liver fibrosis should improve the overall prognosis of patients with chronic liver diseases (Yoshiji et al., Citation2011). At this time, there is no ideal drug therapy for hepatic fibrosis (Pradeep Kumar et al., Citation2011). Identifying the active chemical ingredients of ancient medicines and the molecular targets of those ingredients may provide new strategies for the development of target drugs (Lee, Citation2000). Safflower is the dry flower of C. tinctorius that has been used in traditional Chinese medicine as the blood-circulation-promoting drug for treating trauma, hepatic cirrhosis and cardiovascular diseases (Yang et al., Citation2009). We have previously demonstrated that HSYA is the effective ingredient of safflower shown to exhibit antifibrosis in vivo through an unknown mechanism (Zhang et al., Citation2011). In our prior studies, we have found that inhibition of the ERK5 pathway by HSYA largely blocks CCl4-induced HSCs activation in rats (Zhang et al., Citation2012). Protective effects of HSYA against hepatic fibrosis might be at least partially mediated by the inhibition of MEF-2 C in vivo (Zhang et al., Citation2012). In view of these findings, it is speculated that HSYA might inhibit gene expression of the MEF2C through ERK5 phosphorylation, leading to the reduction in ECM deposition.
In vitro, quiescent primary HSC undergo spontaneous activation when plated on uncoated plastic and attain a myofibroblast-like phenotype with loss of vitamin A and increased expression of α-SMA and collagen, mimicking the process seen in vivo, which provides a good model for elucidating underlying mechanisms of HSC activation and studying potential therapeutic intervention of the process (Herrmann et al., Citation2007). In this report, traditional methods of assessing HSC activation, such as MTS analysis and α-SMA expression, were performed to determine the effectiveness of HSYC on the inhibition of culture-activated HSC. Results from MTS analyses demonstrated that HSYA significantly reduced the culture-activated HSC viability. In addition, results from real-time PCR and Western blot demonstrated that the gene levels of α-SMA were significantly reduced by HSYA, which confirmed the culture-activated HSC viability observations. Both results suggested that HSYA suppress HSC activation in culture-activated HSC. The concentrations (30 μM) required for inhibition of HSC activation in our in vitro system are almost parallel with the HSYA concentrations (23 μM) can be attained in vivo after intravenous infusion (Lv et al., Citation2012; Yang et al., Citation2009).
Hepatic fibrosis, regardless of the cause, is characterized by an increase in ECM constituents (Vaillant et al., Citation2001). The predominant ECM protein synthesized by the HSC in fibrosis is Col I and Col III (Fu et al., Citation2011). Our study demonstrated that HSYA significantly reduced, as expected, the mRNA expression level of Col I and Col III and the contents of Col I in culture-activated HSC. The addition of XMD 8–92 abrogated the inhibitory effect of HSYA on gene expression of Col I and ColIII in culture-activated HSC. These results demonstrated the role of ERK5 in mediating the inhibitory effect of HSYA on gene expression of Col I and Col III in culture-activated HSC. The level of ECM is mainly determined by ECM synthesis and ECM degradation (Parsons et al., Citation2004). This report focused on the effect of HSYA on ECM synthesis. Additional experiments are ongoing to evaluate the role of HSYA in regulating gene expression and activity of enzymes involved in ECM degradation, including matrix metalloproteinases and tissue inhibitor of metalloproteinases.
MEF2 transcription factor acts as a lynchpin in the transcriptional circuits that control cell differentiation and organogenesis (Potthoff & Olson, Citation2007). The spectrum of genes activated by MEF2 in different cell types depends on extracellular signaling and on co-factor interactions that modulate MEF2 activity (Xu et al., Citation2006). Wang et al. (Citation2004) reported that the expression of MEF2C protein is low in quiescent HSC. With the culture-induced activation of HSC, the mRNA and protein of MEF2C increase. MEF2C may regulate α-SMA or Col I expression either directly or indirectly by modulating other regulators. In our experiments, the inhibition of MEF2C protein by HSYA was accompanied by inhibition of steady-state levels of mRNA for MEF2C in culture-activated HSC. This suggests that the mechanism of inhibition by HSYA on MEF2C gene expression may occur at the transcriptional level. It bears emphasis that our results do not exclude the involvement of any other mechanisms in the inhibition of HSC activation by HSYA in culture-activated HSC. Owing to a limited lifespan of primary HSC, it is unlikely to generate and maintain a stable transfectant of primary HSC with high expression of MEF2C. To further confirm the role of MEF2C in the antifibrogenic effect of HSYA, additional experiments are necessary using a stable transfectant of an HSC cell line with inducible expression of MEF2C and expression absence of MEF2C gene in HSC. In addition, further experiments are necessary to clarify downstream transcription factors involved in the regulation of α-SMA, Col I or Col III gene expression.
MEF2 proteins serve as endpoints for multiple signaling pathways and thereby confer signal-responsiveness to downstream target genes (Black & Olson, Citation1998). Up-regulation of MEF2 by MAPKs augments its transcriptional activity, and the MAPK ERK5 serves as a MEF2 co-activator through its signal-dependent direct association with the MEF2 MADS domain (Katsarou et al., Citation2011). However, it is noteworthy that HSYA treatment resulted in a 49% decrease in p-ERK5 in culture-activated HSC. Further experiments confirmed that inhibition of ERK5 by the ERK5 inhibitor, XMD 8–92, mimicked the inhibitory effects of HSYA and reduced protein and mRNA levels of MEF2C in cultured HSCs. HSYA-induced decrease in p-ERK5 was relatively moderate. It appears that the modest decreases in p-ERK5 alone might not fully explain the robust inhibitive action of HSYA on expression of α-SMA. Since MEF2C and ERK5 measurement under knockdown conditions requires very large amounts of cells which are difficult to achieve with primary HSCs, additional experiments are necessary to clarify the underlying mechanisms of the HSYA action using small interfering RNA-mediated knockdown of ERK5 in human LX2 cells or other ERK5 inhibitors. This suggests that the underlying mechanisms are certainly more complex than described in this study. Our results do not exclude possible involvement of any other signaling pathways and mechanisms in the inhibitive action of HSYA on the activation of HSC. Further studies should address this point, which is of interest for the development of other therapeutically relevant ERK5 inhibitors.
Conclusions
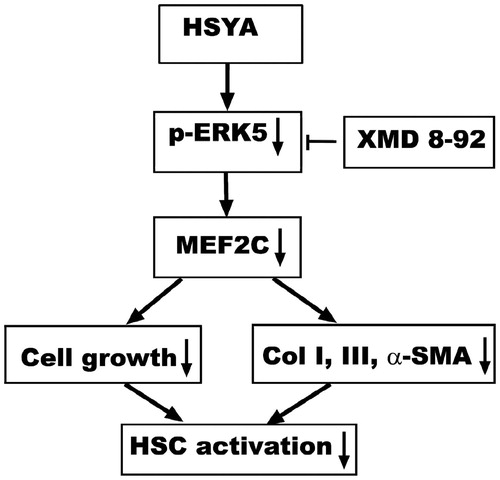
Based on our observations, a simplified pathway is proposed to describe the possible involvement of signaling pathways in the HSYA inhibition of HSC activation, including α-SMA increase, ECM production and cell proliferation. HSYA blocks phosphorylation of ERK5, results in the suppression of gene expression of MEF2C, leading to the reduction in HSC activation ().
Figure 7. A schematic diagram of the role of the HSYA interruption of ERK5-MEF2C signaling pathway in culture-activated HSC. HSYA blocks ERK5 phosphorylation and depress the gene expression of the downstream inter-mediators MEF2C, reduces proliferation and activation of HSC.
Declaration of interest
The authors report no conflicts of interest. The authors alone are responsible for the content and writing of this article.
This research was supported by the National Natural Science Foundation of China (No. 30973925) and the Research Foundation of Education Bureau of Heilongjiang Province, China (Grant No. 12531806).
Acknowledgements
We thank Xiucai Liu for excellent technical assistance and Zhi Pan is thanked for valuable scientific discussion.
References
- Abergel A, Sapin V, Dif N, et al. (2006). Growth arrest and decrease of alpha-SMA and type I collagen expression by palmitic acid in the rat hepatic stellate cell line PAV-1. Dig Dis Sci 51:986–95
- Bie XD, Han J, Dai HB. (2010). Effects of hydroxysafflor yellow A on the experimental traumatic brain injury in rats. J Asian Nat Prod Res 12:239–47
- Black BL, Olson EN. (1998). Transcriptional control of muscle development by myocyte enhancer factor-2 (MEF2) proteins. Annu Rev Cell Dev Biol 14:167–96
- Che J, Chan ES, Cronstein BN. (2007). Adenosine A2A receptor occupancy stimulates collagen expression by hepatic stellate cells via pathways involving protein kinase A, Src, and extracellular signal-regulated kinases 1/2 signaling cascade or p38 mitogen-activated protein kinase signaling pathway. Mol Pharmacol 72:1626–36
- Cho MK, Lee GH, Park EY, Kim SG. (2004). Hyaluronic acid inhibits adhesion of hepatic stellate cells in spite of its stimulation of DNA synthesis. Tissue Cell 36:293–305
- Clark PR, Jensen TJ, Kluger MS, et al. (2011). MEK5 is activated by shear stress, activates ERK5 and induces KLF4 to modulate TNF responses in human dermal microvascular endothelial cells. Microcirculation 18:102–17
- Debernardi-Venon W, Martini S, Biasi F, et al. (2007). AT1 receptor antagonist Candesartan in selected cirrhotic patients: Effect on portal pressure and liver fibrosis markers. J Hepatol 46:1026–33
- Di Pascoli M, Diví M, Rodríguez-Vilarrupla A, et al. (2013). Resveratrol improves intrahepatic endothelial dysfunction and reduces hepatic fibrosis and portal pressure in cirrhotic rats. J Hepatol 58:904–10
- Drew BA, Burow ME, Beckman BS. (2011). MEK5/ERK5 pathway: The first fifteen years. Biochim Biophys Acta 1825:37–48
- Fu R, Wu J, Ding J, et al. (2011). Targeting transforming growth factor βRII expression inhibits the activation of hepatic stellate cells and reduces collagen synthesis. Exp Biol Med 236:291–7
- Herrmann J, Gressner AM, Weiskirchen R. (2007). Immortal hepatic stellate cell lines: Useful tools to study hepatic stellate cell biology and function? J Cell Mol Med 11:704–22.
- Iñesta-Vaquera FA, Campbell DG, Tournier C, et al. (2010). Alternative ERK5 regulation by phosphorylation during the cell cycle. Cell Signal 22:1829–37
- Katsarou K, Tsitoura P, Georgopoulou U. (2011). MEK5/ERK5/mef2: A novel signaling pathway affected by hepatitis C virus non-enveloped capsid-like particles. Biochim Biophys Acta 1813:1854–62
- Kimura TE, Jin J, Zi M, et al. (2010). Targeted deletion of the extracellular signal-regulated protein kinase 5 attenuates hypertrophic response and promotes pressure overload-induced apoptosis in the heart. Circ Res 106:961–70
- Konno T, Chen D, Wang L, et al. (2010). Heterogeneous myocyte enhancer factor-2 (Mef2) activation in myocytes predicts focal scarring in hypertrophic cardiomyopathy. Proc Natl Acad Sci USA 107:18097–102
- Lee KH. (2000). Research and future trends in the pharmaceutical development of medicinal herbs from Chinese medicine. Public Health Nutr 3:515–22
- Liu L, Cavanaugh JE, Wang Y, et al. (2003). ERK5 activation of MEF2-mediated gene expression plays a critical role in BDNF-promoted survival of developing but not mature cortical neurons. Proc Natl Acad Sci USA 100:8532–7
- Livak KJ, Schmittgen TD. (2001). Analysis of relative gene expression data using real-time quantitative PCR and the 2(-Delta Delta CT) method. Methods 25:402–8
- Lv LZ, Tong CQ, Lv Q, et al. (2012). Enhanced absorption of hydroxysafflor yellow A using a self-double-emulsifying drug delivery system: In vitro and in vivo studies. Int J Nanomedicine 7:4099–107
- Mee CJ, Farquhar MJ, Harris HJ, et al. (2010). Hepatitis C virus infection reduces hepatocellular polarity in a vascular endothelial growth factor-dependent manner. Gastroenterology 138:1134–42
- Mishra BB, Tiwari VK. (2011). Natural products: An evolving role in future drug discovery. Eur J Med Chem 46:4769–807
- Parsons CJ, Bradford BU, Pan CQ, et al. (2004). Antifibrotic effects of a tissue inhibitor of metalloproteinase-1 antibody on established liver fibrosis in rats. Hepatology 40:1106–15
- Potthoff MJ, Olson EN. (2007). MEF2: A central regulator of diverse developmental programs. Development 134:4131–40
- Pradeep Kumar S, Medhi S, Asim M, et al. (2011). Evaluation of adefovir & lamivudine in chronic hepatitis B: Correlation with HBV viral kinetic, hepatic-necro inflammation & fibrosis. Indian J Med Res 133:50–6
- Purohit V, Russo D, Coates PM. (2004). Role of fatty liver, dietary fatty acid supplements, and obesity in the progression of alcoholic liver disease: Introduction and summary of the symposium. Alcohol 34:3–8
- Rovida E, Navari N, Caligiuri A, et al. (2008). ERK5 differentially regulates PDGF-induced proliferation and migration of hepatic stellate cells. J Hepatol 48:107–15
- Trebicka J, Hennenberg M, Odenthal M, et al. (2010). Atorvastatin attenuates hepatic fibrosis in rats after bile duct ligation via decreased turnover of hepatic stellate cells. J Hepatol 53:702–12
- Vaillant B, Chiaramonte MG, Cheever AW, et al. (2001). Regulation of hepatic fibrosis and extracellular matrix genes by the th response: New insight into the role of tissue inhibitors of matrix metalloproteinases. J Immunol 167:7017–26
- Wang ME, Chen YC, Chen IS, et al. (2012). Curcumin protects against thioacetamide-induced hepatic fibrosis by attenuating the inflammatory response and inducing apoptosis of damaged hepatocytes. J Nutr Biochem 23:1352–66
- Wang RM, Zhang QG, Li J, et al. (2009). The ERK5-MEF2C transcription factor pathway contributes to antiapoptotic effect of cerebral ischemia preconditioning in the hippocampal CA1 region of rats. Brain Res 1255:32–41
- Wang X, Tang X, Gong X, et al. (2004). Regulation of hepatic stellate cell activation and growth by transcription factor myocyte enhancer factor 2. Gastroenterology 127:1174–88
- Weiskirchen R, Gressner AM. (2005). Isolation and culture of hepatic stellate cells. Methods Mol Med 117:99–113
- Xu J, Gong NL, Bodi I, et al. (2006). Myocyte enhancer factors 2A and 2C induce dilated cardiomyopathy in transgenic mice. J Biol Chem 281:9152–62
- Yang Q, Deng X, Lu B, et al. (2010). Pharmacological inhibition of BMK1 suppresses tumor growth through promyelocytic leukemia protein. Cancer Cell 18:258–67
- Yang Z, Yang J, Jia Y, et al. (2009). Pharmacokinetic properties of hydroxysafflor yellow A in healthy Chinese female volunteers. J Ethnopharmacol 124:635–8
- Yoshiji H, Noguchi R, Ikenaka Y, et al. (2011). Cocktail therapy with a combination of interferon, ribavirin and angiotensin-II type 1 receptor blocker attenuates murine liver fibrosis development. Int J Mol Med 28:81–8
- Zhang YB, Dong HY, Zhao XM, et al. (2012). Hydroxysafflor yellow A attenuates carbon tetrachloride-induced hepatic fibrosis in rats by inhibiting ERK5 signaling. Am J Chin Med 40:481–94
- Zhang Y, Guo J, Dong H, et al. (2011). Hydroxysafflor yellow A protects against chronic carbon tetrachloride-induced liver fibrosis. Eur J Pharmacol 660:438–44
- Zhen MC, Wang Q, Huang XH, et al. (2007). Green tea polyphenol epigallocatechin-3-gallate inhibits oxidative damage and preventive effects on carbon tetrachloride-induced hepatic fibrosis. J Nutr Biochem 18:795–805
- Zheng S, Yumei F, Chen A. (2007). De novo synthesis of glutathione is a prerequisite for curcumin to inhibit hepatic stellate cell (HSC) activation. Free Radic Biol Med 43:444–53