
Abstract
Context: Primary dysmenorrhea (PDM), a common, clinically heterogeneous endocrine disorder affecting young women, is associated with endocrinopathy and metabolic abnormalities. The Xiang–Fu–Si–Wu Decoction (XFSWD) is a traditional Chinese medicine preparation used to treat PDM.
Objective: In the current study, a plasma metabonomics method based on the ultra-high-performance liquid chromatography-quantitative time-of-flight-mass spectrometry (UHPLC-Q-TOF-MS) system was employed to examine the mechanism of XFSWD action in PDM.
Materials and methods: Estradiol benzoate (0.01 g/kg/d) and oxytocin (5 mL/kg) were used to create the dysmenorrhea rat model. Based on the chromatographic data of plasma samples at different time-points following oral administration of XFSWD mixed in water (37.8 g crude herbs/kg) on day 7, partial least square (PLS) and discriminate analysis (DA) were applied to visualize group differentiation and marker selection.
Results: Systemic changes occurring in PDM reflect alterations in not only uterus function but also whole-body metabolism. The XFSWD was effective as a therapeutic agent for PDM by reflect metabolic pathway. Prostaglandins and lysophospholipids were identified as two marker types for oxytocin-induced dysmenorrhea syndrome, including LysoPC(18:4), LysoPE(22:2/0:0), LysoPC(17:0), PGJ2, 11-deoxy-11-methylene-PGD2, 15-deoxy-δ-12,14-PGJ2, LysoPC(20:3), etc. Specifically, the concentrations of prostaglandins compounds (PGJ2, 11-deoxy-11-methylene-PGD2, 15-deoxy-δ-12,14-PGJ2) were increased while those of lysophospholipid compounds [lysoPC(18:4), LysoPE(22:2/0:0), LysoPC(17:0)] were decreased to a significant extent (p < 0.05) in dysmenorrheal rats. Upon treatment with the XFSWD at 12 h, the concentrations of lysophospholipids showed no significant differences (P > 0.05) between the model and normal groups. The lysophospholipid levels were restored. Lysophospholipids were the key factors in phospholipid metabolism. Thus, disruption of phospholipids metabolism appears critical for the development of dysmenorrhea. The XFSWD exerted its effects by interfering with the sphingolipid metabolic pathway.
Discussion and conclusions: The metabonomics method presents a promising tool to treat PDM in animal models, and may be applicable for clinical treatment of the human disease in the future.
Introduction
Primary dysmenorrhea (PDM, menstrual pain without pelvic abnormality) is one of the most common gynaecological disorders in young women (Doubova et al., Citation2007). Hyperactivity of the myometrium with accompanying uterine ischemia is considered critical in the causation of pain. Prostaglandins appear to be significantly involved in the development of myometrial hyperactivity. Other critical factors, such as ovarian hormones, cervical factors, vasopressin, nerves, and psychological factors, not only act ultimately through prostaglandin release, but may also directly affect the myometrium and blood flow (Akerlund, Citation2002; Nigam et al., Citation1991).
Chinese medicinal therapy is a feasible alternative treatment for dysmenorrhea (Hsu et al., Citation2006). The Xiang−Fu−Si−Wu Decoction (XFSWD) created by Lian-fu Liang from the Qing Dynasty of China has been widely used to treat syndromes of static blood in gynecological diseases, such as PDM, in clinical practice with significant efficacy over hundreds of years. This prescription is composed of seven Chinese medical materials [Angelica sinensis (Oliv.) Diels. (Apiaceae), Ligusticum chuanxiong Hort. (Apiaceae), Paeonia lactiflora Pall. (Ranunculaceae), Rehmannia glutinosa Libosch. (Scrophulariaceae), Cyperus rotundus L. (Cyperaceae), Aucklandia lappa Decne (Asteraceae), and Cordalis yanhusuo W. T. Wang (Papaveraceae)] containing hundreds of compounds. Identification of potential markers of active pharmacophore or toxicity in the systemic circulation is a part of the drug discovery and development process. It is therefore essential to determine and identify the pharmacokinetic and metabolic characteristics of the decoction constituents. However, this may be complicated, as the complex components of the decoction interact with their metabolites in vivo. Moreover, during the profiling process, the endogenous matrix influences the limit of detection and accuracy, making it difficult to clarify the precise decoction metabolites (Couchman & Morgan, Citation2011; Srinivas, Citation2006).
Although reports in the literature on the pathophysiological process of PDM to date have been based on clinical experiments, limited animal models of PDM are available. In the current study, estradiol benzoate and oxytocin were used to generate a dysmenorrhea rat model (Liu et al., Citation2011). Ultra-high-performance liquid chromatography-quantitative time-of-flight-mass spectrometry (UHPLC-Q-TOF-MS) with multivariate statistical analysis was developed for the metabolic analysis of animal models. UHPLC has facilitated dramatic improvements in the chromatographic performance for complex mixture separation. Moreover, UHPLC coupled to mass spectrometry (UHPLC-MS) has become the powerhouse of pharmaceutical and biotechnology industries for metabolic profiling of drugs (Wilson et al., Citation2005). However, metabolite identification is a time-consuming process requiring an experienced researcher. Multivariate statistical analysis has been employed to detect drug metabolites in biological fluids without prior knowledge of the chemical structure of the compounds under test (Plumb et al., Citation2003; Tao et al., Citation2008). Several studies have confirmed the utility of UHPLC-Q-TOF-MS coupled with multivariate statistical analysis in metabonomic evaluation of animal models to determine the efficacy of traditional Chinese medicine formulae (Cheng et al., Citation2010; Li et al., Citation2010; Tong et al., Citation2011).
To our knowledge, no previous studies have documented global systems biology research on the use of metabonomic techniques to investigate the metabolic profiles of PDM model rats with XFSWD intervention. Systemic changes occurring in PDM reflect alterations in not only uterus function but also whole-body metabolism. Consequently, better understanding of the metabolic pathways that are directly affected during PDM may provide a rational basis for the development of conventional medicinal therapies.
Materials and methods
Chemicals and materials
HPLC-grade acetonitrile for UHPLC analysis was obtained from Tedia (Fairfield, OH). Formic acid of AR grade was purchased from the Shanghai Reagent Company (Shanghai, China). Double-distilled water was used. All other reagents were of analytical grade.
Angelicae sinensis Radix was collected in July 2008 from Min Xian (Gansu, China). Chuanxiong Rhizoma, Paeoniae Radix Alba, Rehmanniae Radix Praeparata, Cyperi Rhizoma, Aucklandiae Radix, and Corydalis Rhizoma were purchased from Nanjing Medicinal Material Company (Nanjing, China).
All crude herbs were authenticated by the corresponding author. Voucher specimens (nos. NJUTCM 200807201–2008072007) were kept in the Herbarium of Nanjing University of Chinese Medicine, Nanjing, PR China.
The reference compounds, such as caffeic acid, ferulic acid, tetrahydropalmatine, and berberine, were purchased from the National Institute for the Control of Pharmaceutical and Biological Products (Beijing, China).
Animals
Twenty female Sprague−Dawley rats (220−250 g) were obtained from Shanghai Slac Laboratory Animal Co. Ltd. (Shanghai, China). The rats were kept in air-conditioned animal quarters at a temperature of about 24 °C and a relative humidity of 50−65%, with free access to food and water until 12 h prior to experiments. Animal welfare and experimental procedures strictly conformed to the Guide for the Care and Use of Laboratory Animals (National Research Council, Citation2011) and the related ethics regulations of Nanjing University of Chinese Medicine.
Preparation of XFSWD
A mixture of raw materials of Rehmanniae Radix Preparatum, Angelicae sinensis Radix, Chuanxiong Rhizoma, Paeoniae Radix Alba, Cyperi Rhizoma, Corydalis Rhizoma, and Aucklandiae Radix at weight ratios of 4:3:1.5:1.5:1.5:1.5:1 (6000, 4500, 2250, 2250, 2250, 2250, and 1500 g) were crushed into small pieces. The mixture was refluxed with 210 L water for 2 h twice. Filtrates were combined and concentrated below 70 °C to obtain a specific volume at a 1:1 ratio (w/w, weight of all constituent herbs and extract filtrates) under vacuum. Overall, 95% ethanol was added to extract filtrates until ethanol concentration was adjusted to 80%. Ethanol was removed below 70 °C under vacuum to obtain filtrate volumes. The fraction was dissolved in water at a concentration of 1.89 g crude herbs/mL and administered to rats, and the metabolites appearing in rat plasma were determined.
In vivo analysis
Animals were randomly divided into four groups (A, normal control group, n = 5; B, dysmenorrheal syndrome model group, n = 5; C, normal group with XFSWD treatment, n = 5; D, dysmenorrheal syndrome model group with XFSWD treatment, n = 5).
The dysmenorrhea syndrome model group was injected with estradiol benzoate (0.01 g/kg/d) subcutaneously for 6 d and oxytocin (5 mL/kg) administered via peritoneal injection on day 7 in groups B and D. Each rat was placed in an individual cage. The dose of crude plant material of the XFSWD for an individual is 42 g/d according to the folk remedies. Taking the specific surface area difference between human and rats into consideration, the clinically equivalent dosage of crude herbs for rats was 3.78 g crude herbs/kg/d. Accordingly, an oral dose of 37.8 g crude herbs/kg XFSWD was administered in groups C and D on day 7. For rats in groups A and B, 200 µL blood samples were collected via the posterior venous plexus in heparinized Eppendorf tubes. Blood samples from rats in groups C and D were collected at 30 min, 2 h, 6 h, and 12 h following the oral administration of XFSWD. After centrifugation at 3000 rpm for 10 min, plasma samples were obtained and frozen at 20 °C until analysis.
Laboratory tests
According to the behavior scoring criteria of Schmauss, after the i.p. injection of oxytocin, a writhing score (0 − 3) was assigned to each rat during a time-course of 30 min. Scoring was as follows: 0, normal body position of rats with paws flat on the bottom of the box and/or normal exploratory behavior; 1, leaning posture favoring the left or right body side; 2, stretching of hindlimbs and dorsiflexion of the hind paws, body stretched, and flat on the bottom, frequently with the pelvis rotated sideward; 3, contraction of abdominal muscles followed by stretching of the body and extension of hindlimbs (Schmauss & Yaksh, Citation1984).
Writhing scores = writhing times at grade 0 × 0 + writhing times at grade 1 × 1 + writhing times at grade 2 × 2 + writhing times at grade 3 × 3.
Rats were sacrificed after blood collection. The Ca2+ and nitric oxide (NO) contents in uterus homogenates were determined according to the kit specifications.
UHPLC-Q-TOF-MS analytical conditions
UHPLC analysis was performed on a Waters ACQUITY UPLC system (Waters Corporation, Milford, PA). The Acquity UPLC BEH-C18 column (2.1 mm × 50 mm, 1.7 μm) was applied for all analyses. The mobile phase was composed of A (acetonitrile) and B (0.1% formic acid, v/v) with a linear gradient elution: 0−5 min, A: 5−61%; 5−6 min, A: 61−95%; 6−8 min, A: 95%; 8−9 min, A: 95−5%. The flow rate of the mobile phase was 0.4 mL/min, and the column temperature was maintained at 35 °C.
Mass spectrometry was performed on a SynaptTM Q-TOF (Waters, Manchester, UK) instrument operated using an electrospray source in the positive and negative modes. The ionization source conditions were as follows: a capillary voltage of 1.5 kV, a source temperature of 120 °C, and a desolvation temperature of 350 °C. Sampling cone voltage was set at 45 V, extraction cone at 4.0 V, trap collision energy at 6.0 V, transfer collision energy at 4.0 V, trap gas flow at 1.50 mL/min, and ion energy at 1.0 V. Nitrogen and argon were used as the cone and collision gas, respectively. Cone and desolvation gas flow were 50 and 600 L/h, respectively. A scan time of 0.3 s and an interval scan time of 0.02 s were used throughout with a collision energy of 4 eV. The mass spectrometric data were collected from m/z 100 to 1000 in set for positive and negative ions in the centroid mode. Data acquisition and processing were performed using MasslynxTM v 4.1 (Waters Corp., Milford, MA).
Leucine−enkephalin was used as the lock mass generating [M + H]+ (m/z 556.2771) and [M–H]− (m/z 554.2615) ions at a concentration of 200 pg/mL and a flow rate of 100 μL/min to ensure accuracy during MS analysis. Dynamic range enhancement (DRE) was applied throughout the MS experiment to ensure accurate mass measurement over a wider dynamic range.
An MSE experiment with DRE in two scan functions was performed as follows: function 1: m/z 100−1000, 0.5 s scan time, 0.02 s inter-scan delay, 6 V collision energy; function 2: m/z 100−1000, 0.5 s scan time, 0.02 s inter-scan delay, collision energy ramp of 15−40 V.
Sample preparation
Plasma sample purification was limited to protein precipitation with methanol, whereby 200 μL plasma samples were extracted with 400 μL methanol. After vortexing for 1 min and centrifugation at 3000 rpm for 10 min, the organic phase was removed and evaporated to dryness in a 40 °C water bath under a gentle stream of nitrogen. The residue was reconstituted in 200 μL mobile phase, followed by a centrifugation at 13 000 rpm for 10 min. Finally, a 10 μL aliquot was injected into the LC-MS system.
A mixed standard stock solution containing caffeic acid, ferulic acid, tetrahydropalmatine, and berberine (100 µmol/L, respectively) was prepared in methanol. Mixed standard stock solution (10 μL) was spiked in 200 μL plasma from the normal control group. The mixed plasma sample was processed using the same purification method to obtain a QC sample.
Multivariate data analysis
UHPLC-MS data were analyzed with Micromass MarkerLynx applications manager Version 4.1 (Waters, Manchester, UK) linked with Umetrics© Simca-P that facilitated deconvolution, alignment, and data reduction to give a table of mass and retention time pairs with associated intensities for all detected peaks. The main parameters were set as follows: retention time range 1−9 min, mass range 100−1000, mass tolerance 0.01, intensity threshold (counts) 200, mass window 0.05, and retention time window 0.20. Parameters of width at 5% height and peak-to-peak baseline noise were automatically calculated. The process was repeated for each run. After completion, correct peak intensity data for each RT-m/z pair of the entire batch of samples were aligned in the final data table. Ions displaying similar RT (with a tolerance of 0.1 min) and m/z values (with a tolerance of 0.05 Da) in different samples were considered the same. For peaks that were difficult to detect in the sample, ion intensities were documented as zero in the final data table. Prior to submission for multivariate analyses, ion intensities for each detected peak were normalized against the sum of peak intensities within that sample using MarkerLynx software linked with Umetrics© Simca-P. Subsequently, the resulting three-dimensional data including peak number (RT-m/z pair), sample name and ion intensity were analyzed with principal component analysis (PCA) to determine data patterns and partial least-squared discriminate analysis (PLS-DA) for the classification within the MarkerLynx software links with Umetrics© Simca-P (Jia et al., 2008; Idborg et al., 2005). The results of ion peak area were evaluated with one-way ANOVA, followed by Student’s two-tailed unpaired t test or Dunnett’s multiple comparison test with SPSS 18.0 (SPSS Inc., Chicago, IL). A p value of less than 0.05 was considered statistically significant.
Results
Behavioral and biochemical analyses
Compared with control group A, the writhing score of model group B was significantly increased (p < 0.001). We observed a decrease in the NO content of uterus tissue homogenate (p < 0.01) and increased Ca2+ level in group B compared with group A (p < 0.05).
Compared to model group B, treatment with XFSWD (group D) led to a remarkable decrease in writhing score (p < 0.001). Consistently, the NO level increased significantly (p < 0.01), and Ca2+ concentration decreased significantly in group D treated with XFSWD (p < 0.05).
Writhing score, Ca2+ and NO levels in the normal group treated with XFSWD (group C) displayed no significant changes, compared with control group A (p > 0.05) ().
Table 1. Effects of XFSWD on the level of writhing scores, Ca2+, and nitric oxide (NO).
Analysis of metabolic patterns in rat plasma with UHPLC-Q-TOF-MS
The complexity of the rat plasma sample makes separation very difficult, consequently resulting in severe ion suppression. UHPLC employs a smaller stationary phase particle size column, facilitating high efficiency of separation, with a concurrent increase in resolution and sensitivity (Churchwell et al., Citation2005; Mensch et al., Citation2007). In the current study, UHPLC was applied to generate metabolic profiles of plasma from normal and dysmenorrheal syndrome rats before and after oral administration of XFSWD in the positive and negative ESI modes.
For UHPLC-MS-based metabonomics, the stability of the analytical system is one of the most important factors in obtaining valid data. Here, one standard sample including reference compounds in blank rat plasma was selected as a QC sample, and injected every 10 samples to monitor the stability of the analysis. As shown in , variations in retention times and m/z values of reference compound peaks in positive and negative ESI modes were less than 0.03 min and 10 mDa, respectively, and the relative standard deviations of peak areas were below 4.5%. These results demonstrate the excellent stability and reproducibility of chromatographic separation and mass measurement during the whole sequence. A representative base peak intensity (BPI) chromatogram was depicted in .
Figure 1. Representative UHPLC-Q-TOF-MS base peak intensity (BPI) chromatogram of a rat plasma sample analyzed in negative and positive ion modes.
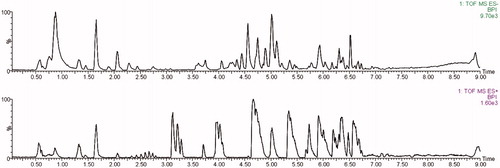
Table 2. The variations of retention times and m/z values and the relative standard deviations of peaks areas from reference compound peaks in positive and negative ESI modes (n = 12).
Influence of XFSWD on plasma metabolic patterns of normal and dysmenorrhea syndrome rats
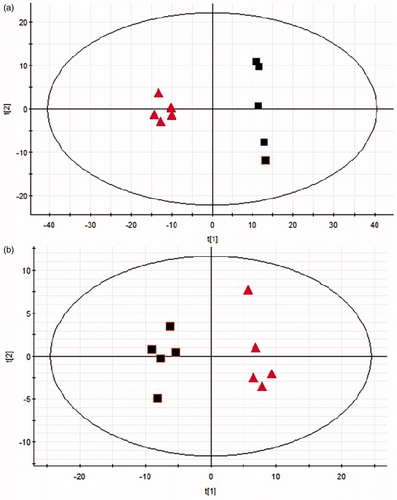
Following drug intervention, differences were evident between groups A and C, and B and D. Data from groups A and B were initially analyzed. Multivariate statistical analysis using a PCA model revealed a total of 369 and 119 metabolites (markers) in the negative and positive modes, respectively, from rats plasma in groups A and B. PCA is a bilinear decomposition method that allows original data to be reduced to a few principal components while retaining the features that contribute most to variance (Zhang et al., Citation2009), and does not require prior knowledge of class membership. shows the score plots of PCA in the positive and negative modes. Distinct clustering between normal and dysmenorrheal syndrome rats was separated into two individual regions. R2X of the PCA model was 0.655 (negative mode) and 0.715 (positive mode), while Q2 was 0.432 (negative mode) and 0.517 (positive mode).
Figure 2. PCA-DA scores plots. (a) Negative ion mode, (b) positive ion mode, (▪) normal group without treatment, and (▴) dysmenorrhea syndrome model group without treatment.
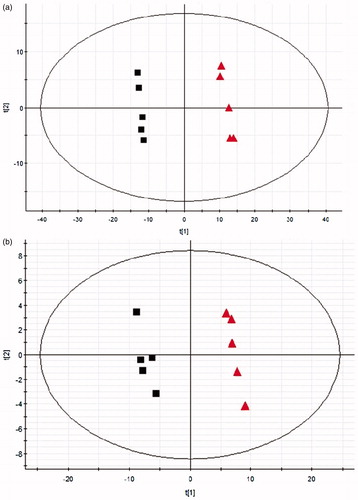
To analyze the differences in endogenous metabolites between normal and dysmenorrheal syndrome rats, the PLS-DA method was performed. Following Pareto scaling with mean centering, data were displayed as scores (ti) in a coordinate system of latent variables resulting from the above samples. To estimate the predictive ability of this model, we used seven-fold cross-validation. Parameters for classification from the software were R2Y = 0.998 (negative mode), 0.994 (positive mode), Q2Y = 0.973 (negative mode), and 0.961 (positive mode), which were good to fitness and prediction. A response permutation test (Y scrambling) was used to assess the significance of predictive ability and exclude over-fitting due to chance correlation. Our model had a R2Y-intercept of 0.238 (negative mode) and 0.125 (positive mode) and Q2-intercept of −0.357 (negative mode) and −0.298 (positive mode). According to Zhao et al. (2008), the R2Y-intercept should not exceed 0.4 and Q2-intercept should not exceed 0.05 for a model to be valid, confirming the reliability of our model. Based on the PLS-DA score plots (), separation of the model and control groups was clearly achieved.
Figure 3. PLS-DA scores plots. (a) Negative ion mode, (b) positive ion mode, (▪) normal group without treatment, and (▴) dysmenorrhea syndrome model group without treatment.
To ensure optimal discrimination between the normal and dysmenorrhea syndrome model groups, the orthogonal partial least square method (OPLS-DA) was applied to metabolic profiles. An extended statistical analysis was used to provide an S-plot, with a view to establishing the predominant components contributing to differences between these two clusters ().
Figure 4. OPLS-DA S-plot. (a) Negative ion mode and (b) positive ion mode.
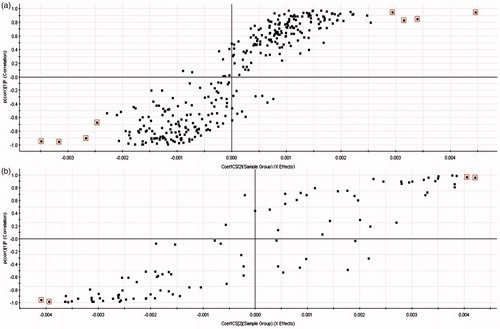
Components that play important roles in separation were selected according to the two ends of ‘‘S’’. An independent t test was performed in succession, and variables with no significant differences between normal and dysmenorrhea syndrome rats (P > 0.05) were eliminated. The retention times and m/z of potential markers selected from ESI+ and ESI− scans based on the loading plot of OPLS-DA were presented in . P values of mean peak heights of these markers in different groups with the t test were also shown in .
Table 3. Potential markers from rats with dysmenorrhea syndrome (p < 0.05) and their identification results on ESI+ and ESI− scans.
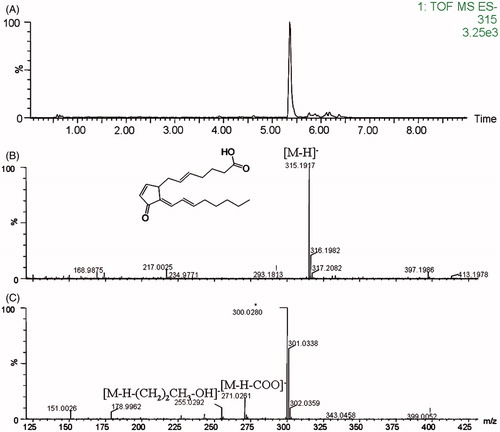
As an example, we used m/z 316 to illustrate the marker identification process. Initially, the accurate mass of the potential marker was determined. Its corresponding peak was detected according to the retention times in a total ion chromatogram from an ESI− scan. A search of the mass spectrum revealed a [M–H]− molecular ion (m/z 315). Particular MSE information on the fragmentation pattern of the marker was acquired from the Q-TOF system. Under a negative ion mode, the MSE figure contains contained fragment ions [M–H–COO]− (m/z 271), [M–2 H–(CH2)2CH3]− (m/z 271), and [M–H–(CH2)2CH3–OH]− (m/z 255). Based on these data, we inferred that the marker is an eicosanoid. Finally, the METLIN (http://metlin.scripps.edu/) database was examined, leading to the identification of 15-deoxy-δ-12,14-PGJ2 as the marker ().
Figure 5. Identification of a selected marker. (A) Peak of potential biomarker of m/z 315 in extracted ion chromatogram with negative mode. (B) Corresponding mass spectrum. (C) MSE spectrum, the collision energy was 25 eV.
Twelve potential markers were identified using the above method (), including lysoPC(18:4) (m/z 515.30, ESI−), LysoPE(22:2/0:0) (m/z 533.35, ESI−), LysoPC(17:0) (m/z 509.35, ESI−), PGJ2 (m/z 334.21, ESI−), 15-deoxy-δ-12,14-PGJ2 (m/z 316.20, ESI−), 11-deoxy-11-methylene-PGD2 (m/z 350.25, ESI−), and LysoPC(20:3) (m/z 545.35, ESI+). However, we failed to identify the markers at m/z 418.13, 318.22, 520.30, 391.20, and 246.24. Owing to the lack of corresponding standard samples, all markers, except lysoPC(18:4), were identified solely according to the fragment ion on MSE and criteria of Jia et al. (2008) and Liebisch et al. (Citation2002). Earlier literature (Bell-Parikh et al., Citation2003; Dong et al., Citation2010; Murphy et al., Citation2005) was further used to confirm the results.
UHPLC-MS data from five normal rats and five dysmenorrhea syndrome rats after the administration of XFSWD at 30 min, 2 h, 6 h and 12 h revealed 376 peaks of negative ions and 122 peaks of positive ions, which were detected and processed via MarkerLynx using the same acquisition method and data fed to SIMCA-P for PLS, respectively. Although separation of the model and control groups was clearly achieved, all time-series groups scattered into each other, resulting in poor discrimination. To determine whether XFSWD influences the metabolic patterns of normal and dysmenorrhea model subjects, the mean peak areas of the 12 potential markers described were calculated ().
Figure 6. Mean peak area (mean±standard error) of markers (a–l) from normal and dysmenorrhea syndrome rats plasma samples after administration of XFSWD at 30 min, 2 h, 6 h, and 12 h (n = 5). (▪) Dysmenorrhea syndrome model group with treatment and (□) normal group with treatment.
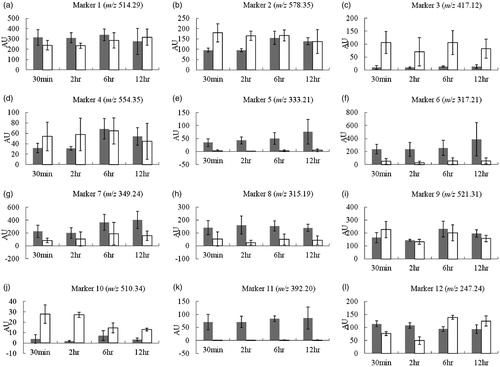
The concentrations of the ions with m/z 578.35 [LysoPE(22:2/0:0), ], m/z 417.12 (unidentified, ), m/z 554.35 [LysoPC(17:0), ], m/z 521.31 (unidentified, ), and m/z 510.34 [LysoPC(20:3), ] were decreased while those of ions with m/z 333.21 (PGJ2, ), m/z 317.21 (unidentified, ), m/z 349.24 (11-deoxy-11-methylene-PGD2, ), m/z 315.19 (15-deoxy-δ-12,14-PGJ2, ), m/z 392.20 (unidentified, ), and m/z 247.24 (unidentified, ) were increased to a significant extent (P < 0.05) in dysmenorrheal rats.
The concentrations of the ions with m/z 514.29 [lysoPC(18:4), ], m/z 578.35 [LysoPE(22:2/0:0), ], m/z 554.35 [LysoPC(17:0), ], and m/z 521.31 (unidentified, ) increased and showed no significant difference (P > 0.05) between the model and normal groups at 12 h after dosing. In contrast, the concentrations of ions with m/z 417.12 (unidentified, ), m/z 333.21 (PGJ2, ), m/z 317.21 (unidentified, ), m/z 349.24 (11-deoxy-11-methylene-PGD2, ), m/z 315.19 (15-deoxy-δ-12,14-PGJ2, ), m/z 510.34 [LysoPC(20:3), ], m/z 392.20 (unidentified, ), and m/z 247.24 (unidentified, ) were significantly different (p < 0.05) between the model and normal groups at 30 min, 2 h, 6 h, and 12 h after dosage.
Furthermore, the degree of influence of XFSWD on markers in normal and model rats was different. For example, the concentration of ions with m/z 247.24 () showed no significant changes in model rats, while that in normal rats at 12 h was relatively higher than that at 30 min after XFSWD administration (p < 0.05).
Discussion
Two types of markers were identified for dysmenorrhea syndrome, specifically, prostaglandins and lysophospholipids. The concentrations of the prostaglandin markers, 11-deoxy-11-methylene-PGD2, and 15-deoxy-δ-12, 14-PGJ2 were significantly increased in the oxytocin-induced dysmenorrhea syndrome rat model. These three prostaglandin compounds are dehydration end products of PGD2, which are metabolized enzymatically to 11β-PGF2α (Martinez-Gras et al., Citation2011; Powell, Citation2003). Excessive or imbalanced levels of prostanoids and possibly eicosanoids were released from the endometrium during induced menstruation. The uterus is induced to contract frequently and dysrhythmically. Uterine hypercontractility, reduced uterine blood flow, and increased peripheral nerve hypersensitivity are known to trigger dysmenorrhea (Dawood, Citation2006; Koike et al., Citation1992). Results from the current study confirmed the reliability of the dysmenorrhea syndrome rat model. However, the concentrations of prostanoids in normal and dysmenorrhea syndrome model rats remained unchanged after XFSWD administration at all times. At 30 min, 2 h, 6 h, and 12 h following XFSWD administration, the concentrations of PGJ2, 11-deoxy-11-methylene-PGD2, and 15-deoxy-δ-12, 14-PGJ2 remained higher in oxytocin-induced dysmenorrhea syndrome rats than in normal rats. Prostanoid levels were significantly different (p < 0.05) between the model and normal groups at 30 min, 2 h, 6 h, and 12 h after treatment, indicating that prostanoids may not be the target of XFSWD.
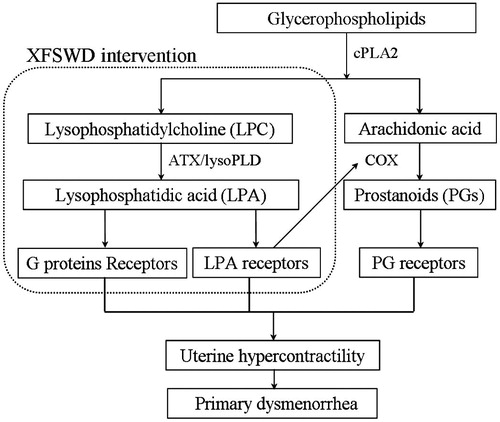
The other type of marker identified was lysophospholipid. LysoPC(18:4), LysoPE(22:2/0:0), LysoPC(17:0), and LysoPC(20:3) were examined to establish whether these compounds can be used as biomarkers between normal and dysmenorrhea syndrome rats. The four markers are glycerophospholipids, which are the main eukaryotic membrane lipids. Notably, the concentrations of these markers were significantly decreased in oxytocin-induced dysmenorrhea syndrome rats. The diacylglycerol (DAG) backbone of these compounds carries a phosphate (phosphatidic acid) esterified to either choline, ethanolamine, serine, or inositol. Hydrolysis of membrane lipids by cytosolic phospholipase A2 (cPLA2) generates arachidonic acid and lysophosphatidylcholine (LPC). Arachidonic acid is stereospecifically oxygenated through the cyclooxygenase (COX) pathway, thereby producing prostaglandins (Jabbour et al., Citation2009). LPC exerts pro-inflammatory properties in vitro. The compound has been shown to function in cell signaling, and specific receptors (coupled to G proteins) have been identified. LPC activates specific phospholipase C that releases diacylglycerols and inositol triphosphate with a resultant increase in intracellular Ca2+ and activation of protein kinase C (Kabarowski, Citation2009; Yan et al., Citation2004; Zhu et al., Citation2001). After the administration of XFSWD, the concentrations of LysoPC(18:4), LysoPE(22:2/0:0), and LysoPC(17:0) were restored to normal levels. LysoPC(20:3) concentrations were altered in normal rats, while no significant changes were observed in model rats at any time-point.
The finding that these markers and their trends are altered after administration of the drug indicates that XFSWD interferes with the LPC metabolic pathway (). Consistent with our results, XFSWD has been shown to have an inhibitory effect on COX-2 and suppress the Ca2+ level in uterus homogenates of mice with dysmenorrhea syndrome (Liu et al., Citation2011). Compounds including gallic acid, caffeic acid, chlorogenic acid, albiflorin, peoniflorin, ferulaic acid, tetrahydrocolumbamine, protopine, tetrahydrocoptisine, tetrahydropalmatine, corydaline, berberine and dehydrocorydaline, neolazppaic acid, 3-butylidene-7-hydroxyphthalide, costunolide, palmitic acid, allocryptopine, glaucine, and costuslactone were identified and quantitatively analyzed in XFSWD (Liu et al., Citation2013). These constituents made co-effect on the LPC metabolic pathway.
Figure 7. Scheme illustrating sphingolipid metabolism and Xiang–Fu–Si–Wu Decoction intervention.
These studies collectively indicate that disruption of phospholipid metabolism is important for dysmenorrhea syndrome, which can be effectively treated with XFSWD. However, the majority of potential markers could not be identified with the current methods, due to limitations in metabolite databases and standard compounds. Further evidence on the physiological changes and mechanisms of dysmenorrhea syndrome using the rat model should be obtained with a more powerful analytical strategy, such as structural identification.
Conclusions
A metabonomics method based on the UHPLC-Q-TOF-MS and multivariate statistical analysis has been successfully employed to study normal and dysmenorrheal syndrome rats, with the aim of identifying potential markers. The PCA and PLS score plots of normal and dysmenorrheal syndrome rats were distinct, and significant differences in the plasma levels of prostaglandins and lysophospholipids were observed. Our results suggested that perturbations in phospholipid metabolism were associated with the dysmenorrhea syndrome. Moreover, the therapeutic efficacy of XFSWD in the animal model may be attributed to its interference with phospholipid metabolism. Metabonomic analysis based on the UHPLC-Q-TOF-MS and the multivariate statistical technique is thus useful to determine the balance of homeostasis and metabolism of phospholipids, and presents a promising tool to evaluate treatments for dysmenorrhea in animal models and ultimately in the clinic.
Declaration of interest
This research was financially supported by National Natural Science Foundation of China (81202880), Natural Science Foundation of Jiangsu Province, China (BK2012456), and Key Research Project in Basic Science of Jiangsu College and University of China (no. 06KJA36022). Moreover, the project was funded by the Priority Academic Program Development of Jiangsu Higher Education Institutions (ysxk-2010).
Acknowledgements
We are grateful to Waters China Ltd. for technical support.
References
- Akerlund M. (2002). Involvement of oxytocin and vasopressin in the pathophysiology of preterm labor and primary dysmenorrhea. Prog Brain Res 139:359–65
- Bell-Parikh LC, Ide T, Lawson JA, et al. (2003). Biosynthesis of 15-deoxy-delta12,14-PGJ2 and the ligation of PPARgamma. J Clin Invest 112:945–55
- Cheng XM, Zhao T, Yang T, et al. (2010). HPLC fingerprints combined with principal component analysis, hierarchical cluster analysis and linear discriminant analysis for the classification and differentiation of Peganum sp. indigenous to China. Phytochem Anal 21:279–89
- Churchwell MI, Twaddle NC, Meeker LR, Doerge DR. (2005). Improving LC-MS sensitivity through increases in chromatographic performance: Comparisons of UPLC-ES/MS/MS to HPLC-ES/MS/MS. J Chromatogr B Analyt Technol Biomed Life Sci 825:134–43
- Couchman L, Morgan PE. (2011). LC-MS in analytical toxicology: Some practical considerations. Biomed Chromatogr 25:100–23
- Dawood MY. (2006). Primary dysmenorrhea: Advances in pathogenesis and management. Obstet Gynecol 108:428–41
- Dong J, Cai XM, Zhao LL, et al. (2010). Lysophosphatidylcholine profiling of plasma: Discrimination of isomers and discovery of lung cancer biomarkers. Metabolomics 6:478–88
- Doubova SV, Morales HR, Hernandez SF, et al. (2007). Effect of a Psidii guajavae folium extract in the treatment of primary dysmenorrhea: A randomized clinical trial. J Ethnopharmacol 110:305–10
- Hsu CS, Yang JK, Yang LL. (2006). Effect of “Dang-Qui-Shao-Yao-San” a Chinese medicinal prescription for dysmenorrhea on uterus contractility in vitro. Phytomedicine 13:94–100
- Idborg H, Zamani L, Edlund PO, et al. (2005). Metabolic fingerprinting of rat urine by LC/MS Part 2. Data pretreatment methods for handling of complex data. J Chromatogr B Analyt Technol Biomed Life Sci 828:14--20
- Jabbour HN, Sales KJ, Catalano RD, Norman JE. (2009). Inflammatory pathways in female reproductive health and disease. Reproduction 138:903–19
- Jia LW, Chen J, Yin PY, et al. (2008). Serum metabonomics study of chronic renal failure by ultra performance liquid chromatography coupled with Q-TOF mass spectrometry. Metabolomics 4:183--9
- Kabarowski JH. (2009). G2A and LPC: Regulatory functions in immunity. Prostaglandins Other Lipid Mediat 89:73–81
- Koike H, Egawa H, Ohtsuka T, et al. (1992). Correlation between dysmenorrheic severity and prostaglandin production in women with endometriosis. Prostaglandins Leukot Essent Fatty Acids 46:133–7
- Li Y, Liu S, Wang C, et al. (2010). Novel biomarkers of 3-chloro-1,2-propanediol exposure by ultra performance liquid chromatography/mass spectrometry based metabonomic analysis of rat urine. Chem Res Toxicol 23:1012–17
- Liebisch G, Drobnik W, Lieser B, et al. (2002). High-throughput quantification of lysophosphatidylcholine by electrospray ionization tandem mass spectrometry. Clin Chem 48:2217--24
- Liu P, Duan JA, Hua YQ, et al. (2011). Effects of Xiang–Fu–Si–Wu decoction and its main components for dysmenorrhea on uterus contraction. J Ethnopharmacol 133:591–7
- Liu P, Duan JA, Wang PJ, et al. (2013). Biomarkers of primary dysmenorrhea and herbal formula intervention: An exploratory metabonomics study of blood plasma and urine. Mol BioSyst 9:77–87
- Martinez-Gras I, Perez-Nievas BG, Garcia-Bueno B, et al. (2011). The anti-inflammatory prostaglandin 15d-PGJ2 and its nuclear receptor PPARgamma are decreased in schizophrenia. Schizophr Res 128:15–22
- Mensch J, Noppe M, Adriaensen J, et al. (2007). Novel generic UPLC/MS/MS method for high throughput analysis applied to permeability assessment in early drug discovery. J Chromatogr B Analyt Technol Biomed Life Sci 847:182–7
- Murphy RC, Barkley RM, Zemski Berry K, et al. (2005). Electrospray ionization and tandem mass spectrometry of eicosanoids. Anal Biochem 346:1–42
- National Research Council (US). Committee for the Update of the Guide for the Care and Use of Laboratory Animals. Institute for Laboratory Animal Research (U.S.), National Academies Press (U.S.). (2011). Guide for the Care and Use of Laboratory Animals. Washington, DC: National Academies Press, 4--8
- Nigam S, Benedetto C, Zonca M, et al. (1991). Increased concentrations of eicosanoids and platelet-activating factor in menstrual blood from women with primary dysmenorrhea. Eicosanoids 4:137–41
- Plumb RS, Stumpf CL, Granger JH, et al. (2003). Use of liquid chromatography/time-of-flight mass spectrometry and multivariate statistical analysis shows promise for the detection of drug metabolites in biological fluids. Rapid Commun Mass Spectrom 17:2632–8
- Powell WS. (2003). 15-Deoxy-delta12,14-PGJ2: Endogenous PPARgamma ligand or minor eicosanoid degradation product? J Clin Invest 112:828–30.
- Schmauss C, Yaksh TL. (1984). In vivo studies on spinal opiate receptor systems mediating antinociception. II. Pharmacological profiles suggesting a differential association of mu, delta and kappa receptors with visceral chemical and cutaneous thermal stimuli in the rat. J Pharmacol Exp Ther 228:1–12
- Srinivas NR. (2006). Applicability of bioanalysis of multiple analytes in drug discovery and development: Review of select case studies including assay development considerations. Biomed Chromatogr 20:383–414
- Tao X, Liu Y, Wang Y, et al. (2008). GC-MS with ethyl chloroformate derivatization for comprehensive analysis of metabolites in serum and its application to human uremia. Anal Bioanal Chem 391:2881–9
- Tong X, Sun H, Yan GL, et al. (2011). Evaluation study on urine metabolomics in yinhuang rat model induced by triplet factors of rhubarb, ethanol, and alpha-nephthylisothiolyanate. Chinese J Integrative Med 17:369–75
- Wilson ID, Nicholson JK, Castro-Perez J, et al. (2005). High resolution “Ultra performance” liquid chromatography coupled to oa-TOF mass spectrometry as a tool for differential metabolic pathway profiling in functional genomic studies. J Proteome Res 4:591–8
- Yan JJ, Jung JS, Lee JE, et al. (2004). Therapeutic effects of lysophosphatidylcholine in experimental sepsis. Nat Med 10:161–7
- Zhang J, Yan L, Chen W, et al. (2009). Metabonomics research of diabetic nephropathy and type 2 diabetes mellitus based on UPLC-oaTOF-MS system. Anal Chim Acta 650:16–22
- Zhao X, Zhang Y, Meng X, et al. (2008). Effect of a traditional Chinese medicine preparation Xindi soft capsule on rat model of acute blood stasis: a urinary metabonomics study based on liquid chromatography-mass spectrometry. J Chromatogr B Analyt Technol Biomed Life Sci 873:151--8
- Zhu K, Baudhuin LM, Hong G, et al. (2001). Sphingosylphosphorylcholine and lysophosphatidylcholine are ligands for the G protein-coupled receptor GPR4. J Biol Chem 276:41325–35