
Abstract
Context: c-Myc plays a key role in glioma cancer stem cell maintenance. A drug delivery system, nanoparticles loading plasmid DNAs inserted with siRNA fragments targeting c-Myc gene (NPs-c-Myc-siRNA-pDNAs), for the treatment of glioma, has not previously been reported.
Objective: NPs-c-Myc-siRNA-pDNAs were prepared and evaluated in vitro.
Materials and methods: Three kinds of c-Myc-siRNA fragments were separately synthesized and linked with empty siRNA expression vectors in the mole ratio of 3:1 by T4 DNA ligase. The linked products were then separately transfected into Escherichia coli. DH5α followed by extraction with Endofree plasmid Mega kit (Qiagen, Hilden, Germany) obtained c-Myc-siRNA-pDNAs. Finally, the recombinant c-Myc-siRNA3-pDNAs, generating the highest transfection efficiency and the greatest apoptotic ability, were chosen for encapsulation into NPs by the double-emulsion solvent-evaporation procedure, followed by stability, transfection efficiency, as well as qualitative and quantitative apoptosis evaluation.
Results: NPs-c-Myc-siRNA3-pDNAs were obtained with spherical shape in uniform size below 150 nm, with the zeta potential about −18 mV, the encapsulation efficiency and loading capacity as 76.3 ± 5.4% and 1.91 ± 0.06%, respectively. The stability results showed that c-Myc-siRNA3-pDNAs remained structurally and functionally stable after encapsulated into NPs, and NPs could prevent the loaded c-Myc-siRNA3-pDNAs from DNase degradation. The transfection efficiency of NPs-c-Myc-siRNA3-pDNAs was proven to be positive. Furthermore, NPs-c-Myc-siRNA3-pDNAs produced significant apoptosis with the apoptotic rate at 24.77 ± 5.39% and early apoptosis cells observed.
Discussion and conclusion: Methoxy-poly-(ethylene-glycol)-poly-(lactide-co-glycolide) nanoparticles (MPEG–PLGA-NPs) are potential delivery carriers for c-Myc-siRNA3-pDNAs.
Introduction
As the most frequent brain cancer, glioma accounts for about 46% of intracranial tumors with a risk of 30–100 per million (Jain et al., Citation2007). Surgical excision of the tumor is recommended as the primary treatment. However, because of its infiltration into normal brain tissue and the specificity of its growing locations (Ong et al., Citation2009), the tumor usually cannot be removed completely and thus adjuvant radiotherapy and/or chemotherapy have to be employed so as to kill the rest of the tumor (Genc et al., Citation2011). Treatment of gliomas is complicated by the tumors’ high resistance to chemotherapy, poor penetration of blood brain barrier (BBB), and damaging effects of chemotherapy and radiation to normal neural tissue (Lefranc et al., Citation2006). Malignant gliomas are considered to be non-curable, and the overall prognosis of treatment success is poor with a median survival of 14.6 months after diagnosis and a 5-year survival rate of 9.8% (Goellner et al., Citation2011).
It has been shown that 78% of human glioma tumors expressed c-Myc (Herms et al., Citation1999). In glioma, c-Myc expression correlates with the grade of malignancy (Orian et al., Citation1992). Expression of c-Myc, driven by the glial fibrillary acidic protein (GFAP)-promoter in developing mouse astroglia, induces tumors that resemble human glioblastoma multiforme (Jensen et al., Citation2003). In this mouse model, the tumor mass contains fast dividing subpopulation that express c-Myc and relatively quiescent tumor cells that lack c-Myc expression (Jensen et al., Citation2003). It has been determined that the glioma cancer stem cells expressed higher levels of c-Myc relative to matched non-stem tumor cells and the activity of c-Myc was required for proliferation, growth, and survival of glioma cancer stem cells, underscoring a key role of c-Myc in glioma cancer stem cell maintenance (Wang et al., Citation2008).
RNA interference (RNAi) is a newly identified cellular mechanism that blocks gene expression. When small interfering RNA (siRNA) that contains 21–23 ribonucleotides homologous with the targeting gene is transfected into cells, it is associated with some protein molecules including the incision enzyme to form the RNA-induced silencing complexing (RISC). RISC recognizes the homologous mRNA by using the siRNA as a template, cleaves target mRNA with activated RNase, and thus silences the target gene (Filipowicz, Citation2005).
The significance of knocking down c-Myc in the human glioblastoma cell line IN500 on cell-cycle progression, apoptosis, and vascular endothelial growth factor (VEGF) expression has been examined by applying RNAi technology, which supported c-Myc as a potential target for anti-growth and anti-angiogenesis gene therapy in gliomas (Hu et al., Citation2012). RNAi can be triggered by two different pathways: (1) a RNA-based approach where the effector siRNAs are delivered to target cells as preformed 21 base duplexes, and (2) a DNA-based strategy in which the siRNA effectors are produced by intracellular processing of longer RNA hairpin transcripts. The latter approach is primarily based on the nuclear synthesis of short hairpin RNAs (shRNAs), which are transported to the cytoplasm via the miRNA machinery and are processed into siRNA by Dicer. While the direct use of siRNA effectors is simple and results in potent gene silencing, their effect is transient. Consequently, repeated treatment would have to be administered if RNA-based RNAi drugs were used in a clinical setting. DNA-based RNAi drugs, in contrast, have the potential of being stably introduced when used in a gene-therapy setting, allowing in principle, a single treatment of viral vector-delivered shRNA genes (Aagaard & Rossi, 2007).
However, the plasmid DNAs (pDNAs) are likely to be rapidly degraded in the plasma, tissue fluid, cytoplasm, and lysosomes due to the presence of DNase, which restricts the in vivo use of pDNAs. Poly-(lactide-co-glycolide) (PLGA) and poly-(lactide) (PLA) are biocompatible and biodegradable polyesters (Anderson & Shive, Citation1997). In conjunction with poly-(ethylene-glycol) (PEG) or in the forms of other modifications, these polymers have been extensively used to prepare nanoparticles (NPs) for a sustained and targeted delivery of such agents as genes, proteins, peptides, and low molecular weight compounds (Li et al., Citation2001; Moghimi et al., Citation2001; Prabha et al., Citation2004; Zambaux et al., Citation2001).
In this study, three kinds of pDNAs inserted with siRNA sequences targeting c-Myc gene (c-Myc-siRNA-pDNAs) were designed and synthesized by a DNA-based strategy. The recombinant c-Myc-siRNA3-pDNAs with the highest transfection efficiency and the greatest apoptotic ability were chosen for next experiments. Subsequently, NPs consisting of MPEG–PLGA copolymer were developed as potential delivery carriers for c-Myc-siRNA3-pDNAs. Finally, investigation on the stability of c-Myc-siRNA3-pDNAs and analysis on the transfection efficiency and apoptosis of NPs-c-Myc-siRNA3-pDNAs were performed.
Materials and methods
Materials
Endofree plasmid Mega kit was customized by Qiagen, Hilden, Germany; restriction endonucleases BamHI and Hind III, Hoechst 33258, propidium iodide, and bovine serum albumin (BSA) were purchased from Sigma, St Louis, MO; Lambda DNA/HindIII Markers were from Sino-American Biotechnology Co., Ltd.; cell culture plates and bottles were obtained from Corning Incorporated, Corning, NY; (high glucose) Dulbecco’s modified Eagle’s medium (DMEM), fetal bovine serum (FBS), trypsin (0.125%), ampicillin, and streptomycin were from Gibco, Carlsbad, CA; Lipofectamin 2000 was from Invitrogen, Carlsbad, CA; Agrose was originally purchased from Sigma (St Louis, MO) and repacked by Shanghai Siji Biological Product Co., Ltd.; PicoGreen kit was purchased from Molecular Probes, Waikoloa, HI; rat C6 glioma cell was from the Cell Bank of the Chinese Academy of Sciences (Shanghai, China). The copolymers of methoxy–PEG–PLGA (MW 96 000 Da, copolymer ratio 50:50) were purchased from Shandong Institute of Medical Instrument (Shandong, China); polyvinyl alcohol (PVA) (average MW 31 kDa) was from Fluka Chemie GmbH (Riedel-de-Hauen, Seelze, Germany); double distilled water was purified using a Millipore Simplicity System (Millipore, Bedford, MA). All other chemicals were of analytical reagent grade and were used without further purification.
Design and synthesis of c-Myc-siRNA-pDNAs
The complementary DNA sequence of c-Myc (NM_002467) was obtained from Genbank. The potential target sequences for RNA interference (RNAi) were scanned with the siRNA Target Finder and Design Tool available at the Ambion Web site (http://www.ambion.com/techlib/misc/siRNA_finder.html). The designed c-Myc-siRNA sequences are CTACTCACCAGCACAATTA (c-Myc-siRNA1), AGCACAAACTCATCTCAGA (c-Myc-siRNA2), and GAATTTCTATCACCAGCAA (c-Myc-siRNA3). The corresponding recombinant pDNAs are named c-Myc-siRNA1-pDNAs, c-Myc-siRNA2-pDNAs, and c-Myc-siRNA3-pDNAs, respectively.
The siRNA fragments (with forward and reverse sequences) were synthesized to obtain single-stranded DNA template 1 and single-stranded DNA template 2. Subsequently, the DNA templates were annealed in a 20 μL reaction mixture containing 0.05 μg/μL of single-stranded DNA template 1, 0.05 μg/μL of single-stranded DNA template 2, 1 μL of saline-sodium solution (20×), and 17 μL of water, which were kept at 95 °C for 10 min. Finally, the mixture was kept at room temperature for 1 h.
An empty siRNA expression vector containing green fluorescent protein gene was cut with BamHI and HindIII restriction enzymes, and then purified by 1% agarose gel electrophoresis to recover the linearly vector, which was then linked with the siRNA fragments in the mole ratio of 3:1 by T4 DNA ligase. The linked product was then transfected into Escherichia coli. DH5α was spread on an LB Amp plate and incubated at 37 °C overnight. The recombinant c-Myc-siRNA-pDNAs were extracted with an Endofree plasmid Mega kit (Qiagen, Hilden, Germany) and then stored at −20 °C.
Identification of the recombinant c-Myc-siRNA-pDNAs and selection of the best c-Myc-siRNA sequence
Detection of the length and purity of the recombinant c-Myc-siRNA-pDNAs
The recombinant c-Myc-siRNA-pDNAs were run on a 2% agarose gel to measure the lengths with the empty vector as a control. The purity of the recombinant c-Myc-siRNA-pDNAs was examined using a UV spectrophotometer. Briefly, the c-Myc-siRNA-pDNAs to be examined were dissolved in Tris-EDTA (TE) buffer (about 1:10) followed by dilution with deionized water (about 1:40), and then tested for absorption at both 260 nm (A260) and 280 nm (A280) using a UV spectrophotometer (UV-2401 PC, Shimadzu, Japan), which was previously zeroed with deionized water. The purity of DNA was evaluated using A260/A280 ratio (pure DNA yields a ratio of 1.8–1.9).
Identification of the restriction enzyme sites of the recombinant c-Myc-siRNA-pDNAs
In order to identify the restriction enzyme sites of the recombinant c-Myc-siRNA-pDNAs, 1 μL of plasmids DNA (1 μg/μL), 2 μL of 10× restriction enzyme buffer, 0.2 μL of acetylated BSA (10 μg/μL), and 16.3 μL of sterile deionized water by pipetting were gently mixed, followed by the addition of 0.5 μL of BamHI or HindIII restriction enzyme (10 U/μL). The above reaction mixture was then gently mixed by pipetting and centrifuged for a few seconds in a microcentrifuge, followed by incubation at 37 °C for 2 h. Finally, a small aliquot of the reaction mixture was run on an agarose gel (0.7%) under 110 V for 45 min.
Transfection efficiency analysis of the recombinant c-Myc-siRNA-pDNAs
C6 cells, passaged in high glucose DMEM containing 10% FBS, 100 U/ml ampicillin, and 100 U/ml streptomycin at 37 °C, 5% CO2 for no less than three generations, were used for transfection efficiency evaluation and apoptosis analysis.
The recombinant c-Myc-siRNA-pDNAs (8 μg/mL) were transfected into C6 cells, which were previously seeded in culture plates of 24 wells containing DMEM + 10% FBS at 37 °C, 5% CO2 for 24 h with the final cell density of 5–20 × 104 per well, with Lipofectmaine 2000 (1% v/v) following the manufacturer’s instruction. After 24 h transfection, the green fluorescence protein expression was examined using stereo fluorescence microscope (IX71/IX51, OLYMPUS, Tokyo, Japan) to determine the most efficient interfering sequence.
Qualitative apoptosis analysis of the recombinant c-Myc-siRNA-pDNAs
After 24 h transfection as described above, C6 cells were washed with PBS and digested with 1 mL of 0.125% trypsin for 30 s, followed by the addition of 4–5 mL DMEM + 15% FBS to stop the digestion. Following centrifugation at 700 g for 6 min, the cells were collected by removing the supernatant and then resuspended in Hank’s balanced salt solution at a concentration of 1 × 10⁶ cells/mL. To 100 μL of the resuspension, 1 μL Hoechst33258 (0.13 mmol/L) and 1 μL propidium iodide (0.23 mmol/L) were added and mixed well, followed by incubation at room temperature for 5 min under protection from light. The fluorescence was immediately determined by stereo fluorescence microscope. Blue fluorescence was detected for normal cells and early apoptosis cells, and red fluorescence for late apoptosis cells and dead cells.
Quantitative apoptosis analysis of the recombinant c-Myc-siRNA-pDNAs
The recombinant c-Myc-siRNA-pDNAs and control (empty plasmid) were transfected into C6 cell, which were previously seeded in culture plates of six wells containing DMEM + 10% FBS at 37 °C, 5% CO2 for 24 h with the final cell density of 40–50 × 104 per well, with Lipofectmaine 2000 following the manufacturer’s instruction. Then cells were washed with PBS and digested with 1 mL of 0.125% trypsin for 30 s, followed by the addition of 4–5 mL DMEM + 15% FBS to stop the digestion. The cells were concentrated from centrifugation at 700 g for 10 min and then resuspended in a binding buffer, followed by the addition of 5 μL AnnexinV-FITC and 5 μL propidium iodide in order. After 30 min incubation, 200 μL DMEM + 10% FBS was added into these cells, immediately followed by fluorescence determination using flow cytometry (FACSCalibur, Becton Dickinson, Dr Franklin Lakes, NJ). FITC−/PI−, FITC+/PI−, FITC+/PI+, and FITC−/PI+ means active cells, early apoptotic cells, mid-to-late apoptotic cells, and dead cells, respectively. The apoptotic rate was calculated using the accumulative amount percentage of early apoptotic cells, mid-to-late apoptotic cells, and dead cells in all detected cells.
Preparation and characterization of NPs-c-Myc-siRNA3-pDNAs
NPs-c-Myc-siRNA3-pDNAs were prepared using a double-emulsion solvent-evaporation technique as previously reported (Lu et al., Citation2007; Prabha & Labhasetwar, Citation2004). In a typical procedure, MPEG–PLGA polymer was dissolved in dichloromethane at the concentration of 10 mg/mL, and TE buffer containing 1 μg/μL of c-Myc-siRNA3-pDNAs and 25 μg/μL of DNase free BSA was emulsified into the polymer solution at the ratio of 1:5 using a probe sonicator (JY92-II, Scientz Biotechnology Co. Ltd., Zhejiang, China) at 120 W for 30 s to form the primary emulsion. The emulsion was further emulsified into a 0.5% PVA aqueous solution at the ratio of 1:5 using the same sonicator at 120 W for 5 s/time, 15 times to form a w/o/w emulsion. The emulsion was stirred moderately for 2 h, and then dichloromethane was evaporated under a low pressure at 40 °C using Buchi rotavapor (R-200, Buchi, Essen, Germany).
The NPs-c-Myc-siRNA3-pDNAs were centrifuged at 21 100 g for 20 min at 4 °C using a centrifuge (TJ-25, Beckman Counter, Fullerton, CA). The supernatant was collected and measured for c-Myc-siRNA3-pDNAs content using a PicoGreen kit to determine the encapsulation efficiency and loading capacity of c-Myc-siRNA3-pDNAs in MPEG–PLGA-NPs.
The mean number-based diameter and zeta potential of NPs-c-Myc-siRNA3-pDNAs were determined by dynamic light scattering (DLS) using a zeta potential/particle sizer (380 ZLS, NICOMP, Urbana, IL), and their morphology was observed under a transmission electron microscope.
Stability of c-Myc-siRNA3-pDNAs
Stability of c-Myc-siRNA3-pDNAs during preparation of NPs
NPs-c-Myc-siRNA3-pDNAs were centrifuged at 21 100 g for 20 min at 4 °C. The c-Myc-siRNA3-pDNAs remained in the supernatant were collected by precipitation with isopropanol in the ratio of 1:1, followed by centrifugation at 16 000 g for 45 min at 4 °C. On the other hand, the c-Myc-siRNA3-pDNAs encapsulated in NPs were collected by dissolving the centrifuged NPs-c-Myc-siRNA3-pDNAs in dichloromethane followed by extraction using TE buffer. Finally, agarose gel electrophoresis was utilized to determine the structure and the function of the obtained c-Myc-siRNA3-pDNAs by running on an agarose gel (1%) under 90 V for 45 min using Marker and c-Myc-siRNA3-pDNAs reference standard as controls.
Stability of c-Myc-siRNA3-pDNAs in acidic condition
c-Myc-siRNA3-pDNAs reference standard was dissolved in a certain amount of pH 4.0 or pH 7.0 phosphate buffer solution (PBS) (0.01 mol/L), followed by incubation at 37 °C with shaking at 100 rpm for 2 h. And then the resulting solutions were analyzed using agarose gel electrophoresis as described above.
Stability of c-Myc-siRNA3-pDNAs on exposure to DNase I
DNase I was added to c-Myc-siRNA3-pDNAs reference standard and NPs-c-Myc-siRNA3-pDNAs at the concentration of 50 U DNase I per gram of c-Myc-siRNA3-pDNAs, followed by incubations at 37 °C for 2 h. The digestions were then stopped using a certain amount of 0.5 mol/L EDTA to obtain control solution (containing c-Myc-siRNA3-pDNAs reference standard) and test solution (containing NPs-c-Myc-siRNA3-pDNAs). Then, a certain amount of SDS (10% w/v) was added to the control solution so as to extract the c-Myc-siRNA3-pDNAs. On the other hand, the test solution was centrifuged at 21 100 g for 20 min at 4 °C, and the concentrate NPs-c-Myc-siRNA3-pDNAs were then dissolved in dichloromethane, followed by extraction of c-Myc-siRNA3-pDNAs using TE buffer. Finally, both the extracted c-Myc-siRNA3-pDNAs were analyzed using agarose gel electrophoresis as described above.
Transfection efficiency analysis and apoptosis analysis of NPs-c-Myc-siRNA3-pDNAs
NPs-c-Myc-siRNA3-pDNAs (10–15 μg/mL) were transfected into C6 cells, which were previously seeded in culture plates of 24 wells containing DMEM + 10% FBS at 37 °C, 5% CO2 for 24 h with the final cell density of 5–20 × 104 per well, with Lipofectmaine 2000 (1% v/v) following the manufacturer’s instruction. Finally, the green fluorescence protein expression was examined using a stereo fluorescence microscope after 12 h, 24 h, 48 h, and 72 h transfection.
After 48 h transfection, apoptotic C6 cells were qualified by fluorescence microscope examination following Hoechst33258 and propidium iodide double staining, and quantified by flow cytometry examination following AnnexinV-FITC and propidium iodide staining as described above.
Results
Identification of the recombinant c-Myc-siRNA-pDNAs and selection of the best c-Myc-siRNA sequence
Detection of the length and purity of the recombinant c-Myc-siRNA-pDNAs
The recombinant c-Myc-siRNA-pDNAs were qualitatively and quantitatively identified using agarose gel electrophoresis and UV spectrophotometer, respectively.
The agarose gel electrophoresis test showed that the lengths of the empty vector and the recombinant c-Myc-siRNA-pDNAs were 269 bp and 316 bp, respectively, as shown in . By calculating the difference between the two lengths, the length of the inserted c-Myc-siRNA fragment was obtained as 47 bp, which was the same as designed, consisting of a 19 bp forward sequence, a 19 bp reverse sequence, and a 9 bp loop. Additionally, the three recombinant c-Myc-siRNA-pDNAs were demonstrated to be well purified by extraction using Endofree plasmid Mega kit (Qiagen, Hilden, Germany) with the A260/A280 ratio as 1.8–1.9, .
Figure 1. Agarose gel electrophoresis image of the recombinant c-Myc-siRNA-pDNAs: M, 100 bp DNA Ladder (100–1000 bp); L1, empty vector (269 bp); L2–L4, three recombinant c-Myc-siRNA-pDNAs (316 bp).
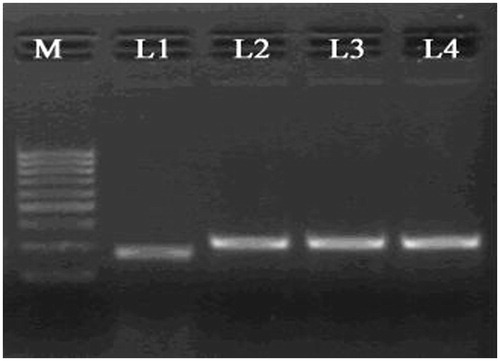
Table 1. A260/A280 ratios of siRNA-pDNAs.
Identification of the restriction enzyme sites of the recombinant c-Myc-siRNA-pDNAs
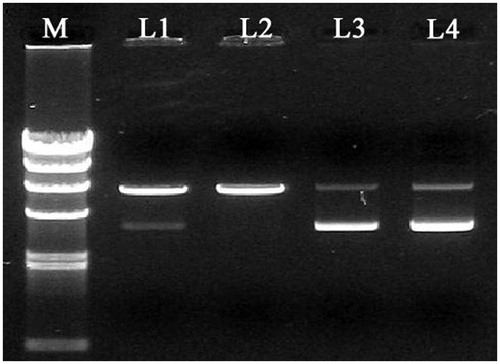
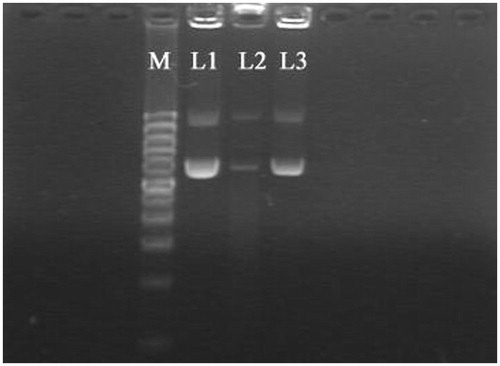
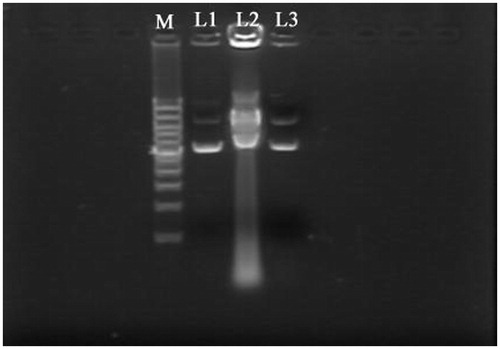
The restriction digestion followed by agarose gel electrophoresis demonstrated the both restriction enzyme sites (BamHI and HindIII) of the recombinant c-Myc-siRNA-pDNAs to be the same as designed, as shown in .
Figure 2. Representative agarose gel electrophoresis image following restriction digestion of the recombinant c-Myc-siRNA-pDNAs: M, DNA marker; L1, c-Myc-siRNA3-pDNAs cut by BamHI; L2, c-Myc-siRNA3-pDNAs cut by HindIII; L3, empty vector; L4, c-Myc-siRNA3-pDNAs.
Transfection efficiency analysis of the recombinant c-Myc-siRNA-pDNAs
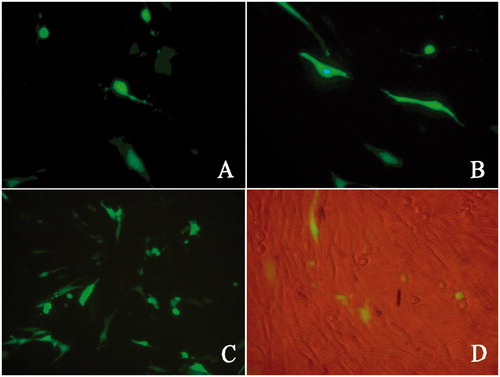
The three recombinant c-Myc-siRNA-pDNAs were transiently transfected into C6 cells with Lipofectmaine 2000 and the transfection efficiency was determined by observing the green fluorescence protein expression using a fluorescence microscope. Among the three recombinant c-Myc-siRNA-pDNAs, c-Myc-siRNA3-pDNAs exhibited the highest green fluorescent protein expression with the widest distribution and the most intensity of green fluorescence found, which indicated that c-Myc-siRNA3-pDNAs generated the highest transfection efficiency when the same transfection reagent at the same dose was used, as shown in . Additionally, compared with the normal C6 cells being fusiform-shaped and cross-linked, the C6 cells transfected with c-Myc-siRNA3-pDNAs were observed to present in single units with spherical shape and even floating found, which indicated the apoptosis of c-Myc-siRNA3-pDNA, as shown in .
Figure 3. Fluorescence photomicrographs of green fluorescent protein expression of c-Myc-siRNA3-pDNAs after 24 h transfection: (A) c-Myc-siRNA1-pDNAs, (B) c-Myc-siRNA2-pDNAs, (C) c-Myc-siRNA3-pDNAs, and (D) c-Myc-siRNA3-pDNAs (detected with fluorescent and white light overlap).
Qualitative apoptosis analysis of the recombinant c-Myc-siRNA-pDNAs
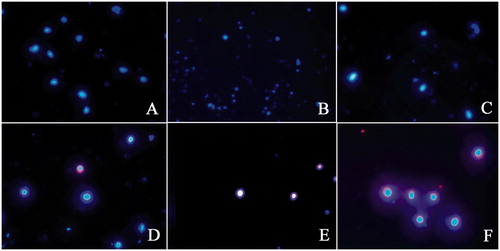
The recombinant c-Myc-siRNA-pDNAs were transfected into C6 cells, followed by staining with Hoechst33258 and propidium iodide. Then stereo fluorescence microscope was used to observe the C6 cells so as to qualitatively determine the apoptosis. In the normal control group (C6 cells) and the two negative control groups (the cells incubated with Lipofectamin 2000 only and transfected with empty siRNA vector, respectively), the cells exhibited uniform blue fluorescence with smooth surface and border as well as regular-shaped nucleus, as shown in . In the test groups (the cells transfected with c-Myc-siRNA1-pDNAs, c-Myc-siRNA2-pDNAs, and c-Myc-siRNA3-pDNAs), the nucleus withered to form compact granules and exhibited intense blue fluorescence, and some of the cells exhibited red fluorescence, which indicated the presence of apoptosis, as shown in . Among the three test groups, the cells transfected with c-Myc-siRNA3-pDNAs showed the greatest apoptosis with the most intensely green fluorescence observed in the nucleus and the most intensely red fluorescence in the cells, which indicated that late apoptosis cells and dead cells were found.
Figure 4. Fluorescence photomicrographs of Hoechst33258 and propidium iodide double staining after 24 h transfection: (A) normal C6 cells, (B) the cells incubated with Lipofectamin 2000 only, (C) the cells transfected with empty siRNA vector, (D) the cells transfected with c-Myc-siRNA1-pDNAs, (E) the cells transfected with c-Myc-siRNA2-pDNAs, and (F) the cells transfected with c-Myc-siRNA3-pDNAs.
Quantitative apoptosis analysis of the recombinant c-Myc-siRNA-pDNAs
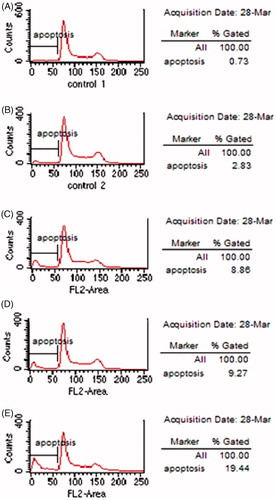
The recombinant c-Myc-siRNA-pDNAs were transfected into C6 cells, followed by incubation with AnnexinV-FITC and propidium iodide. Then flow cytometry was used to observe the C6 cells so as to quantitatively determine the apoptosis by apoptotic rate. The apoptotic rates obtained in the normal control group (normal C6 cells), the negative control group (cells transfected with empty siRNA vector), and the test groups (cells transfected with c-Myc-siRNA1-pDNAs, c-Myc-siRNA2-pDNAs, and c-Myc-siRNA3-pDNAs, respectively) were 0.73, 2.83, 8.86, 9.27 and 19.44%, respectively, as shown in , which indicated that the recombinant c-Myc-siRNA-pDNAs could cause apoptosis after transfection and the cells transfected with c-Myc-siRNA3-pDNAs generated the highest apoptotic rate.
Figure 5. Apoptotic rate of C6 cells after transfection with c-Myc-siRNA-pDNAs: (A) normal C6 cells, (B) cells transfected with empty siRNA vector, (C) cells transfected with c-Myc-siRNA1-pDNAs, (D) cells transfected with c-Myc-siRNA2-pDNAs, and (E) cells transfected with c-Myc-siRNA 3-pDNAs.
The above identification results proved that the synthesized c-Myc-siRNA sequences were the same as designed, and the c-Myc-siRNA fragments were successfully inserted into the vector. Among the three recombinant plasmids, c-Myc-siRNA3-pDNAs showed the highest transfection efficiency and the greatest apoptotic ability. Therefore, c-Myc-siRNA3-pDNAs were chosen for use in the next experiments.
Preparation and characterization of NPs-c-Myc-siRNA3-pDNAs
Transmission electron microscopic (TEM) observation proved that NPs-c-Myc-siRNA3-pDNAs were spherical in uniform size below 150 nm, as shown in . Dynamic light scattering results showed that the average number-based diameter of NPs-c-Myc-siRNA3-pDNAs was about 130 nm with the zeta potential around −18 mV. In addition, PicoGreen kit analysis displayed that the encapsulation efficiency and loading capacity of c-Myc-siRNA3-pDNAs in NPs were 76.3 ± 5.4% and 1.91 ± 0.06%, respectively. The physicochemical properties of NPs loading c-Myc-siRNA3-pDNAs are summarized in .
Figure 6. Transmission electron micrograph of NPs-c-Myc-siRNA3-pDNAs negatively stained with phosphotungstic acid solution. The black bar in the photograph refers to 300 nm.
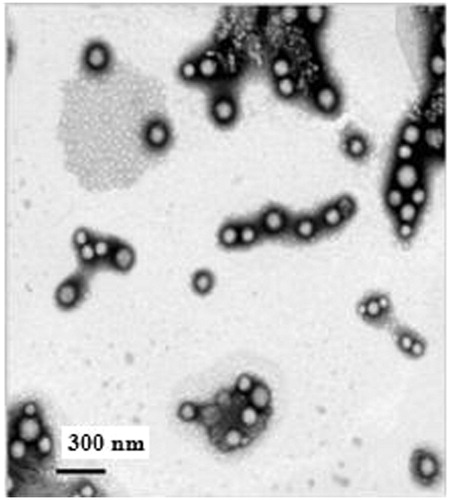
Table 2. Physicochemical properties of NPs-c-Myc-siRNA3-pDNAs.
Table 3. Apoptotic rate of C6 cells after transfection with NPs loading c-Myc-siRNA3-pDNAs (n = 3).
Stability of c-Myc-siRNA3-pDNAs
Stability of c-Myc-siRNA3-pDNAs during preparation of NPs
c-Myc-siRNA3-pDNAs may be susceptible to sonication, organic solvents, or other operations involved in the preparation of NPs. Thus the stability of c-Myc-siRNA3-pDNAs during the preparation of NPs was evaluated by examining the structure and function of the c-Myc-siRNA3-pDNAs remained in the supernatant and encapsulated in the NPs using agarose gel electrophoresis.
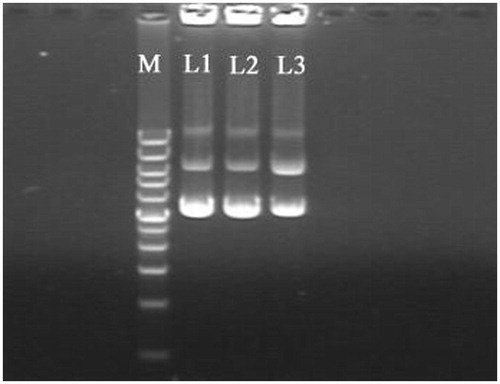
The electrophoretic bands obtained with the original c-Myc-siRNA3-pDNAs (as control) showed that c-Myc-siRNA3-pDNAs were mainly in supercoiled structure with few in open-loop. The bands obtained with c-Myc-siRNA3-pDNAs extracted from the supernatant and from the NPs were almost the same as those obtained with the control, except that tailor was detected in the bands obtained with that from the supernatant, which indicated that a few degradation fragments were produced in the supernatant while no degradation was found in the NPs. The results proved that NPs could protect c-Myc-siRNA3-pDNAs from degradation during the preparation of NPs after encapsulation. The agarose gel electrophoresis image is shown in .
Figure 7. Agarose gel electrophoresis image of c-Myc-siRNA3-pDNAs after preparation of NPs: L1, the original c-Myc-siRNA3-pDNAs; L2, c-Myc-siRNA3-pDNAs extracted from the supernatant; L3, c-Myc-siRNA3-pDNAs extracted from the NPs; M, marker.
Stability of c-Myc-siRNA3-pDNAs in acid condition
As PLGA is bio-degradable, acidic environment is formed due to the presence of glycolic acid obtained from the degradation of MPEG–PLGA-NPs after administration. Thus, the stability of c-Myc-siRNA3-pDNAs in acid condition was investigated using agarose gel electrophoresis.
The electrophoretic bands obtained with the test groups (c-Myc-siRNA3-pDNAs incubated in pH 4.0 and pH 7.0 PBS for 2 h) were the same as those obtained with the control group (original c-Myc-siRNA3-pDNAs), which indicated that the structure and function of c-Myc-siRNA3-pDNAs would not be changed on exposure to acidic hydrolysis. Therefore, it can be concluded that the structure and function of the encapsulated c-Myc-siRNA3-pDNAs will not be damaged by the degradation product (glycolic acid) of MPEG–PLGA-NPs. The agarose gel electrophoresis image is shown in .
Figure 8. Agarose gel electrophoresis image of c-Myc-siRNA3-pDNAs in acid condition: L1, original c-Myc-siRNA3-pDNAs; L2, c-Myc-siRNA3-pDNAs incubated in pH 4.0 PBS for 2 h; L3, c-Myc-siRNA3-pDNAs incubated in pH 7.0 PBS for 2 h; M, marker.
Stability of c-Myc-siRNA3-pDNAs on exposure to DNase I
c-Myc-siRNA3-pDNAs will be rapidly degraded in the plasma, tissue fluid, cytoplasm, and lysosomes due to the presence of DNase, which restricts the administration of c-Myc-siRNA3-pDNAs. The effects of NPs on preventing c-Myc-siRNA3-pDNAs from DNase degradation were investigated using agarose gel electrophoresis.
The electrophoretic bands obtained with test solution (prepared with NPs-c-Myc-siRNA3-pDNAs and DNase I) were the same as those obtained with the original c-Myc-siRNA3-pDNAs, but tailor and new bands were obtained with the control solution (prepared with c-Myc-siRNA3-pDNAs and DNase I), which indicated that the designed MPEG–PLGA-NPs could prevent c-Myc-siRNA3-pDNAs well from DNase I degradation. Therefore, it is possible to use MPEG–PLGA-NPs as the carriers of c-Myc-siRNA3-pDNAs for the administration. The agarose gel electrophoresis image is shown in .
Figure 9. Agarose gel electrophoresis image of c-Myc-siRNA3-pDNAs on exposure to DNase I: L1, original c-Myc-siRNA3-pDNAs; L2, original c-Myc-siRNA3-pDNAs incubated with DNase I for 2 h; L3, NPs-c-Myc-siRNA3-pDNAs incubated with DNase I for 2 h; M, marker.
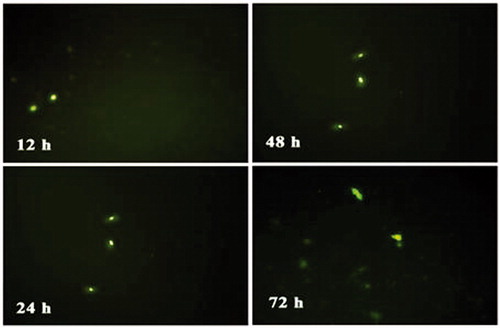
Transfection efficiency analysis of NPs-c-Myc-siRNA3-pDNAs
NPs-c-Myc-siRNA3-pDNAs were transiently transfected into C6 cells with Lipofectmaine 2000, and the transfection efficiency was determined by observing the green fluorescence protein expression using a fluorescence microscope. Green fluorescence was observed after 12 h, 24 h, 48 h, and 72 h transfection, which proved the positive transfection efficiency and expression ability of c-Myc-siRNA3-pDNAs after released from the NPs. The fluorescence photomicrographs are shown in .
Figure 10. Fluorescence photomicrographs of green fluorescent protein expression of NPs-c-Myc-siRNA3-pDNAs after transfection for 12 h, 24 h, 48 h, and 72 h.
Qualitative apoptosis analysis of NPs-c-Myc-siRNA3-pDNAs
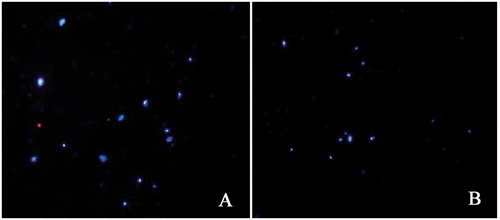
NPs-c-Myc-siRNA3-pDNAs were transfected into C6 cells, followed by staining with Hoechst33258 and propidium iodide. Then stereo fluorescence microscope was used to observe the C6 cells so as to qualitatively determine apoptosis. In the normal control group (C6 cells), the cells exhibited uniform blue fluorescence with smooth surface and border as well as regular-shaped nucleus, as shown in . In the test group (the cells transfected with NPs-c-Myc-siRNA3-pDNAs), the nucleus withered to form compact granules and exhibited strong blue fluorescence and the cells were found to be half-moon-shaped with irregular border as well as few red fluorescence observed in the cells, which indicated the presence of apoptosis, as shown in .
Figure 11. Fluorescence photomicrographs of C6 cells transfected with NPs-c-Myc-siRNA3-pDNAs after Hoechst33258 and propidium iodide double staining: (A) normal C6 cells and (B) C6 cells transfected with NPs-c-Myc-siRNA3-pDNAs for 48 h.
Quantitative apoptosis analysis of NPs-c-Myc-siRNA3-pDNAs
NPs-c-Myc-siRNA3-pDNAs were transfected into C6 cells, followed by incubation with AnnexinV-FITC and propidium iodide. Then flow cytometry was used to observe the C6 cells so as to quantitatively determine the apoptosis by apoptotic rate. The apoptotic rates obtained in the normal control group (normal C6 cells) and the test groups (cells directly incubated with c-Myc-siRNA3-pDNAs without the help of transfection reagent, and cells transfected with NPs-c-Myc-siRNA3-pDNAs) were 5.13 ± 1.55, 5.08 ± 1.52, and 24.77 ± 5.39%, respectively, , which indicated that NPs-c-Myc-siRNA3-pDNAs generated significant apoptosis after transfection into C6 cells; however, c-Myc-siRNA3-pDNAs failed to exhibit obvious apoptosis without the help of transfection reagent.
Discussion
This study demonstrated the feasibility of preparing NPs-c-Myc-siRNA3-pDNAs by a double-emulsion solvent-evaporation technique without damaging the structure and function of c-Myc-siRNA3-pDNAs during the preparation process. After administration, NPs could protect the loaded c-Myc-siRNA3-pDNAs from DNase I degradation and c-Myc-siRNA3-pDNAs would remain positive transfection efficiency and apoptotic ability after released from NPs. These results suggest that MPEG–PLGA-NPs may have potential as an alternative delivery carrier for c-Myc-siRNA3-pDNAs. In order to enhance the apoptotic ability of this delivery system, the surface of NPs will be modified with cationization agents in our further studies so as to neutralize the negative zeta potential of NPs and then facilitate the NPs to be absorbed onto the negative biomembrane.
Conclusions
c-Myc-siRNA3-pDNAs with positive transfection efficiency and apoptosis were successfully established. Also, MPEG–PLA-NPs were demonstrated to be potential delivery carriers for this c-Myc targeting pDNAs.
Declaration of interest
The authors report no conflicts of interest. The authors alone are responsible for the content and writing of this article.
References
- Aagaard L, Rossi JJ. (2007). RNAi therapeutics: Principles, prospects and challenges. Adv Drug Deliv Rev 59:75–86
- Anderson JM, Shive MS. (1997). Biodegradable and biocompatibility of PLA and PLGA microspheres. Adv Drug Deliv Rev 28:5–24
- Filipowicz W. (2005). RNAi: The nuts and blots of the RISC machine. Cell 122:17–20
- Genc DB, Canpolat C, Berrak SG. (2011). Clinical features and management of carboplatin-related hypersensitivity reactions in pediatric low-grade glioma. Support Care Cancer 20:385–93
- Goellner EM, Grimme B, Brown AR, et al. (2011). Overcoming temozolomide resistance in glioblastoma via dual inhibition of NAD+ biosynthesis and base excision repair. Cancer Res 71:2308–17
- Herms JW, von Loewenich FD, Behnke J, et al. (1999). c-Myc oncogene family expression in glioblastoma and survival. Surg Neurol 51:536–42
- Hu YH, Kong SQ, Kong HB, et al. (2012). Targeting c-Myc on cell growth and vascular endothelial growth factor expression in IN500 glioblastoma cells. Chinese Med J 125:2025–31
- Jain RK, di Tomaso E, Duda DG, et al. (2007). Angiogenesis in brain tumours. Nat Rev Neurosci 8:610–22
- Jensen NA, Pedersen KM, Lihme F, et al. (2003). Astroglial c-Myc overexpression predisposes mice to primary malignant gliomas. J Biol Chem 278:8300–8
- Lefranc F, Sadeghi N, Camby I, et al. (2006). Present and potential future issues in glioblastoma treatment. Expert Rev Anticancer Ther 6:719–32
- Li Y, Pei Y, Zhang X, et al. (2001). PEGylated PLGA nanoparticles as protein carriers: Synthesis, preparation and biodistribution in rats. J Control Release 71:203–11
- Lu W, Wan J, She Z, Jiang X. (2007). Brain delivery property and accelerated blood clearance of cationic albumin conjugated pegylated nanoparticle. J Control Release 118:38–53
- Moghimi SM, Hunter AC, Murray JC. (2001). Long-circulating and target specific nanoparticles: Theory to particle. Pharmacol Rev 53:283–318
- Ong BY, Ranganath SH, Lee LY, et al. (2009). Paclitaxel delivery from PLGA foams for controlled release in post-surgical chemotherapy against glioblastoma multiforme. Biomaterials 30:3189–96
- Orian JM, Vasilopoulos K, Yoshida S, et al. (1992). Overexpression of multiple oncogenes related to histological grade of astrocytic glioma. Br J Cancer 66:106–12
- Prabha S, Labhasetwar V. (2004). Critical determinants in PLGA/PLA nanoparticle-mediated gene expression. Pharm Res 21:354–64
- Wang J, Wang H, Li Z, et al. (2008). c-Myc is required for maintenance of glioma cancer stem cells. PLoS One 3:e3769
- Zambaux MF, Bonneaux F, Gref R, et al. (2001). Protein C-loaded monomethoxypoly(ethylene oxide)-poly(lactic acid) nanoparticles. Int J Pharm 212:1–9