
Abstract
Context: Glycosmis parva Craib (Rutaceae) is reported to have cytotoxic and anti-inflammatory activities by decreasing COX-2 expression.
Objective: To investigate the effect of G. parva on human colorectal cancer cells expressing COX-2, HT-29 cells.
Materials and methods: HT-29 cells were treated with ethyl acetate extract from the leaves of G. parva (GPE 6.25–100 µg/ml) for 24–72 h. Cell viability was evaluated by the resuzurin reduction assay. An apoptotic study was performed using annexinV/FITC-PI staining. The cell-cycle pattern was investigated by PI staining. The expression of BCL-2 family genes was analyzed by quantitative RT-PCR and expression of cyclins and COX-2 were done by RT-PCR.
Results: GPE at 6.25–100 µg/ml reduced HT-29 cell viability with IC50 values of 69.49, 55.89, and 48.94 µg/ml at 24, 48, and 72 h, respectively. HT-29 apoptosis was induced by 18.23% at 100 µg/ml. Cells in S phase decreased by 5.22% and 13.28% at 50 and 100 µg/ml, respectively, causing G0/G1 (10.6% at 50 µg/ml) and G2/M (15.67% at 100 µg/ml) accumulation. GPE at 50 µg/ml downregulated cyclin A (11.46%), cyclin E (17.98%), BCL-2 (0.32-fold), and COX-2 (29.06%) expression with an increased BAK expression (1.79-fold).
Discussion and conclusion: GPE reduced HT-29 cell viability, inhibited cell proliferation, induced apoptosis, and arrested the cell cycle. Underlying mechanisms may involve decreases in COX-2, cyclin A, and cyclin E expression in addition to changes in BCL-2 family gene expression. Fundamental knowledge of GPE anticancer effects found in this study could lead to future use of this compound for colorectal cancer treatment.
Introduction
Colorectal cancer (CRC) is one of the most commonly diagnosed cancers worldwide. It ranks third in males and second in females with over 1.2 million new cancer cases each year. Despite the advances in novel cancer therapeutic agents, colorectal cancer remains the leading cause of malignancy-related death with approximately 608 700 deaths estimated to have occurred in 2008 worldwide (Jemal et al., Citation2011).
Fluoropyrimidines base, 5-fluorouracil (5-FU), has been the first line therapy in colorectal cancer for over 40 years (de Gramont et al., Citation2000). Other standard cytotoxic drugs used in treating metastatic colorectal cancer are capecitabine, irinotecan, and oxaliplatin (Tol et al., Citation2009). Many new targeted therapies have been approved for use in addition to standard chemotherapy for treating advanced colorectal cancer including antivascular endothelial growth factor and antiepidermal growth factor receptor. However, these agents come with an increase in toxicity and treatment costs (Lievre et al., Citation2006).
During the past decade, epidemiologic studies have shown that patients taking non-steroidal anti-inflammatory drugs (NSAIDs), such as aspirin, have approximately a 40–50% reduction in mortality from CRC (Koehne & Dubois, Citation2004). As elevated COX-2 expression was found in approximately 50% of adenomas and 85% of adenocarcinomas, it was hypothesized that NSAIDs exert some anti-inflammatory and antitumor effects through inhibition of cyclooxygenase-2 (COX-2) (Wang & Dubois, Citation2010). Recently, COX-2 inhibition has become an interesting approach for prevention and treatment of CRC.
The discovery of agents that regulate biological pathways related to the COX-2 pathway may provide new avenues for the treatment of CRC. Major attention has been focused on identifying phytochemicals that can inhibit tumor development processes (Siripong et al., Citation2006, Citation2009). Glycosmis parva Craib (Rutaceae) is a wild small shrub found in Thailand. The genus Glycosmis is a rich source of acridone alkaloids and sulfur-containing propanamides. Many biological activities of acridone alkaloids have been reported, such as antimalarial, antiviral, antitumor, and antiproliferative effects (Chansriniyom et al., Citation2009). Previous work from our laboratory has shown that the ethyl acetate (EtOAc) extract from the leaves of G. parva (GPE) reduced mRNA expression of COX-2 in LPS-activated macrophage J774A.1 cells and exhibited potent cytotoxic activity against human B-cell lymphoma. Glycosmis parva has interesting pharmacological properties involved with COX-2 pathway that could be further explored regarding chemotherapy and chemoprevention. This study, therefore, investigates the effect of the EtOAc extract from the leaves of G. parva on human colorectal cancer cells and its underlying mechanism of action.
Materials and methods
Cell cultures
Human colorectal cancer cell lines, HT-29, were obtained from the American Type Culture Collection (ATCC, Manassas, VA). HT-29 was maintained in Dulbecco’s modified Eagle’s medium (DMEM) supplemented with 10% fetal bovine serum and penicillin (100 units/ml), streptomycin (0.1 mg/ml) at 37 °C in a humidified atmosphere with 5% CO2. Cells in the exponential growth phase with over 95% viability were used in the experiments.
Tested compounds and chemicals
The leaves of G. parva were collected at Sakaerat, Wang Nam Khieo District, Nakorn Ratchasima province, Thailand, in December 2007. A voucher specimen (NSR 510209) was authenticated by Assoc. Prof. Nijsiri Ruangrungsi, College of Public Health Sciences, Chulalongkorn University and has been deposited at the Department of Pharmacognosy and Pharmaceutical Botany, Faculty of Pharmaceutical Sciences, Chulalongkorn University, Thailand. The GPE is a part of a previous solvent partitioned extraction method (Chansriniyom et al., Citation2009). Briefly, the dried leaves of G. parva were ground and macerated with methanol. The methanol extract was partitioned with hexane to give hexane fraction. Water was added to the remaining layer and further partitioned with EtOAc for the EtOAc extract. All solvents were removed by evaporation and the extracts in solid form were stored at −20 °C prior to use. The yield of EtOAc extract was 2.08% of dried G. parva leaves. Repeated chromatography of the GPE using solvent systems of MeOH–CHCl3, acetone–hexane, and acetone–CHCl3 led to the isolation of one acridone alkaloid, arborinine (2.56 × 10⁻³% of dried leaves), and four sulfur-containing propanamide derivatives, S-deoxydihydroglyparvin (5.83 × 10⁻⁴% of dried leaves), S-deoxytetrahydroglyparvin (3.13 × 10⁻⁴% of dried leaves), glyparvin-A (3.13 × 10⁻⁴% of dried leaves), and dihydroglyparvin (1.67 × 10⁻⁴% of dried leaves) (Chansriniyom et al., Citation2009). A stock solution of 50 mg/ml GPE in 100% dimethylsulfoxide (DMSO) was prepared, protected from light, and stored at −20 °C. GPE stock solutions were freshly prepared by diluting with DMSO to desired concentrations. Standard cytotoxic drug, 5-FU, was used as a positive control while 0.2% DMSO was used as a negative control. The following reagents were used in this study; Resazurin (Sigma, St. Louis, MO), annexin V apoptosis detection kit (Invitrogen, Carlsbad, CA), propidium iodide (Santa Cruz Biotechnology, Santa Cruz, CA), TRIzol® Reagent (Invitrogen, Carlsbad, CA), Improm-II™ reverse transcription system (Promega, Madison, WI), and TaqMan® Gene Expression System (Applied Biosystems, Foster City, CA).
Cell viability
The effect of GPE on cell viability was quantified using the resazurin reduction assay. HT-29 cells at 5 × 10⁴ cells/ml were seeded in 96-well plates for 24 h. Cells were treated with GPE at 6.25, 12.5, 25, 50, and 100 µg/ml for 24, 48, and 72 h. Viability of treated cells was determined by adding 50 µg/ml resazurin solution. Individual well absorbance was measured at 570 and 600 nm. Percentages of cell viability were determined by comparison with untreated control.
Induction of apoptosis
Apoptosis was measured using annexinV-FITC/PI staining. HT-29 cells at 5 × 10⁴ cells/ml in 6-well plates were incubated for 24 h. Cells were treated with GPE at 25, 50, and 100 µg/ml for 24 h. Treated cells were collected by trypsinization, washed twice with cold PBS, resuspended in an assay buffer, stained with 1 µl annexin V-FITC and 0.001 µg/ml propidium iodide (PI) for 15 min in the dark at room temperature, and 3 × 10⁴ cells/sample were immediately analyzed by a fluorescence flow cytometer (FAC Calibur, BD Bioscience, San Jose, CA).
Antiproliferative study
Cell proliferation was determined using an automated cell counter. HT-29 cells at 5 × 10⁴ cells/ml in 6-well plates were incubated for 24 h. Cells were treated with GPE at 25, 50, and 100 µg/ml for 24 h. Treated cells were collected, washed twice with cold PBS, and resuspended in cold PBS. The number of cells in each well were counted using Scepter™ Handheld Automated Cell Counter (EMD Millipore, Billerica, MA).
Cell-cycle analysis
The effect of GPE on HT-29 cycle phase distribution was assessed using PI staining. Briefly, HT-29 cells at 5 × 10⁴ cells/ml in 6-well plates were incubated for 24 h. Cells were treated with GPE at 50 and 100 µg/ml for 1 h. Treated cells were washed twice with incomplete DMEM and incubated in a fresh medium for additional 24 h. Cells were then collected, washed twice with cold PBS, and fixed with 70% ethanol for 15 min at −20 °C. Fixed cells were washed twice with cold PBS, resuspended in an assay buffer, treated with RNAse for 30 min at room temperature, and stained with 0.001 µg/ml PI for 15 min in the dark at room temperature. Cell-cycle pattern of 3 × 10⁴ cells/sample were immediately analyzed using fluorescence flow cytometer (FAC Calibur, BD Bioscience, San Jose, CA). Cell-cycle distributions were evaluated using FCS Express 4 Image Cytometry (De Novo Software, Laguna Niguel, CA).
BCL-2 family gene expression
HT-29 cells were treated with GPE for 24 h. Adhered cells and floating cells were collected to continue the RNA isolation step using TRIzol® reagent. The RNA samples were reverse transcribed to cDNA by Improm II™ reverse transcription system according to the manufacture’s protocols. Quantitative reverse transcription polymerase chain reactions (Q-RT-PCR) were carried out for BCL-2 (Hs00608023_m1), BCL-XL (Hs00236329_m1), BAK (Hs00832876_g1), and BAX (Hs00180269_m1) genes in each sample using TaqMan® Gene Expression System (Applied Biosystem, Foster City, CA). The expressions of gene of interest were compared with a housekeeping gene, GAPDH. Assays were done in 10 µl singleplex reactions containing TaqMan® Gene Expression Master Mix, TaqMan® Gene Expression Assay Mix (containing specific primers and probes for genes of interest), and sample of cDNA template. Reaction conditions consisted of preincubation at 50 °C for 2 min and 95 °C for 10 min, then cycling for 45 cycles of 95 °C for 15 s and 60 °C for 1 min using StepOnePlus Real-Time PCR System (Applied Biosystem, Foster City, CA). Quantification of gene expression levels was calculated using this formula: relative quantitation (RQ) = , where CT indicates cycle threshold.
Expression of COX-2 and cell-cycle regulatory genes
HT-29 cells were treated with GPE for 24 h to determine COX-2 expression while cells that were treated with GPE for 1 h and incubated with fresh medium without GPE for additional 24 h were used to examine cell-cycle regulatory gene expression. Levels of COX-2 and cell-cycle regulatory genes were determined by RT-PCR followed by gel electrophoresis. Briefly, total RNA was extracted using TRIzol® reagent and reverse transcribed to cDNA by Improm II™ reverse transcription system according to the manufacturer’s protocols. PCR amplification of target genes were done using a PCR thermal cycler (Eppendrof, Hamburg, Germany) and the house keeping gene, GAPDH, was used as a loading control. The oligonucleotides used as specific primers for each gene were as follows: GAPDH: forward 5′-AAG GTC GGA GTC AAC GGA TTT GGT-3′, reverse 5′-ATG GCA TGG ACT GTG GTC ATG AGT-3′; COX-2: forward 5′-TTC AAA TGA GAT TGT GGG AAA AT-3′, reverse 5′-AGA TCA TCT CTG CCT GAG TAT CTT-3′; p53: forward 5′-CAT GAG CGC TGC TCA GAT AG-3′, reverse 5′-CTG AGT CAG GCC CTT CTG TC-3′; p21: forward 5′-GCG ATG GAA CTT CGA CTT TGT-3′, reverse 5′-GGG CTT CCT CTT GGA GAA GAT-3′; Cyclin A: forward 5′-GTC ACC ACA TAC TAT GGA CAT G-3′, reverse 5′-AAG TTT TCC TCT CAG CAC TGA C-3′; Cyclin B1: forward 5′-CGG GAA GTC ACT GGA AAC AT-3′, reverse 5′-AAA CAT GGC AGT GAC ACC AA-3′; Cyclin D1: forward 5′-CTG GCC ATG AAC TAC CTG GA-3′, reverse 5′-GTC ACA CTT GAT CAC TCT GG-3′; Cyclin E: forward 5′-AAT AGA GAG GAA GTC TGG-3′, reverse 5′-AGA TAT GAC ACC TGC ATG-3′. Conditions for PCR reaction were 1 × (94 °C for 2 min); 35 × (94 °C for 30 s; Tm of each primer for 30 s; and 72 °C for 1 min) and 1 × (72 °C for 10 min). PCR products were analyzed by 1.5% agarose gel electrophoresis, stained with 0.5 µg/ml ethidium bromide, and determined the band densities by gel documentation using Gel Doc™ XR + System and Image Lab™ software (Bio-rad, Berkeley, CA).
Data analysis
All data were presented as mean ± S.E. Statistical evaluations were determined by one-way analysis of variance (ANOVA) followed by Tukey’s post hoc test. Any p values less than 0.05 were considered statistically significant. All assays were performed in duplicate or triplicate of three independent experiments.
Results
GPE reduces HT-29 cell viability
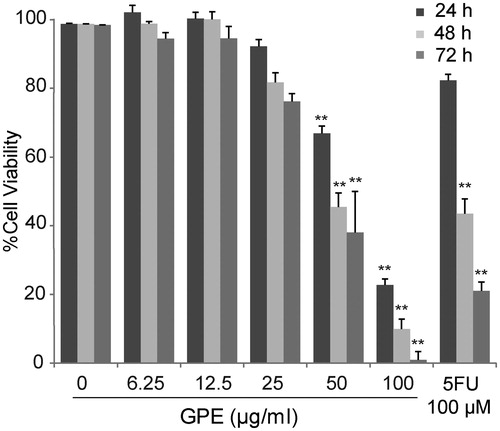
HT-29 cells were exposed to 6.25–100 µg/ml of GPE. As shown in , 50 and 100 µg/ml of the extract significantly reduced HT-29 cell viability with the IC50 of 69.49 ± 2.04, 55.89 ± 1.86, and 48.94 ± 2.99 µg/ml at 24, 48, and 72 h, respectively. The decrease in cell viability was seen in a dose-dependent manner. At 24 h exposure, GPE at 50–100 µg/ml can decrease HT-29 cell viability over 5-FU 100 µM.
Figure 1. Effect of GPE on HT-29 cell viability. The cells were treated with GPE at 6.25–100 µg/ml for 24, 48, and 72 h. The cell viability was determined by the resazurin reduction assay. The data represent the means ± S.E. of three independent experiments. *p < 0.05, **p < 0.01.
GPE induces apoptosis in HT-29 cells
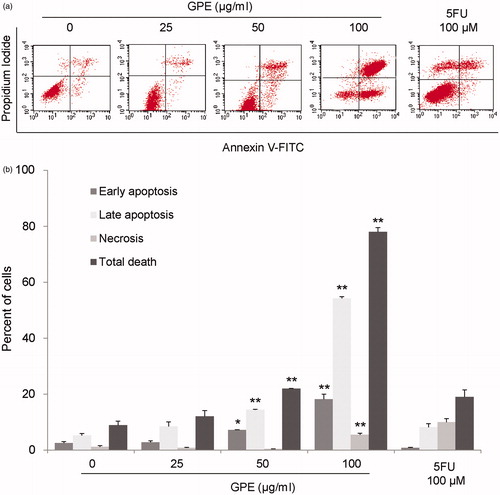
Induction of apoptosis is the main effect of many cytotoxic drugs to induce cancer cell death (Debatin, Citation2004). GPE at 50 and 100 µg/ml significantly induced apoptotic cell death in HT-29 after 24 h exposure by 7.15 ± 0.11% and 18.23 ± 1.71%, respectively (). While 100 µM 5FU at 24 h did not significantly induce apoptotic cell death in HT-29 cells since the majority of cells remained viable.
Figure 2. GPE induces apoptosis in HT-29 cells. The cells were treated with GPE 25–100 µg/ml for 24 h. The treated cells were stained with Annexin V-FITC/PI and analyzed by flow cytometry. (a) Representative flow cytometric analysis. (b) The percentages of cells labeled with annexin V+/PI− (early apoptotic cells), annexin V+/PI+ (late apoptotic cells), annexin V−/PI+ (necrotic cells), and total cell death were plotted. Data are the mean values ± S.E. of three independent experiments. *p < 0.05, **p < 0.01.
GPE inhibits HT-29 cells proliferation
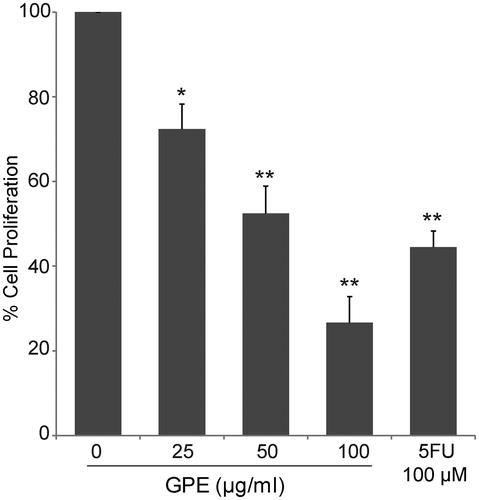
Besides the ability of GPE to induce cancer cell death, its capability to inhibit cancer cell proliferation is also contributed to the reduction in cell viability. Inhibition of HT-29 cell proliferation by GPE was determined by cell counting. After treated HT-29 cells with GPE for 24 h, total cells were counted. The results were expressed as a percentage of cells compared with the untreated control (100% cell proliferation). Percentages of cell proliferation were significantly decreased to 72.40 ± 5.83%, 52.46 ± 6.45%, and 26.68 ± 6.12% following GPE 25, 50, and 100 µg/ml treatment, respectively (). Cell proliferation inhibition effects of GPE against HT-29 were similar to that of 5FU which 100 µM 5FU significantly decreased cell proliferation to 44.47 ± 0.07%.
Figure 3. Antiproliferative effects of GPE against HT-29 cells. The cells were treated with GPE (25–100 µg/ml) for 24 h. Cell proliferation was measured by cell counting using an automated cell counter. The data represent the means ± S.E. of three independent experiments. *p < 0.05, **p < 0.01.
GPE causes cell-cycle arrest in HT-29 cells
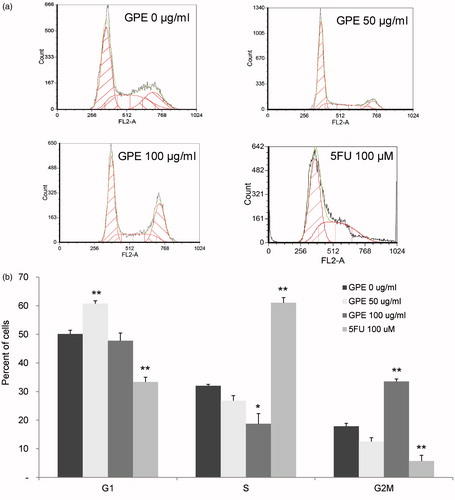
To determine whether suppression of cell proliferation by GPE resulted from inhibition of cell-cycle progression, HT-29 cells were treated with GPE for 1 h and further incubated for 24 h in a fresh medium without GPE. Treated cells were subjected to fluorescence flow cytometric analysis for DNA content. GPE at 50 and 100 µg/ml caused a decrease in the proportion of cells in the S phase. In cells treated with 50 µg/ml GPE, this decrease (from 32.0 ± 0.51% to 26.78 ± 1.76%) was associated primarily with accumulation of cells in the G0/G1 phase (from 50.13 ± 1.28% to 60.73 ± 0.98%). At a higher concentration, GPE (100 µg/ml) resulted in a significant reduction in the S fraction (from 32.0 ± 0.51% to 18.72 ± 3.55%) with a shift of cell accumulation to the G2/M phases (from 17.86 ± 1.04% to 33.53 ± 0.85%) as shown in . The positive control, 5FU, significantly accumulated cell populations at S fraction with the reduction of cells in G0/G1 and G2/M phases.
Figure 4. Distribution of HT-29 cells in the cell-cycle phases after treatment with GPE. HT-29 cells were treated with GPE 50 and 100 µg/ml for 1 h and further incubated in fresh medium for 24 h. Analysis of cells in the cell cycle was performed by fixing and staining the treated cells with PI followed by fluorescence flow cytometry. (a) Representative flow cytometric analysis. (b) The percentage of cells in G1, S, and G2M phases. Values are means ± S.E. of three independent experiments. *p < 0.05, **p < 0.01.
GPE changes the expression of BCL-2 family genes in HT-29 cells
Apoptosis is regulated by a variety of proapoptotic and antiapoptotic BCL-2 family proteins. To evaluate the mechanism by which GPE induced apoptosis in HT-29, we assessed the mRNA expression of BCL-2 family genes by quantitative RT-PCR. After treated HT-29 cells with GPE for 24 h, cells were subjected to RNA isolation, cDNA conversion, and PCR amplification of target genes. GPE at 25 and 50 µg/ml increased expression of proapoptotic BAK to 1.25 ± 0.16 and 1.79 ± 0.08, respectively. The expression of antiapoptotic BCL-2 was downregulated to 0.68 ± 0.21 and 0.32 ± 0.13 following GPE 25 and 50 µg/ml treatment, respectively. The ratio of proapoptotic/antiapoptotic (BAK and BAX/BCL-2 and BCL-XL) was a 2.45-fold increase in the GPE 50 µg/ml treated cells ().
Figure 5. GPE alters the expression of BCL-2 family, COX-2, and cell-cycle regulators mRNA. (a) Expression of BCL-2 family genes by quantitative RT-PCR. The mRNA expression levels of BAK, BAX, BCL-2, and BCL-XL of HT-29 cells treated with GPE 25 and 50 µg/ml for 24 h were determined. The value is given as relative copy number normalized to the endogenous control GAPDH and 0.2% DMSO control. (b) COX-2 expression in HT-29 cells treated with GPE for 24 h. Expression of COX-2 was determined by RT-PCR. The percentage of PCR product of the COX-2 gene was normalized with the GAPDH and compared with the expression levels of the 0.2% DMSO control. (c) The HT-29 cells were treated with GPE for 1 h and incubated with fresh medium without GPE for additional 24 h. Expression of cell-cycle regulators were determined by RT-PCR. Representative bands of PCR products of the cell-cycle regulatory genes were shown. (d) The percentage of PCR product of the cell-cycle regulatory genes. The data represent the means ± S.E. of three independent experiments. *p < 0.05, **p < 0.01.
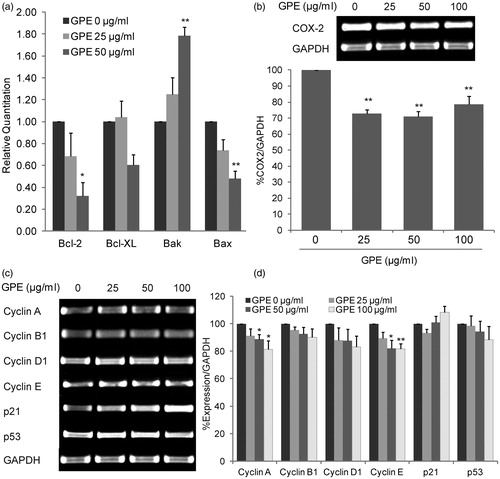
GPE downregulates COX-2, cyclin A and cyclin E expression in HT-29 cells
COX-2 is an important growth factor involved the carcinogenesis of colorectal cancer (Markowitz & Bertagnolli, Citation2009). The effect of GPE on COX-2 mRNA expression was investigated in HT-29 cells which are constitutively expressed COX-2. GPE at the concentration of 25, 50, and 100 µg/ml significantly inhibited COX-2 mRNA expression 27.11%, 29.06, and 21.39%, respectively, after 24 h of treatment (). Since GPE caused HT-29 cell-cycle accumulation at G0/G1 and G2/M phase, changes in the expression of cell-cycle regulatory genes might be involved. As shown in , GPE at concentrations of 50 and 100 µg/ml significantly downregulated cyclin A (11.46% and 18.56%, respectively) and cyclin E (17.98% and 18.45%, respectively) expression. However, the level of cyclin B1, cylin D1, p21, and p53 remained unchanged.
Discussion
In this study, we examined the effects of EtOAc extract from the leaves of G. parva (GPE) on human colorectal cancer, HT-29 cells. The extract exhibited a reduction in cell viability, inhibition of cell proliferation, induction of apoptosis, and arrested cell cycle. Further studies suggested that the effects of GPE on HT-29 cells may be mediated through the reduction in COX-2, cyclin A, and cyclin E expression in addition to alteration in the balance of BCL-2 family gene expression.
Throughout medical history, plant products have been shown to be valuable sources of novel anticancer drug discovery (Mans et al., Citation2000). Chemical examination of the EtOAc extract from the leaves of G. parva led to the identification of the acridone alkaloid and sulfur-containing propanamides as its major active compounds. Arborinine, a main acridone alkaloid found in EtOAC of the leaves of G. parva, has been reported to have potent antiproliferative effects against cervix adenocarcinoma HeLa cells with an IC50 of 1.84 µM, which was lower than that of cisplatin (12.43 µM) (Rethy et al., Citation2007), indicating that arborinine possesses higher antiproliferative activity than cisplatin. Additionally, antifungal activities of sulfur-containing propanamides derivative, S-deoxydihydroglyparvin, S-deoxytetrahydroglyparvin, glyparvin-A, and dihydroglyparvin were reported (Chansriniyom et al., Citation2009; Greger et al., Citation1993). In the present study, we show that GPE possessed moderate reduction in HT-29 cell viability with an IC50 of 69.49 µg/ml after 24 h exposure (). The reduction in cell viability was seen in a concentration-dependent manner.
Treatment of cancer with ionizing radiation and several anticancer drugs kills target cells primarily by induction of apoptosis (Fisher, Citation1994). We found that GPE at 50 and 100 µg/ml significantly induced apoptotic cell death (). The proportion of apoptotic cell to total cell death was higher than that of currently used cytotoxic drugs, cisplatin, oxaliplatin, and 5FU which were used as positive controls in this study. Activation of apoptosis signaling following treatment with cytotoxic drugs has been shown to lead to the activation of the mitochondrial (intrinsic) pathway of apoptosis (Debatin, Citation2004). BCL-2 family proteins play a pivotal role in the regulation of the mitochondrial pathway of apoptosis. They are composed of both antiapoptotic members – e.g., BCL-2, BCL-XL, and MCL-1 – and proapoptotic molecules such as BAX, BAK, and Bad (Antonsson & Martinou, Citation2000). As shown in , GPE increased the expression of proapoptotic BAK while it downregulated the antiapoptotic BCL-2. Although GPE decreased antiapoptotic BCL-XL expression, the ratio of proapoptotic/antiapoptotic (BAK and BAX/BCL-2 and BCL-XL) was designated as cancer cell death. The effect of GPE on mRNA expression of the BCL-2 family genes was performed after a 24 h treatment. However, mRNA analysis at earlier time points (6–12 h), before significant cell death could be detected, may better explain its mechanism of apoptosis.
Cell proliferation is a key character of cancer progression (Hanahan & Weinberg, Citation2011). Our study showed that GPE inhibited HT-29 cell proliferation (). These effects were found significantly across the experimental dose range (25–100 µg/ml). The ability of anticancer agents to suppress the growth of cancer cells can also be associated with blocking cell-cycle progression (Agarwal et al., Citation2003). Based on the significant inhibition of HT-29 cell proliferation by GPE, it was postulated that the extract might modulate the cell-cycle progression of these cancer cells. Cell-cycle distribution analysis showed that GPE caused a reduction in S phase population, which was associated with the accumulation of cells in the G0/G1 phase at a concentration of 50 µg/ml (). At higher concentrations of GPE, treated cells accumulated at the G2/M phases. This result may be in part due to more than one active compound present in the extract affecting the cell cycle but at different phases of the cycle. Additional studies to identify active compounds presented in the EtOAc extract are warranted.
Cyclin-dependent kinases (CDKs) and cyclins are important determinants in the regulation of cell-cycle progression. As the cells progress from G1 to mitosis, a series of CDKs is expressed along with that of cyclins (Park & Lee, Citation2003). Cell-cycle arrest involves downregulation of cyclins and CDKs as well as upregulation of cyclin-dependent kinase inhibitors (CDKIs) (Ahmad et al., Citation2012). Cyclin E/CDK2 and cyclin A/CDK2 complexes play an important role in G1-S transition and DNA replication, respectively. Moreover, cyclin A can form a complex with CDC2, which is essential for mitosis (Park & Lee, Citation2003). Our data in indicate that GPE downregulated mRNA expression of cyclin A and cyclin E. This may explain why GPE could induce cell-cycle arrest.
Cyclooxygenase enzymes are required for the conversion of arachidonic acid to prostaglandins. COX-2 mediates the inflammatory effects of COX activity. It is induced by a wide spectrum of growth factors and proinflammatory cytokines and overexpressed in numerous premalignant and malignant lesions, including CRC. Treatment with the selective COX-2 inhibitor has shown promising results in the prevention of CRC (Koehne & Dubois, Citation2004). However, the dose-related cardiovascular toxicity of selective COX-2 inhibitors remains a concern (Bresalier et al., Citation2005). Discovery of agents that regulate biological pathways related to COX-2 pathway may provide new avenues for the treatment of CRC. This study demonstrated that GPE at 25–100 µg/ml significantly inhibited COX-2 mRNA expression in human colorectal cancer cells, HT-29, which constitutively expressed COX-2 ().
Conclusions
The anticancer activity of the EtOAc extract from the Glycosmis parva leaf on human colorectal cancer cells and its underlying mechanism involved with cyclins, BCL-2, and COX-2 pathways found in this study warrant further investigation in the development of potential chemopreventive agents in colorectal cancer treatment.
Acknowledgements
We would like to thank Miss Supranee Buranapraditkun for her technical assistance on flow cytometry and Dr. Piyanuch Wonganan for helpful suggestions.
Declaration of interest
The authors have no conflicts of interest to declare. This study was supported by grants from the Chulalongkorn University Graduate Scholarship to commemorate the 72nd anniversary of His Majesty King Bhumibol Adulyadej and the 90th Anniversary of Chulalongkorn University Fund.
References
- Agarwal C, Singh RP, Dhanalakshmi S, et al. (2003). Silibinin upregulates the expression of cyclin-dependent kinase inhibitors and causes cell cycle arrest and apoptosis in human colon carcinoma HT-29 cells. Oncogene 22:8271–82
- Ahmad A, Wang Z, Ali R, . (2012). Cell cycle regulatory proteins in breast cancer: Molecular determinants of drug resistance and targets for anticancer therapies. In: Rebecca A, ed. Targeting New Pathways and Cell Death in Breast Cancer. InTech, 113–30. Available from: http://cdn.intechopen.com/pdfs-wm/29441.pdf [last accessed 13 Oct 2014]
- Antonsson B, Martinou J. (2000). The Bcl-2 protein family. Exp Cell Res 256:50–7
- Bresalier RS, Sandler RS, Quan H, et al. (2005). Cardiovascular events associated with rofecoxib in a colorectal adenoma chemoprevention trial. N Engl J Med 352:1092–102
- Chansriniyom C, Ruangrungsi N, Lipipun V, et al. (2009). Isolation of acridone alkaloids and N-[(4-monoterpenyloxy)phenylethyl]-substituted sulfur-containing propanamide derivatives from Glycosmis parva and their anti-herpes simplex virus activity. Chem Pharm Bull (Tokyo) 57:1246–50
- De Gramont A, Figer A, Seymour M, et al. (2000). Leucovorin and fluorouracil with or without oxaliplatin as first-line treatment in advanced colorectal cancer. J Clin Oncol 18:2938–47
- Debatin KM. (2004). Apoptosis pathways in cancer and cancer therapy. Cancer Immunol Immun 53:153–9
- Fisher DE. (1994). Apoptosis in cancer therapy: Crossing the threshold. Cell 78:539–42
- Greger H, Zechner G, Hofer O, et al. (1993). Sulphur-containing amides from Glycosmis species with different antifungal activity. Phytochemistry 34:175–9
- Hanahan D, Weinberg RA. (2011). Hallmarks of cancer: The next generation. Cell 144:646–74
- Jemal A, Bray F, Center MM, et al. (2011). Global cancer statistics. CA Cancer J Clin 61:69–90
- Koehne CH, Dubois RN. (2004). COX-2 inhibition and colorectal cancer. Semin Oncol 31:12–21
- Lievre A, Bachet JB, Le Corre D, et al. (2006). KRAS mutation status is predictive of response to cetuximab therapy in colorectal cancer. Cancer Res 66:3992–5
- Mans DR, Da Rocha AB, Schwartsmann G. (2000). Anti-cancer drug discovery and development in Brazil: Targeted plant collection as a rational strategy to acquire candidate anti-cancer compounds. Oncologist 5:185–98
- Markowitz SD, Bertagnolli MM. (2009). Molecular basis of colorectal cancer. N Engl J Med 361:2449–60
- Park MT, Lee SJ. (2003). Cell cycle and cancer. J Biochem Mol Biol 36:60–5
- Rethy B, Zupko I, Minorics R, et al. (2007). Investigation of cytotoxic activity on human cancer cell lines of arborinine and furanoacridones isolated from Ruta graveolens. Planta Med 73:41–8
- Siripong P, Hahnvajanawong C, Yahuafai J, et al. (2009). Induction of apoptosis by rhinacanthone isolated from Rhinacanthus nasutus roots in human cervical carcinoma cells. Biol Pharm Bull 32:1251–60
- Siripong P, Yahuafai J, Shimizu K, et al. (2006). Antitumor activity of liposomal naphthoquinone esters isolated from Thai medicinal plant: Rhinacanthus nasutus KURZ. Biol Pharm Bull 29:2279–83
- Tol J, Koopman M, Cats A, et al. (2009). Chemotherapy, bevacizumab, and cetuximab in metastatic colorectal cancer. N Engl J Med 360:563–72
- Wang D, Dubois RN. (2010). The role of COX-2 in intestinal inflammation and colorectal cancer. Oncogene 29:781–8