
Abstract
Context: Oxidative stress is an important factor modulating skin alterations. Melochia arenosa Benth. (Malvaceae) is a Brazilian plant with antimicrobial activity and antioxidant potential.
Objective: The objective of this study is to develop a topical formulation containing antioxidant phenolic-rich extract of M. arenosa and to evaluate its skin permeation profile.
Materials and methods: Response surface methodology was used to maximize the total phenolic (TP) content of the extract and its antioxidant activity was evaluated by 2,2-diphenyl-1-picryl-hydrazyl (DPPH), 2,2′-azinobis (3-ethylbenzothiazoline-6-sulfonic acid) (ABTS), and respiratory burst methods. An emulsion containing 1% optimized extract (OE) was developed and employed photoacoustic spectroscopy (PAS) for the determination of its skin permeation profile. The morphology of the skin was studied in histological sections stained with hematoxylin–eosin.
Results and discussion: The optimum conditions predicted for the major extractive efficiency of the phenolics with 100% ethanol led extraction time 101 h and plant:solvent proportion 1:13.5 (w/v). OE presented TP = 724.6 ± 8.2 mg GAE/g extract and scavenging capacity of DPPH (IC50 value = 11.43 ± 0.14 µg/mL) and ABTS radicals (IC50 value = 35.42 ± 0.48 µg/mL). The production of ROS by neutrophils after stimulation with phorbol miristate acetate was lower when the OE was present in the reaction medium, endorsing its high antioxidant capacity. The data obtained by PAS indicated that the OE present in the emulsion has permeated and was distributed in the whole skin. No histopathological alterations were observed in the histological analysis.
Conclusion: The formulation developed is a promising tool for skin care and could prevent the damage caused by oxidative stress.
Introduction
The skin, by performing important functions, such as protection, is fundamental to the maintenance of homeostasis of the organism. However, constant exposure to the external environment submits it to various aggressive agents, among them, we can highlight the ultraviolet radiation, a major contributor to the formation of excessive reactive oxygen species (ROS). The excess of ROS in the physiological system causes an imbalance between oxidants and antioxidants and may generate oxidative stress (Letelier et al., Citation2008). Natural antioxidants of the skin promote intra- and extracellular protection, but in a situation of overload of ROS, the defense systems weaken, leaving skin more exposed to damages. Oxidative stress is an important factor modulating skin alterations, related to premature skin aging and cancer (Masaki, Citation2010; Pinnell, Citation2003; Valko et al., Citation2006). Topical treatment with certain antioxidants, such as phenolic compounds, should be effective to improve resistance to oxidative stress and prevent or reduce skin photodamage.
Polyphenols are a large group of molecules produced in plants that have become a focus of increased research interest due to the different biological properties that they present, including antioxidant, antimicrobial, anticarcinogenic, and anti-inflammatory properties (Loganayaki et al., Citation2010; Scotti et al., Citation2007). These natural antioxidants can be used as alternatives to synthetic ones (Xi, Citation2009), and the search for natural sources containing these compounds presenting antioxidant activity increased significantly in recent years, especially of the ones of plant origin.
Researchers in our group are dedicated to the search for new natural bioactive agents obtained especially of native plants. In those studies, the extract of Melochia arenosa Benth. (Malvaceae) presented antimicrobial activity (Truiti et al., Citation2005, Citation2006) and the preliminary phytochemical investigation carried out by standard methods indicated the presence of phenolic compounds. These compounds also have been found in species of the genus, such as M. corchorifolia L., M. chamaedrys A. St.-Hil., and M. umbellata (Houtt.) Stapf (Dias et al., Citation2007; Gunasegaran et al., Citation1980; Tripathi et al., Citation2010).
Topical application of antioxidants is advantageous because they act directly where the effect is required. However, for appropriate skin protection, it is necessary that they exhibit permeation capacity, since the skin serves as a penetration barrier (Masaki, Citation2010; Pinnell, Citation2003; Röpke et al., Citation2002).
Using the above-mentioned methods, in the present study, the antioxidant capacity of the phenolic-rich extract of the aerial parts of M. arenosa was evaluated. The factorial design approaches were applied to maximize its total phenolic content. Then, a formulation containing the optimized extract was developed and its cutaneous permeation profile was evaluated by photoacoustic spectroscopy (PAS).
Materials and methods
All reagents and solvents used were of analytical grade: 2,2-diphenyl-1-picryl-hydrazyl (DPPH), 3,5-di-tert-4-butylhydroxytoluene (BHT), gallic acid, histopaque, phorbol myristate acetate (PMA), 2,2′-azinobis (3-ethylbenzothiazoline-6-sulfonic acid) (ABTS), histopaque, phorbol myristate acetate (PMA), and glucose (Sigma-Aldrich, St. Louis, MO), Folin–Ciocalteau (Dinâmica, Vinhedo, Brazil), luminol (Acros, Mount Carmel, PA), human albumin (CSL Behring, King of Prussia, PA). Raw materials for formulations were commercially available.
Plant material
The aerial parts were collected from the municipal district of Taquaraçu (MS, Brazil) in November 2010. The identification was carried out by Kazue Kawakita (Nupelia, Universidade Estadual de Maringá, PR, Brazil). Voucher specimen was added to the collection of the herbarium of Universidade Estadual de Maringá (HUEM – no. 14888). The plant material was dried by airflow at 40 °C and powdered in a cutting mill. The water and total ash contents and fineness of powder of the dried plant material were then determined (Agência Nacional de Vigilância Sanitária, Citation2010).
Extraction
The extracts were prepared by maceration at room temperature, then concentrated under reduced pressure and lyophilized.
Experimental design
Response surface methodology was employed to maximize the extraction of the total phenolic content (TP) from the aerial parts of M. arenosa (Rodrigues & Iemma, Citation2009). For this purpose, two sequential matrices were used. Initially a 23 factorial design was carried out on two levels (+1 and −1) with two center points, in duplicate, leading to 20 runs. The variables were extraction time (T) (+1 = 72 h; 0 = 48 h; −1 = 24 h), ethanol content (E) (+1 = 100%; 0 = 75%; −1 = 50%), and plant:solvent proportion (w/v) (P) (+1 = 1:20; 0 = 1:15; −1 = 1:10). After statistical analysis of the data obtained in the first experimental design, E was fixed at 100% and, based on a 22 factorial design, a central composite design (the second experimental matrix) was developed, consisting of four factorial points and one center point, and four axial points and one center point, in duplicate, leading to 20 runs. The independent variable were T (+1.414 = 118 h; +1 = 108 h; 0 = 84 h; −1 = 60 h; −1.414 = 50 h) and P (+1.414 = 1:45; +1 = 1:39; 0 = 1:24; −1 = 1:09; −1.414 = 1:03). The experiments were performed in random order. The data were analyzed using the Statistica 8.0 (StafSoft, Inc., Tulsa, OK) software. Statistical evaluation of data was performed using one-way analysis of variance (ANOVA).
Determination of total phenolic content
Previously, the presence of phenolic compounds was characterized by qualitative assays using phenols reagents, such as ferric chloride (Costa, Citation2001; Moreira, Citation1979). TP was determined by a modified Folin–Ciocalteau photometric method (Singleton & Rossi, Citation1965). The lyophilized extract (20 mg) was dissolved in 5.0 mL of methanol. This sample solution (200 μL) was transferred to 10 mL volumetric flask, the Folin–Ciocalteu reagent (500 μL) and 15% Na2CO3 (2 mL) were added and the volume was completed with water. The absorbance was measured after 2 h at 760 nm. Aqueous solution with methanol and all reagents except the extract was used as a blank. TP was determined by interpolating the absorbance of the sample against a calibration curve constructed with gallic acid and expressed as milligrams of gallic acid equivalents per gram of extract (mg GAE/g extract). Assays were performed in duplicate for experimental design and in triplicate for analysis of optimized extract (OE).
DPPH assay
Antioxidant activity (AA) of OE was determined by the modified DPPH method (Brand-Williams et al., Citation1995). One milliliter of the methanol solution of the lyophilized extract at different concentrations was mixed with 2.0 mL of a DPPH methanol solution (0.06 mg/mL). The absorbance was measured at 516 nm after 30 min of reaction, protected from light. Methanol was used as a blank, the solution of DPPH (2.0 mL) in methanol (1.0 mL) was used as a negative control and BHT was used as reference antioxidant. The percentage of DPPH inhibition was calculated by the equation:
where A0 is the absorbance value of negative control and A1 is the absorbance value of DPPH in the presence of the extract. IC50 values, the concentration required to inhibit 50% of the free radical, were estimated by linear regression. Assays were performed in triplicate.
ABTS assay
AA of OE was determined by the modified ABTS method (Sánchez-González et al., Citation2005). The ABTS+• cation was produced by reaction of the ABTS solution (7 mM) with potassium persulfate (2.45 mM). The ion ABTS+• solution was diluted with the phosphate buffer (pH 7.4) and read for absorbance (0.7–730 nm). The OE was dissolved in DMSO and this sample solution (10 μL) was added to 4 mL of solution of ABTS+• (10–40 µg/mL). The absorbance was measured after 6 min at 730 nm. The antioxidant capacity was calculated by the percentage of inhibition of the radical ABTS (IA%), according to the equation:
where A1 is the absorbance value of ABTS+• in the presence of the extract and A0 is the absorbance value of the control solution in absence of the extract. Assays were performed in triplicate.
Measurement of oxidative burst in human neutrophils
The study was based on monitoring the oxidation of luminol by ROS produced by neutrophils after stimulation with PMA (Freitas et al., Citation2008). Chemioluminescence was monitored in a microplate reader (Victor X3, PerkinElmer®, Waltham, MA), in a response range between 300 and 620 nm. For samples of OE, the concentrations tested were 20 and 30 µg/mL. Briefly, in each well, 200 μL of neutrophils (2.5 × 10⁶ cls/mL), 50 μL of luminol (20 mM), 50 μL of PMA (5 μM), and 10 μL of samples were added. After homogenization, the solution was subjected to reading, with a counting time of 60 min and a temperature of 30 °C (± 1.0 °C). Each experiment was accompanied by a control assay without extract. Results were shown according to the values of the peaks from the kinetic curves and presented in the form of quartiles (1st and 3rd). Tests were performed in 14 repetitions. Quantification was done in CPM (counts per min). The data were analyzed by the ANOVA test and complemented by the Tukey test.
Formulations
A non-ionic o/w emulsion (base formulation – BF) was developed with the following composition: water, propylene glycol, ceteareth-20, glyceryl stearate, cetyl alcohol, mineral oil, petrolatum, cetyl palmitate, caprylic/capric trygliceride, hydroxyethylcellulose, imidazolidinyl urea, nipagin, and nipazol. The emulsion was produced by conventional technique. The formulation containing the optimized extract (EF) was produced by the incorporation of OE (1%, w/w) previously dissolved in propylene glycol in the BF, at room temperature.
Animals
Adult male Wistar rats weighing 180–200 g were used. The animals were maintained at 20 °C in a 12 h light/dark cycle, with water and food (Nuvital®, Nuvital Research Lab Pvt. Ltd., Delhi, India) ad libitum. They were divided into three groups, according to the treatment: control group without treatment (G1, n = 2); with topical application of BF (G2, n = 3); with topical application of EF (G3, n = 3) – the amount applied was 2 mg/cm2. The animals were anesthetized with ketamine (100 mg/kg body weight) and xylazine (100 mg/kg body weight) injected intraperitoneally for performing manual depilation and asepsis, carried out in the region near the cervical area. Three days later, the sample was topically applied on clean skin surface. About 40 min after the application, the animals were killed and their skin was removed for histological and permeation analysis by PAS. The measurements were performed 20 min after the death of the animals, with dissected skin with a mean thickness of 770 µm. This study was approved by the Ethics Committee on Animal Use in Experimentation, Universidade Estadual de Maringá (n° 100/2012).
Photoacoustic spectroscopy measurements
The measurements were performed using a monochromatic light obtained from a 1000 W Xenon arc lamp with a stable power supply (Oriel Corporation, Stratford, CT, 68820), monochromator (Oriel Instruments, model 77250). The light beam was modulated with a mechanical chopper (Stanford Research Systems, Sunnyvale, CA, SR540). The photoacoustic cell was home made from aluminum block, machined to hold samples with maximum dimensions of about 5 mm in diameter and 1 mm thick, which allows light to enter through a high transparent quartz window of 6 mm in diameter and 2 mm thick. The microphone chamber was 15 mm far away and connected to the sample holder chamber by means of a 1 mm diameter duct. The capacitive microphone used had a 12 mm diameter (Bruel & Kjaer, Norcross, GA, model 2639). The lock-in amplifier was from EG & G Instruments, North Branford, CI, model 5110. All the photoacoustic spectra were obtained at a modulation frequency of 25 Hz and recorded between 200 and 800 nm. Data acquisition was performed by a personal computer and the PAS spectra were normalized with respect to the carbon black signal as a function of the incident radiation wavelengths.
Histological evaluation
Skin samples of the animals with an area on the order of 2 cm2 were removed, fixed in 4% paraformaldehyde, and processed for paraffin inclusion. The blocks were cut in semi-serial sections of 5 μm thickness and then stained with hematoxylin and eosin (H & E). The histological analysis was performed in optical microscope (Nikon, Tokyo, Japan, Eclipse 80i) to determine the occurrence of histopathological alterations in the skin after topical application of formulations.
Results
Experimental designs were used to investigate the influence of ethanol content (E), extraction time (T), and plant:solvent proportion (P) in the extraction by maceration of phenolic compounds from the aerial parts of M. arenosa. The plant material (dried and powdered aerial parts) used to obtain extracts presented 250 µm, 10.78% water ± 0.15 and 6.18 ± 0.05% total ash. Initially, a 23 factorial design was used. The complete matrix of the experiments carried out and the results obtained are shown in .
Table 1. Total phenolic content (TP, mg GAE/g ext.) of the extracts of the aerial parts of Melochia arenosa obtained for the 23 factorial and central composite designs.
Adjusted model for TP (mg GAE/g extract) of extracts produced according a 23 factorial design is shown as the following equation:
(1)
where E, T, and P are the coded values of the process variables extraction time (X1), ethanol content (X2), and plant:solvent proportion (X3), respectively. The positive sign indicates the synergistic effect, whereas the negative sign shows the antagonistic effect.
In the adjusted model (R2 = 0.975) the significant effects were T ( + 55.77), E (+ 43.04), and the interactions between T and P (+37.81), T and E (−19.54), P, and E (−34.92) and between T, E, and P (−18.53). These results indicate a positive contribution increasing extractive efficiency of the phenolic compounds when T and E are increased, but was not possible to increase E because it was tested at the highest concentration (100%). Thus, the E was fixed in 100% and was designed the second experimental matrix, a factorial 22. The results obtained are shown in .
Adjusted model for TP (R2 = 0.998) of extracts produced according to a 22 factorial design is shown as the following equation:
(2)
According to the adjusted model, the dependent variable may improve with decreasing P and increasing T. In statistical analysis the curvature effect was significant, and thus a central composite design was developed. The rotation axis led to the establishment of axial points (−1.414 and +1.414). The results obtained are shown in . Adjusted model produced is shown as the following equation:
(3)
ANOVA was performed to the model generated by central composite and the results are presented in . In the adjusted model for total phenolic content (R2 = 0.781), the significant effects were found for T quadratic, P linear, and P quadratic. The predicted TP (Y) in the central composite design was higher than that predicted in the 23 factorial designs. The response surface graph from the central composite for total phenolic content is shown in .
Figure 1. Response surface plot showing the effects of plant:solvent proportion and extraction time on the total phenolic content of the ethanol extract of the aerial parts of Melochia arenosa.
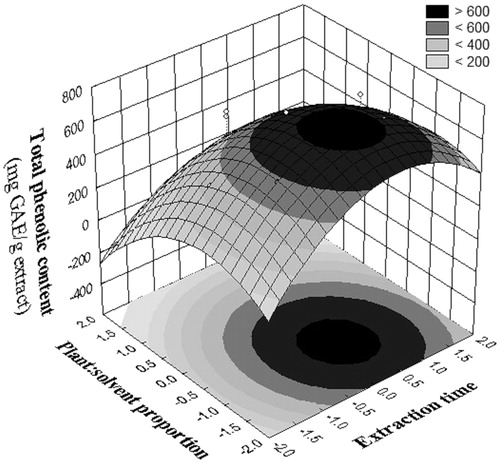
Table 2. ANOVA results to the model generated by central composite for total phenolic content and for antioxidant activity.
The optimum conditions predicted for the extractive efficiency of TP with 100% ethanol led to T 101 h (coded +0.707) and P 1:13.5 (coded −0.707). These conditions were adopted for the production of OE. The OE presented TP = 724.6 ± 8.2 mg EAG/g extract.In the evaluation of AA by DPPH and ABTS assays, the OE presented IC50 value = 11.43 ± 0.14 µg/mL and IC50 value = 35.42 ± 0.48 µg/mL, respectively.
The respiratory burst methodology used is based on monitoring the oxidation of luminol by ROS produced by human neutrophils after stimulation with PMA. The intensity of chemiluminescence (photon flux) is directly proportional to the rate of ROS production. For neutrophils control, the average was 37 405.3 ± 3168.6 CPM, for the OE concentration of 20 μg/mL was 23 548.0 ± 1733.9 CPM and 30 μg/mL was 20 431.4 ± 3,221.6 CPM.
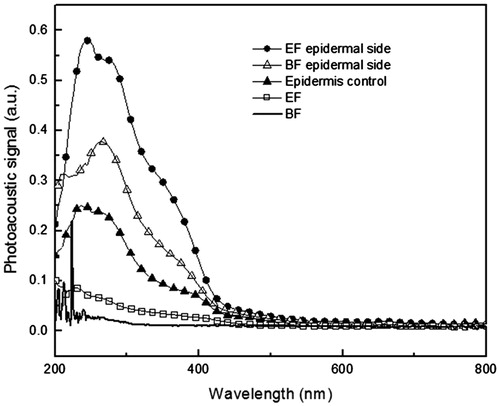
A non-ionic o/w emulsion containing 1% OE was developed and its skin permeation profile was evaluated by PAS. Initially, the optical absorption spectra of the base formulation without extract (BF), of the formulation containing 1% OE (EF) and of the OE, were obtained by PAS in order to check their absorption profile for further evaluation of the emulsions after the application on the skin. In the obtained spectra, OE revealed intense absorption from 200 to 663 nm – with Gaussian curves centered at 314, 374, 439, 450, and 543 nm; BF shows no absorption above 300 nm; and EF presents absorption from 200 to 550 nm. This way, the region 310–550 nm was selected for the evaluation of permeation EF, in which BF does not absorb.
The next step was evaluating the skin samples with the topically applied formulations. The samples were excited first onto the epidermal side, on which the formulations were applied, and then on the dermal side. shows the results for epidermal side excitation in the control skin samples without treatment (G1) and skin samples where BF (G2) and EF (G3) were applied. The control skin sample with epidermal side excitation showed an optical absorption in the region from 200 to 400 nm, with greater intensity in the region 200–300 nm. The skin sample where BF was applied shows increased absorption in the region 200–310 nm and the skin sample where EF was applied shows increased absorption from 200 to 440 nm compared with untreated ones.
Figure 2. Photoacoustic spectra obtained with excitation performed in the epidermal side of the skin samples. The light modulation frequency was 25 Hz and the thermal diffusion length was 23 μm. Epidermis control – control skin sample without treatment; EF – formulation containing 1% optimized extract of the aerial parts of Melochia arenosa; BF epidermal side – skin sample treated with BF; EF epidermal side – skin samples treated with EF (amount applied 2 mg/cm2).
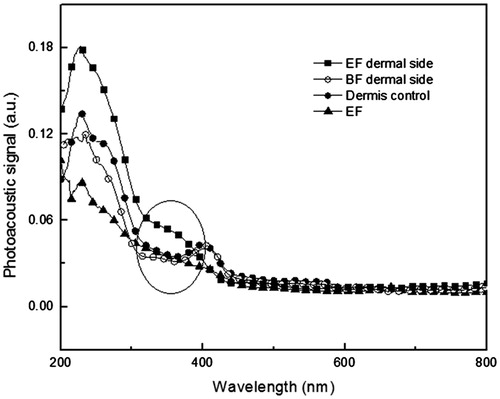
shows the results for dermal side excitation of G1, G2, and G3 skin samples. The control skin sample with dermal side excitation showed optical absorption in the region of 200–300 nm. The broad absorption band centered at about 410 nm can be associated with the presence of blood in the dermal region (Truite et al., Citation2007). Increased absorption was not observed for the skin treated with BF in any region of the spectrum and the skin sample where EF was applied shows increased absorption in the region 310–400 nm when compared with the dermis control.
Figure 3. Photoacoustic spectra obtained with excitation performed in the dermal side of the skin samples. The light modulation frequency was 25 Hz and the thermal diffusion length was 23 μm. Dermis control − control skin sample without treatment; EF – formulation containing 1% optimized extract of aerial parts of Melochia arenosa; BF dermal side – skin sample treated with base formulation; EF dermal side – skin samples treated with EF (amount applied 2 mg/cm2). The highlight shows the presence of EF in the face dermal.
In the macroscopic evaluation of the treated and control animals, no alterations were observed in the skin. In the histological analysis, all skin samples showed the same microscopic appearance and no inflammatory reaction or other adverse effects were observed in the skin of control animals or of those treated with BF or with EF.
Discussion
One aspect considered by many researchers is the biological and physico-chemical standardization as a prerequisite for the constancy of the therapeutic effects and safety of the user, since the use of vegetables in natura is gradually giving way to its derivatives. However, a major difficulty in the search for plant extracts is precisely the standardization of obtaining it. Both the extraction rate and the quality of the extracted bioactive, and therefore the bioactivity of the extract can be influenced by different factors, such as chemical nature of the substances, the extraction method used, extraction time, temperature, particle size, concentrations of solvents, and plant:solvent ratio (Liyana-Pathirana & Shahidi, Citation2005; Naczk & Shahidi, Citation2004).
The factorial design is a proposed experimental design that enables rapid results, with low number of tests and has been employed for the optimization of extraction conditions due to the reduction of time and cost in obtaining a more suitable product. Thus, experimental designs were used and the OE was obtained in the optimum conditions predicted for the extraction of TP (100% ethanol, 101 h, and proportion plant:solvent 1:13.5), presenting TP = 724.6 ± 8.2 mg EAG/g extract. This real result is in accordance with the one predicted in the central composite design, showing that experimental designs are a useful tool to improve the extraction efficiency of these compounds.
Many phenolic compounds have antioxidant activity and are used for this purpose – for example BHT, one of the most widely synthetic antioxidants. Currently research is very focused on the search for natural sources of antioxidants. In the evaluation of AA by DPPH assay, the OE presented IC50 value = 11.43 ± 0.14 µg/mL. The OE had better DPPH radical scavenging capacity than BHT (p < 0.05), which showed IC50 value of 12.44 ± 0.47 µg/mL. The OE also showed good scavenging capacity of ABTS radical.
The DPPH and ABTS assays evaluate the antioxidant activity for its particular reaction system. It is important to investigate whether the extract is able to retain its antioxidant capacity in a biologically complex medium, such as cellular environment. Thus, in order to better assess their antioxidant capacity, this extract was evaluated by the respiratory burst method. The results show that the production of ROS by neutrophils after stimulation with PMA was significantly lower (p < 0.01) when the OE was present in the reaction medium than in the absence of it (neutrophils control).
Whereas that the OE of the leaves of M. arenosa present high antioxidant capacity which developed an emulsion containing 1% OE for topical application in order to protect the skin from damage caused by ROS.
ROS are highly reactive, short-lived, and they react at the place where they are created (Masaki, Citation2010), what makes the topical antioxidants an effective tool to control their production. ROS cause oxidative damages to lipids, and proteins, affecting the cellular components such as cell membranes, mitochondria, and DNA. There are many potential targets for oxidative damage to the skin such as epidermal keratinocytes and dermal fibroblasts (Pinnell, Citation2003). Thus, to protect all skin layers including the deeper layers, antioxidants should be formulated in a way that they are delivered in the whole skin.
The structural complexity of the skin and the lack of appropriate techniques to evaluate the penetration depth profile of a formulation, especially those containing components with multiple constituents, such as plant extracts, are among the causes of few studies in this area. PAS has proved to be a valuable tool to measure the distribution and the permeation of natural products through skin in vitro, ex vivo, and in vivo (Melo et al., Citation2011; Sehn et al., Citation2009; Truite et al., Citation2007).
In this context, the skin permeation profile of the emulsion containing OE was evaluated by PAS. For the evaluation of the permeation profile of the formulations, BF and EF were applied topically in order to yield 2 mg/cm2. The amount applied of 2 mg/cm2 is used in the in vivo studies of some topical products, e.g., sunscreens (Schalka & Reis, Citation2011). Considering the used light modulation frequency at 25 Hz and the thermal diffusivity of the skin at 4 × 10⁻⁴ cm2/s (Baesso et al., Citation1994), the thermal diffusion length can be estimated at approximately 23 μm. The skin samples had a mean thickness of 770 μm, much higher than the penetration capacity of the signal generated. Therefore, the increase of the optical absorption bands detected at the dermal side of the skin samples means that constituents of the formulations propagated throughout the skin and are present in the dermis.
The results () show that BF was present in the epidermis, fact evidenced by increased absorption in the region 200–310 nm when the spectra of the samples untreated (epidermis control) and treated are compared. The presence of EF in the epidermis was evidenced by the intense increase of the optical absorption observed for the treated skins compared with untreated ones in the regions between 200 and 440 nm, especially from 310 at 440 nm, which comprises a region which OE absorbs and BF do not.
The results obtained by PAS () show that BF was not present in the dermis. On the other hand, the presence of EF was verified on the face dermal, due to the intense increase of the optical absorption observed for the treated skins in the regions between 310 and 400 nm.
These data indicate that OE has permeated through the different layers, was distributed in the whole skin, and it was present in the epidermis and dermis. This way, considering the great antioxidant potential of OE, the formulation developed can protect the different components of the skin from the harmful effects of ROS.
Conclusion
The results showed that the statistical experimental designs used were important to determine the better extraction conditions for obtaining the extract with high phenolic content. Furthermore, PAS has been shown to be an efficient approach to evaluate the skin permeation profile of the formulations, including those containing plant extracts, which present various constituents. The extract optimized by the aerial parts of M. arenosa showed great antioxidant capacity and ability to permeate the superficial and deep layers, when analyzed by PAS, being distributed throughout the skin without causing morphophysiologic alterations in the conditions used, indicating that the formulation developed is a promising tool for skin care and could prevent the damage caused by oxidative stress, such as aging skin. However, the product is not yet approved for human use, and additional safety studies will be carried.
Declaration of interest
The authors report that they have no conflicts of interest. This work has been supported in part by Coordenação de Aperfeiçoamento de Pessoal de Nível Superior (CAPES) and Programa de Pós-graduação em Ciências Farmacêuticas of Universidade Estadual de Maringá.
References
- Agência Nacional de Vigilância Sanitária. (2010). Farmacopéia Brasileira, 5th ed. Vol. 1. Brasília, Brazil: Agência Nacional de Vigilância Sanitária
- Baesso ML, Shen J, Snook RD. (1994). Laser-induced photoacoustic signal phase study of stratum-corneum and epidermis. Analyst 119:561–2
- Brand-Williams W, Cuvelier ME, Berset C. (1995). Use of free radical method to evaluate antioxidant activity. Lebensm-Wiss Technol 28:25–30
- Costa AF. (2001). Farmacognosia. Lisboa, Portugal: Calouste Gulbenkian
- Dias GCD, Gressler V, Hoenzel SCSM, et al. (2007). Constituents of the roots of Melochia chamaedrys. Phytochemistry 68:668–72
- Freitas M, Porto G, Lima JLFC, et al. (2008). Isolation and activation of human neutrophils in vitro: The importance of the anticoagulant used during blood collection. Clin Biochem 41:570–5
- Gunasegaran R, Kotiyal JP, Rani FV. (1980). Kaempferol-3-O-galactoside from leaves of Melochia umbellata & Eriolaena hookeriana. Indian J Chem 19B:821
- Letelier ME, Molina-Berrios A, Cortés-Troncoso J, et al. (2008). DPPH and oxygen free radicals as pro-oxidant of biomolecules. Toxicol In Vitro 22:279–86
- Liyana-Pathirana C, Shahidi F. (2005). Optimization of extraction of phenolic compounds from wheat using response surface methodology. J Food Chem 93:47–56
- Loganayaki N, Rajendrakumaran D, Manian S. (2010). Antioxidant capacity and phenolic content of different solvent extracts from banana (Musa paradisiaca) and mustai (Rivea hypocrateriformis). Food Sci Biotechnol 19:1251–8
- Masaki H. (2010). Role of antioxidants in the skin: Anti-aging effects. J Dermatol Sci 58:85–90
- Melo JO, Pedrochi F, Baesso ML, et al. (2011). Evidence of deep percutaneous penetration associated with anti-inflammatory activity of topically applied Helicteres gardneriana extract: A photoacoustic spectroscopy study. Pharm Res 28:331–6
- Moreira EA. (1979). Marcha sistemática de análise em fitoquímica. Tribuna Farmacêutica 47:3–19
- Naczk M, Shahidi F. (2004). Extraction and analysis of phenolics in food. J Chromatogr A 1054:95–111
- Pinnell SR. (2003). Cutaneous photodamage, oxidative stress, and topical antioxidant protection. J Am Acad Dermatol 48:1–22
- Rodrigues MI, Iemma AF. (2009). Planejamento de Experimentos e Otimização de Processos. Campinas, Brazil: Cáxita Editora
- Röpke CD, Kaneko TM, Rodrigues RM, et al. (2002). Evaluation of percutaneous absorption of 4-nerolidylcathecol from four topical formulations. Int J Pharm 249:109–16
- Sánchez-González I, Jiménez-Escrig A, Saura-Calixto F. (2005). In vitro antioxidant activity of brewed using different procedures: Italian, espresso and filter. Food Chem 90:133–9
- Schalka S, Reis VMS. (2011). Sun protection factor: Meaning and controversies. An Bras Dermatol 86:507–15
- Scotti L, Scotti MT, Cardoso C, et al. (2007). Modelagem molecular aplicada ao desenvolvimento de moléculas com atividade antioxidante visando ao uso cosmético. Rev Bras Ciênc Farm 43:153–66
- Sehn E, Hernandes L, Franco SL. (2009). Dynamics of reepithelialisation and penetration rate of a bee própolis formulation during cutaneous wounds healing. Anal Chim Acta 635:115–20
- Singleton VL, Rossi JA. (1965). Colorimetry of total phenolics with phosphomolybdic-phosphotungstic acid reagents. Am J Enol Vitic 16:144–58
- Tripathi RC, Pandey MB, Singh S, et al. (2010). Antifungal flavonoids of Melochia corchorifolia. J Indian Chem Soc 87:511–12
- Truite CVR, Philippsen GS, Nakamura TU. (2007). Percutaneous penetration, melanin activation and toxicity evaluation of a phytotherapic formulation for vitiligo therapeutic. Photochem Photobiol 83:1529–36
- Truiti MCT, Ferreira ICP, Zamuner MLM, et al. (2005). Antiprotozoal and molluscicidal activities of five Brazilian plants. Braz J Med Biol Res 38:1873–8
- Truiti MCT, Bersani CA, Dias Filho BP, et al. (2006). Screening of five Brazilian plants for anti-inflammatory and antimicrobial activities. Pharm Biol 44:516–21
- Valko M, Rhodes CJ, Moncol J, et al. (2006). Free radicals, metals and antioxidants in oxidative stress-induced cancer. Chem–Biol Interact 160:1–40
- Xi J. (2009). Caffeine extraction from green tea leaves assisted by high pressure processing. J Food Eng 94:105–9