Abstract
Objectives. Better tools are needed for detection of future malignant ventricular arrhythmias post myocardial infarct (MI). Wedensky Modulation (WM) is a new semi-invasive method: A short low-amplitude electrical impulse is applied synchronized to the QRS between a precordial and dorsal thoracic patch, and changes in the following QRS-T are registered. Design. A total of 357 (MI) ICD patients underwent WM testing. QRS-T wavelet analysis provided WM Indexes for the QRS complex (WMI-R) and T wave (WMI-T). Outcome was the time to first occurrence of appropriate device therapy for ventricular arrhythmia. Patients were followed at 6-month intervals for 2 years. Results. No arrhythmia was induced by the testing. Two-year appropriate arrhythmia treatment occurred in 35% (WMI-R positive) versus 25% (WMI-R negative, p = 0.014), and. 45% versus 26% (p = 0.001) for WMI-T positive versus negative. Two-year event rates of WMI-R or WMI-T positive versus WMI-R and WMI-T negative were 36% versus 22% (p = 0.004). In Cox proportional hazard model, the combination of WMI-R and WMI-T was the only statistically significant event predictor (p = 0.003). Conclusion. Potentially life-threatening ventricular arrhythmic events could be predicted by the WM test. In combination with other risk factors WMI may be useful in these patients.
Introduction
Implantable cardioverter defibrillators (ICDs) reliably terminate ventricular arrhythmias (Citation1–4). Yet, current selection of patients most likely to benefit from ICD therapy is based largely on a reduced left ventricular ejection fraction (LVEF), which has low sensitivity and specificity (Citation5–7). In particular, impaired LVEF as the lone qualifier for ICD therapy in the well-treated post-myocardial population, results in low rates of appropriate ICD shocks (Citation7–8).
Given the limited predictive ability of LVEF, there exists a need for non-invasive tools that could identify vulnerable electrical substrate, triggers, and/or modulators that increase arrhythmic risk (Citation1,Citation8,Citation9). Several recent studies have mainly focused on ventricular repolarization abnormalities (Citation9,Citation10) and perturbations in cardiac autonomic modulations (Citation11,Citation13). However, since the era of signal-averaged electrocardiography (Citation14), little attention has been paid to abnormalities in ventricular depolarization.
Wedensky Modulation (WM) involves the measurement of electrocardiographic response to a brief external sub threshold electrical stimulus delivered during ventricular depolarization (Citation15). We have previously shown that WM may be useful in distinguishing individuals at higher versus lower arrhythmic risk (Citation16,Citation17). To verify this observation, a prospective multicenter study was designed and conducted to determine whether the differences in WM Indices could identify individuals at higher versus lower arrhythmic risk late after myocardial infarction (MI) who met current indication for ICD placement. The aim of the study was to examine whether such data provide incremental risk stratification beyond LVEF measures alone, and thus eventually, in combination with other risk markers, might assist in the clinical decision in individual patients whether or not to proceed with ICD therapy.
Material and methods
Multicenter study
The study was designed as a prospective, observational investigation testing the hypothesis that the rate of ventricular arrhythmic events in ICD patients with positive WMI is greater than that in patients with negative WMI. Patients who had survived myocardial infarct and received an ICD for standard indications were enrolled. Both patients with primary and secondary indication were included since it was the intent of the study to predict the future vulnerability of patients to ventricular arrhythmias. Exclusion criteria included age < 18 years, pregnancy, pacemaker-dependent rhythm and lack of informed consent. At all participating centers the study was approved by the relevant ethics body, and all participants gave written informed consent prior to enrollment. This study was registered at clinical trials.gov. (NCT 00562757).
An ICD was implanted in each study participant. Devices were programmed with a ventricular fibrillation therapy zone with a single burst of anti- tachycardia pacing prior to shock therapy or during charging, as relevant to the device model. More than a single burst of anti-tachycardia pacing was allowed therapy for ventricular tachycardia. Similar to multicenter studies, there were inherent minor variations in device programming. Patients had follow-up according to the protocol of each center, however, no less than approximately annually. At each follow-up visit, all stored device electrocardiograms were reviewed to determine the appropriateness of any therapy. ICD therapy (anti-tachycardia pacing or shock therapy) was defined as appropriate if a ventricular arrhythmia was present and inappropriate if therapy was delivered for a supraventricular arrhythmia or because of device malfunction. The primary endpoint of the study was time to first appropriate ICD therapy. Follow-up events were prospectively defined as appropriate ICD therapy or death if due to arrhythmia.
Per protocol, the WM test was performed at the time of enrollment for each patient. Each patient received an ICD implant within approximately 1-year prior to and a few weeks after enrollment (median 7 days). The evaluation of WMI-R and WMI-T was made automatically from the signals obtained and classified as positive and negative as described below. The cardiologists judging the ICD electrocardiograms were blinded with respect to the results of the WM test. Study participants had follow-up for at least 6 months and all follow-up events within 2 years of enrolment were considered.
Wedensky modulation test
Determinations of WM have previously been reported (Citation15,Citation16,Citation18,Citation19). In brief, the test utilizes a short 2 ms pulse of current, 5 mA, delivered between a precordial and a dorsal patch directing current through the ventricular myocardium. The pulse is synchronized with the R wave in the surface electrocardiogram (ECG), that is early depolarization. During WM testing, no instances of ventricular arrhythmia induced by the stimulation in the QRS complex has ever been observed. Our method is user friendly and lasts for approximately 20 min.
The modulation pulse is delivered to every other cardiac beat during a sequence of approximately 400 beats. Orthogonal surface ECG is collected simultaneously, and the ECG patterns of the modulated and unmodulated beats are aligned according to the real time detection of ventricular R waves, and subsequently signal averaged. The averages of the modulated and unmodulated complexes are processed by wavelet decomposition in order to detect the changes due to the external modulation pulse. The same recording session allows obtaining standard signal averaged ECG before the modulation of every other beat is started.
The wavelet decomposition leads to a 3-dimensional surface pattern (called the wavelet envelope) assigning spectral power to each time instant and frequency component within the averaged ECG (Citation16). The differences of the envelopes of modulated and non- modulated cardiac beats create the so-called wavelet residuum. Based on previously obtained data in high- and low-risk post-infarction patients, the quantification of the residuum was developed selecting several core characteristics. From these, a numerical Wedensky Modulation Index (WMI) was derived by a multifactorial regression analysis and quantified on a scale between 0 and 1, where 0 and 1 indicate lower and higher risk of subsequent arrhythmic events, respectively. Two such indices were prospectively defined, characterizing the wavelet residuum within the QRS complex (WMI-R index) and within the T wave (WMI-T index), respectively.
The scales of the WMI scores were designed prospectively such that WMI-R > 0.5 and WMI-T > 0.5 were defined as positive WMI-R and positive WMI-T. WMI-R ≤ 0.5 and WMI-T ≤ 0.5 were defined as negative. Patients who were either WMI-R positive or WMI-T positive were categorized as WMI-RT positive, the other patients as WMI-RT negative.
Statistics
The study was powered to detect a hazard ratio of ≥ 1.5 between the event incidences in patients with positive versus negative WMI. Although the study was not prospectively powered for such comparisons, post-hoc retrospective analyses were added to (a) compare these hazard ratios in patients receiving ICD for primary and secondary indications (see further), and (b) compare the predictive power of WMI-R and WMI-T combination with that of LVEF, QRS duration obtained from signal averaged ECG, and heart rate. The comparison of the predictive power involved the comparison of uni- and multivariate receiver operator characteristics (ROC) and evaluation of Cox proportional hazard model. The ROC curves were bootstrap evaluated with 1000 random data selections to obtain 95% of the areas under the ROC curves (Citation17). For the Cox proportional hazard model, the compared risk predictors were dichotomized at their median values in the total population. The combination of WMI-R and WMI-T was characterized by the maximum of both WMI-R and WMI-T indices (corresponding to the WMI-RT definition).
Descriptive statistics (percentages and means) were compared between the patient groups using chi-square and t-tests for categorical and continuous variables, respectively. Unadjusted event rate curves for all patient groups, including primary and secondary prevention, were compared using Kaplan–Meier estimation and the log-rank test. Weibull survival regression was used to estimate the hazard ratio and to obtain univariable and multivariable models for potential predictive variables. All tests were two-sided; p ≤ 0.05 was considered statistically significant. Stata: Data Analysis and Statistical Software v10 (StataCorp, College Station, TX) and Statistical v 6.1 (StatSoft, Tulsa, OK) were used for analysis.
Results
Study population
The study enrollment was terminated when 357 patients had completed 12-month follow-up. The mean follow-up was 18 ± 8 months. Descriptive demographics and clinical characteristics of the population are summarized in . Of the population, 97 patients received ICD implant because of a history of a life-threatening ventricular arrhythmia (secondary prevention indication), and 260 post myocardial infarct (MI) patients were deemed at increased risk of sudden cardiac arrest almost exclusively due to a reduced ejection fraction, and underwent prophylactic ICD placement (primary prevention indication).
Table I. Demographics and clinical characteristics.
During follow-up, 103 patients (29% of the total population) experienced at least one ventricular arrhythmic event. Of these, 24 (23%) were ventricular fibrillation and 73 (68%) were ventricular tachycardias (70 monomorphic, 3 polymorphic). The heart rate during ventricular tachyarrhythmic events was available in 63 of 70 patients (90%) who presented with monomorphic ventricular tachycardia (mean 252 beats per min, median 220). Only three patients presented with polymorphic ventricular tachycardia (mean 175 beats per min, median 180). In 6 patients who died suddenly, the precise mechanism of death could not be determined by review of device interrogation or other means. However, in each case it was determined by the patient's treating physician that the cause of death was likely a ventricular arrhythmic event. In total, 36 patients (10%) experienced more than one ventricular arrhythmia event.
Twenty-Four patients (6.7%) died during follow-up. Of these deaths, 6 (1.7%) were judged arrhythmia related and included in the outcome events. Of the remaining 18 patients who died, 5 (1.4%) had previously experienced a ventricular arrhythmia event.
Wedensky modulation test results
Of the 357 patients, 182 (51%) were WMI-R positive and 80 (22%) were WMI-T positive. In total, 216 (61%) patients were WMI-RT positive (either WMI-R or WMI-T positive). There were 46 (13%) patients who were both WMI-R and WMI-T positive. There were differences in QRS duration between the WMI positive and negative groups which were statistically significant, but modest from a clinical standpoint ().
Table II. Differences between the WMI positive and negative groups.
Association of Wedensky modulation index with outcome
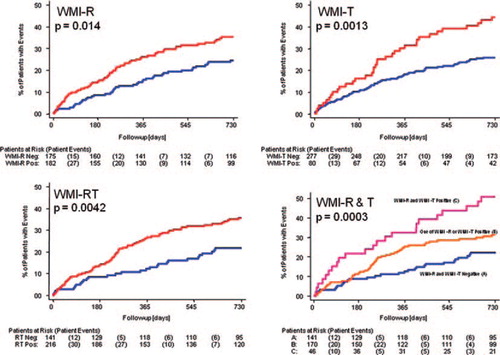
Patients who were WMI-R positive had a higher likelihood of a ventricular arrhythmic event when compared with patients who were WMI-R negative (35% event rate versus a 25% event rate; p = 0.014; 64% sensitivity and 49% specificity at 2 years; ). Patients who were WMI-T positive also had a higher likelihood of a ventricular arrhythmia event rate when compared with patients who were WMI-T negative (45% versus 26% event rate; p = 0.001; 35% sensitivity and 82% specificity at 2 years; ). Pooling the R wave and T wave results, patients who were WMI-RT positive had a higher likelihood of a ventricular arrhythmia event rate when compared with patients who were WMI-RT negative (36% versus 22% event rate; p = 0.004; 76% sensitivity and 41% specificity at 2 years; ). The WMI-RT positive patients included a small group with both WMI-R positive and WMI-T positive and a substantial event rate of 51%, whilst patients who had either WMI-R positive or WMI-T positive but not both showed event rate of 32% ().
Figure 1. Kaplan–Meier survival curves showing event incidence in patients who were WMI positive (red curves) compared with WMI negative patients (blue curves). Numbers of patients at risk and patient events are shown below each panel. In each panel, the log-rank p value is shown. Top left panel—comparison of WMI-R positive versus negative; Top right panel—comparison of WMI-T positive versus negative; Bottom left panel—comparison of WMI-RT positive versus negative; Bottom right panel—comparison of both WMI-R and WMI-T positive versus one (but not both) of the WMI-R and WMI-T positive versus both WMI-R and WMI-T negative.
The Weibull model showed that the WMI-RT score (defined as the maximum of the WMI-R and WMI-T scores) was predictive of time-to-event (p = 0.003), with increasing score predicting increasing risk and shorter times to event.
The utility of the three indices (WMI-R, WMI-T, WMI-RT) to predict events in primary and secondary patients was assessed by a Mantel–Haenszel test that compared the relative risk of WMI positive with that of WMI negative in primary versus secondary patients. In no case was the test significant, suggesting no evidence that the relative risks identified by WMI testing differ in primary and secondary patients. summarizes the log-rank tests for the indices (WMI-R, WMI-T, WMI-RT) in each stratum (primary and secondary) separately with the Mantel–Haenszel test for a difference and no significant difference in relative risk was found between primary and secondary indications.
Table III. Predictive capabilities in Primary/Secondary subpopulations of Weibull model.
Association of WMI with other risk predictors
Multivariate Weibull models were used to adjust for several clinical variables including age, sex, LVEF, QRS duration (measured on standard clinical ECG) to determine which variables were independently prognostic. The variables that remained in the model were WMI-R (p = 0.023) and WMI-T (p = 0.002), confirming that these variables are independent predictors of ventricular arrhythmic events in this population. Multivariate Weibull failure-time regression analysis showed that WMI-R and WMI-T provide complementary information about the time-to-event; both are significant at α = 0.05. WMI-RT is also significant at α = 0.05. See for WMI-R, WMI-T, and WMI-RT.
When dichotomizing the maximum of WMI-R and WMI-T indices, LVEF, filtered QRS duration (from signal-averaged ECG) and heart rate at their median values (0.55, 30%, 144 ms, and 66 beats per min, respectively) and entering the dichotomized variables into Cox proportional hazard model, only the maximum of WMI-R and WMI-T indices was found to be a statistically significant predictor of outcome events (p = 0.0031).
Adequate QRS-time measurements was unfortunately not done in half of the patients.
Discussion
In this multicenter, prospective myocardial study we observed that WMI is an independent predictor of ventricular arrhythmic events that may lead to sudden cardiac death. Specifically, WMI-R, and in particular the combination of WMI-R and WMI-T, helped to discriminate patients with a higher versus lower likelihood of future ventricular arrhythmic occurrence. A further observation was immediate separation and continued divergence of the Kaplan–Meier event curves during follow-up, suggesting that these indices may identify an existing arrhythmogenic substrate.
One difference between WMI and previous methods of risk stratification is that WMI does not require exercise, pharmaceutical stressors, or invasive electrical stimulation. Although WMI testing involves provocative QRS stimulation, ventricular arrhythmias were not present during testing or previous investigations, and are unlikely to occur.
While the precise cellular basis for WMI is unknown, our present finding as well as prior studies (Citation15) appear to indicate that these combined depolarization and repolarization phase abnormalities are a valid addition to the present spectrum of noninvasive risk stratification tools. Also, WM involves determination analysis of an evoked response (Citation20,Citation21), as compared with a passive response, that may probe the vulnerabilities of the myocardial substrate.
Since the primary purpose of this study was to determine whether using WMI could identify higher versus lower risk individuals, we included patients with both primary and secondary indications since differences in these population of patients are presumed temporal rather than fixed myocardial substrate-based differences. Nevertheless, despite the distinction between primary and secondary prevention indications not being part of the original study design, it is encouraging that the results of the sub analysis were statistically significant for both groups.
While it is too early to define exactly how WM testing can be incorporated into clinical decision making, there is, nevertheless, an emerging need for the development of noninvasive tools like WM that provide increased risk stratification (Citation6). Other suggestions have been made to complement, if not replace the LVEF-based rules, with tests aimed at the quantification of autonomic modulators (such as heart rate turbulence or deceleration capacity (Citation11,Citation12) or of repolarization abnormalities such as T-wave alternans (Citation10–11). Probably success will derive from multifactorial approaches in which different methods are combined (Citation10). Since the processes of ventricular depolarization and repolarization that are addressed by WM are different from other current risk stratification techniques, assessment of WM might provide an alternative index of risk and be included in future studies. After acute MI the indication for ICD is even more complex (Citation22).
Limitations
The study was a prospective observational trial in a population of non-consecutive post MI patients who underwent ICD implantation for standard criteria. The study included many centers, making the results possibly more dispersed, even though one of the authors visited all the centers to coordinate efforts. The lack of QRS duration for half of the patients is a limitation for the discussion.
This study results are not applicable to patients with a MI without present indications for ICD intervention. Further studies are therefore indicated. The study endpoints were defined as a significant life threatening ventricular arrhythmic event detected and treated by the ICD or a patient death due to cardiac arrhythmia. Although all ICD events were adjudicated and confirmed to be appropriate, the study was not a mortality trial. It is possible, but not probable, that some study endpoints may have self-terminated if not treated by the implanted device, and therefore the number of life-threatening events may be overstated. However, differences in WMI did predict appropriate ICD therapy for ventricular arrhythmias, which, in itself, is a useful clinical tool. A higher frequency of appropriate therapies was observed in the WMI positive group as compared with the WMI negative group. Moreover, the majority of ventricular arrhythmic events predicted was monomorphic and rapid, suggesting a persistent arrhythmic substrate associated with hemodynamic instability. Specific ICD programming was at the discretion of each cardiologist and was therefore not necessarily uniform among all study participants. However, since the ICD programming was independent of the WMI findings, no bias should be expected. WMI event prediction was not always significant in all sub-strata of patients with primary and secondary ICD indications. This is most likely a type-2 statistical error due to the relatively small number of patients who received ICD for secondary preventions. Nevertheless, the tests for the relative risks in the combined strata were significant in each WMI index. Finally, while clinical utility of WMI is likely in a combination with other risk factors, the present multi-center study was designed to test the predictive value of WMI alone. The combinations with other risk factors need to be investigated in future studies.
Conclusion
WM is a novel, semi-invasive and easily performed test that predicts future vulnerability to life-threatening ventricular arrhythmic events in patients late after myocardial infarction. In addition, WMI not only predicts ventricular arrhythmic events but predicts the cumulative proportion of patients who will experience events over time. While WMI is not an alternative to currently accepted guidelines for ICD implant, it can be expected that WM in combination with other risk-stratification techniques may be useful in selecting which patients are most at risk of sudden cardiac arrest and who may benefit most from ICD therapy.
Acknowledgments
The following cardiologists are acknowledged for their contribution to data collection: Paul Erne, Luzern; Jesus E. Val-Mejias, Wichita; Joerg O. Schwab, Bonn; Rainer Schimpf, Mannheim; Michael Orlov, Boston; Tom Mattioni, Phoenix; Katerina Hnatkova, St. Paul, London.
The centers involved in the study were Oslo University Hospital, Rikshospitalet, Oslo, Norway; Kantonsspital Luzern, Luzern, Switzerland; Galichia Heart Hospital, Wichita, Kansas, USA; Department of Medicine—Cardiology, University of Bonn, Bonn, Germany; University of Mannheim, Mannheim, Germany; Caritas St. Elizabeth's Hospital, Boston, Massachusetts, USA; Arizona Arrhytmia Consultants, Phoenix, Arizona, USA; St. Paul's Cardiac Electrophysiology, London, England; St. George's University of London, London, England; Mayo Clinic, Rochester, Minnesota, USA.
Declaration of interest: The authors report no declarations of interest. The authors alone are responsible for the content and writing of the paper.
References
- Ezekowitz JA, Armstrong PW, McAlister FA. Implantable cardioverter defibrillators in primary and secondary prevention: a systematic review of randomized, controlled trials. Ann Intern Med. 2003;138:445–52.
- Moss AJ, Hall WJ, Cannom DS, Debaurt JP, Higgins SL, Klein H, et al. (for the Multicenter Automatic Defibrillator Implantation Trial (MADIT) Investigators). Improved survival with an implantable defibrillator in patients with coronary artery disease at high risk for ventricular arrhythmia. N Engl J Med. 1996;335:1933–40.
- Moss AJ, Zareba W, Hall WJ, Klein H, Wilber DJ, Cannom DS, et al. (for the MADIT II Investigators). Prophylactic implantation of a defibrillator in patients with myocardial infarction and reduced ejection fraction. N Engl J Med. 2002;346:877–83.
- Buxton AE, Lee KL, Fisher JD, Josephson ME, Prystowsky EN, Hafley G, (for the Multicenter Unsustained Tachycardia Trial (MUSST) Investigators). A randomized study of the prevention of sudden death in patients with coronary artery disease. N Engl J.Med. 1999;341: 1882–90.
- Zipes DP, Camm AJ, Borggrefe M, Buxton AE, Chaitman B, Fromer M, et al. (for Practice Guidelines Writing Committee). ACC/AHA/ESC 2006 Guidelines for management of patients with ventricular arrhythmias and the prevention of sudden cardiac death. J Am Coll Cardiol 2006;48:E247–E346.
- Amlie JP, Olsson SB. Should we implant ICDs in more patients after myocardial infarction? Can we define the patient groups that benefits most? Scand Cardiovasc J. 2002;36:259–6.
- Buxton AE, Lee KL, Hafley GE, Pires LA, Fisher JD, Gold MR, et al. (for the MUSTT Investigators). Limitations of ejection fraction for prediction of sudden death risk in patients with coronary artery disease: lessons from the MUSTT study. J Am Coll Cardiol. 2007;50:1150–7.
- Passman R, Kadish A. Sudden death prevention with implantable devices. Circulation 2007;116:561–71.
- Chow T, Kereiakes DJ, Onufer J, Woelfel A, Gursoy S, Peterson BJ, et al. Does microvolt T-wave alternans testing predict ventricular tachyarrhythmias in patients with ischemic cardiomyopathy and prophylactic defibrillators? J Am Coll Cardiol. 2008;52:1607–15.
- Haugaa KH, Smedsrud MK, Steen T, Kongsgaard E, Loennechen JP, Skjaerpe T, et al. Mechanical dispersion assessed by myocardial strain in patients after myocardial infarction for risk prediction of ventricular arrhythmia. JACC Cardiovasc Imaging. 2010;3:247–56.
- Schmidt G, Malik M, Barthel P, Schneider R, Ulm K, Rolnitzky L, et al. Heart-rate turbulence after ventricular premature beats as a predictor of mortality after acute myocardial infarction. Lancet. 1999;353:1390–6.
- Bauer A, Kantelhardt JW, Barthel P, Schneider R, Mäkikallio T, Ulm K, et al. Deceleration capacity of heart rate as a predictor of mortality after myocardial infarction: Cohort study. Lancet. 2006;367:1674–81.
- Exner DV, Kavanagh KM, Slawnych MP, Mitchell LB, Ramadan D, Aggarwal SG, et al. (for the REFINE Investigators). Noninvasive risk assessment early after a myocardial infarction: the REFINE study. J Am Coll Cardiol. 2007; 50:2275–84.
- Breithardt G, Cain ME, el-Sharif N, Hombach V, Janse M, Somson MB, et al. Standards for analysis of ventricular late potentials using high-resolution or signal-averaged electrocardiography: A statement by a task force committee of the European Society of Cardiology, the American Heart Association, and the American College of Cardiology. Circulation. 1991;83:1481–8.
- Hnatkova K, Malik M. Noninvasive Wedensky modulation. Card Electrophysiol Rev. 1999;3:269–73.
- Hnatkova K, Ryan SJ, Bathen J, Hoium HH, Malik M. Non-invasive Wedensky modulation within the QRS complex. Med Biol Eng Comput. 2002;40:234–40.
- Malik M, Hnatkova K, Batchvarov VN. Post infarction risk stratification using the 3-D angle between QRS complex and T-wave vectoracutes. J Electrocardiol. 2004;37:P201–8.
- Elgarhi N, Kreuz J, Balta O, Nickenig G, Hoium H, Lewalter T, Schwab JO. Significance of Wedensky Modulation testing in the evaluation of non-invasive risk stratification for ventricular tachyarrhythmia in patients with coronary artery disease and implantable cardioverter-defibrillator. Heart. 2008;94:e16.
- Wedensky NE. Die Erregung, Hemmung und narkose. Pflügers Arch. 1903;100:1–9.
- Castellanos A, Lemberg L, Johnson D, Berkovits BV. The Wedensky effect in the human heart. Br Heart J. 1966; 28:276–283.
- Myerburg RJ, Reddy V, Castellanos A. Indications for Implantable Cardioverter-Defibrillators based on evidence and judgment. J Am Coll Cardiol. 2010;54:747–63.
- Erikssen G, Liestøl K, Gullestad L, Haugaa KH, Bendz B, Amlie JP. The terminal part of the QRS complex (peak T to end T) is a predictor for mortality after acute myocardial infarction. Ann Noninvasively Electrocardiol. 2012;17:85–94.