
Abstract
Objectives. Variability in data acquisition from intervened coronary arteries could represent a source of error that has implications for the design of serial stent studies. We assessed inter-pullback reproducibility of volumetric grayscale and radiofrequency intravascular ultrasound (IVUS) data in stented coronary arteries. Design. Fifteen patients with coronary artery lesions treated with stent implantation were included and examined with two separate pullbacks using the Eagle Eye Gold-phased array 20 MHz IVUS catheter (Volcano). The arteries were divided into five segments, giving a total of 150 sub-segments for analyses. Matching of frames was performed using landmarks that were clearly visible in coronary angiography and intravascular pullbacks. Data were analyzed off-line at an independent Corelab. Results. The inter-pullback reproducibility of geometrical data was very good for non-stented segments with relative differences less than 5% between pullbacks for lumen-, vessel-, and plaque volumes. For stented segments reproducibility was poorer with relative differences between pullbacks in the range of 5–10%. The inter-pullback reproducibility of compositional data demonstrated large standard deviations of relative differences, indicating a weaker agreement. Conclusions. Agreements between pullbacks were weaker in stented than those in non-stented segments. Based on our data, future longitudinal IVUS studies in intervened vessels should account for a variability of 5–10% attributed to the acquisition of images.
Key words::
Introduction
Volumetric grayscale intravascular ultrasound (GS-IVUS) and radiofrequency intravascular ultrasound (RF-IVUS) enable assessment of both geometrical and compositional characteristics of coronary atherosclerosis (Citation1). The identification of certain plaque characteristics, such as large plaque burden and thin-cap fibroatheroma, has been associated with acute coronary events (Citation2), and therefore in vivo characterization of plaques is highly relevant as endpoint in intervention trials. Several studies have documented that repeated analyses of IVUS recordings are highly reproducible, both in non-stented (Citation3) and stented coronary segments (Citation4–6). The variability of volumetric IVUS data acquisition, that is, inter-pullback reproducibility, is also found acceptable (Citation7,Citation8), but there is a lack of data from stented coronary arteries. Variability in data acquisition from intervened vessels could potentially represent a source of error that may have implications for the design of serial stent studies assessing the development of in-stent restenosis. The aim of the current study was therefore to compare data from two repeated volumetric GS-IVUS and RF-IVUS pullbacks at a single time-point, and to assess inter-pullback variability in different diseased segments in stented coronary arteries.
Methods
Patients with stable angina pectoris or non-ST segment elevation acute coronary syndrome with an indication for percutaneous coronary intervention (PCI) were recruited from the Department of Cardiology at St.Olavs Hospital (Trondheim, Norway). To assess inter-pullback variability, GS-IVUS and RF-IVUS imaging was performed twice in the same coronary artery following stent implantation. Exclusion criteria were severe vessel tortuosity and heavy calcifications. Written informed consent was warranted prior to the catheterization procedure, and the study was approved by the Regional Ethics Committee (Regional Ethics Committee of Central Norway 2010/1112).
Image acquisition
Prior to introducing the IVUS catheter in the index artery, 200 μg of nitroglycerin was administered intracoronary. Following coronary angiography and intervention using the radial route, intravascular images were obtained. The procedure was conducted using the commercially available Eagle Eye Gold phased array 20 MHz IVUS pullback (Volcano Corp, Rancho Cordova, CA, USA) and RF backscatter data were collected simultaneously. Acquisition was triggered by the R wave peak of the patient's electrocardiogram. IVUS catheters were advanced more than 10 mm beyond the distal stent edge, and pullbacks were continued through the stented region and proximally into the ostium. A motorized pullback speed of 0.5 mm/s, using the Volcano R100 pullback device, was used in all pullbacks.
The pullback was repeated, on average 5–10 min after the first one, following administration of another 200 μg of nitroglycerin intracoronary, using the same catheter, set up and pullback device that were used in the first pullback. Data from the two pullbacks were stored separately for later offline analysis. Coding of data precluded matching of corresponding pullbacks in the analysis phase.
Image analyses
GS-IVUS and RF-IVUS image analyses were performed offline, according to current recommendations (Citation9,Citation10), by two independent, experienced analysts at Krakow Cardiovascular Research Institute, Krakow, Poland. Matching of frames was performed using angiographic- and ultrasound landmarks that were clearly visible both in coronary angiography and intravascular pullbacks.
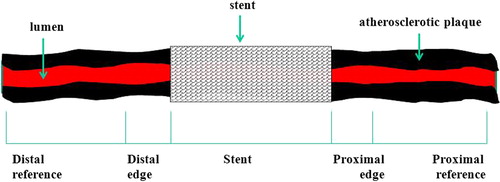
In all patients, the first pullback was named “A” and the second pullback was named “B”. Pullbacks were divided into 5 segments (): distal reference, distal edge, stent, proximal edge, and proximal reference. Proximal and distal reference segments were defined as segments starting as proximally or distally as possible, to 5 mm from the proximal or distal stent edge. Proximal and distal edges were defined as segments starting 5 mm proximal or distal to the stent edge, ending at the first cross-sectional image where the stent covered at least 50% of the vessel wall circumference. Subsequently, the same segments were imaged using side-by-side comparison of the longitudinal and cross-sectional views (). Vessel borders were traced using a semiautomatic contour detection program (QIvus 2.1, Medis, Leiden, the Netherlands). Lumen and vessel borders of each cross-sectional image per segment were manually corrected, if necessary, to increase accuracy. Lumen borders were detected by tracing the leading edge of intima, and total vessel border was detected by tracing the leading edge of adventitia. Analyses were performed separately for GS-IVUS and RF-IVUS pullbacks.
Figure 1. Schematic drawing illustrating coronary artery segments that were analyzed in the current study.
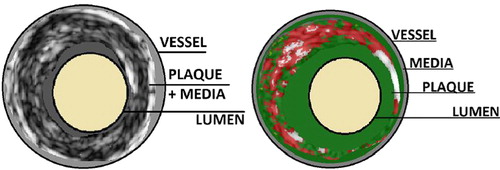
In GS-IVUS pullbacks, lumen, vessel, and plaque volumes were estimated. Atherosclerotic plaque volume was defined as the difference between total vessel and lumen volumes. This difference includes also the media volume and therefore it is commonly addressed as the plaque + media complex. Volumetric compositional RF-IVUS (virtual histology) reveals information on plaque composition from the space between lumen and vessel borders. Plaque composition is color-encoded into four subtypes: fibrous (green color), fibro-lipid (green-yellowish color), calcium (white color), and necrotic-core (red color). The sum of the four virtual histology subtype volumes does not correspond to the plaque + media complex from GS-IVUS data (vessel minus lumen), as RF data exclude the media volume. The relationship between RF-plaque and GS-plaque + media data is schematically shown in .
Figure 2. Relationship between grayscale-plaque+ media data and radiofrequency-plaque.
Data presentation and statistics
Inter-pullback variability was summarized by presenting mean lumen-, vessel- and plaque volumes and virtual histology plaque- and subtype tissue volumes with standard deviations of both pullbacks. We measured the absolute difference and the relative difference between pullbacks, taking into consideration all quantitative measurements. The relative difference was normalized for the maximum value of the two measurements. Data are presented in different coronary sub-segments and for the whole analyzed segment (including all five sub-segments in GS-IVUS, and including all but the stented segment in RF-IVUS).
If the relative difference between two pullbacks was between − 5% and 5%, the agreement was considered very good. Reproducibility was also assessed visually using Bland–Altman plots. JMP 9.0.0 was used for statistical analysis and data visualization (SAS Institute, Cary, USA).
Results
Fifteen patients with significant coronary artery lesions treated with stent implantation were included and examined with two separate pullbacks. Thus, a total of 30 pullbacks were available for analysis and a total of 150 coronary sub-segments were analyzed with GS-IVUS and 120 segments with RF-IVUS as stented segments were excluded from the latter analysis. The mean lesion length was 12.0 mm, and the mean diameter and length of the stent was 3.0 and 22.3 mm, respectively. Clinical and angiographic data of the study population are presented in . There were no procedural complications during intravascular data collection.
Table I. Clinical and angiographic data.
Inter-pullback reproducibility in GS-IVUS analyses of lumen volumes was very good for both stented and non-stented segments () with relative differences between ± 5%. For all non-stented segments (i.e., distal reference segment, distal edge segment, proximal edge segment, and proximal reference segment), and for the whole segment (; ) absolute differences between pullbacks were low, and relative differences ranged between − 5% and 5% for lumen-, vessel- and plaque volumes. For the plaque volumes, standard deviations of the relative differences were larger than for the lumen and vessel volumes, indicating a weaker agreement ().
Figure 3. Bland Altman plot displaying the inter-pullback reproducibility between pullbacks for grayscale lumen volume (mm3) in the whole vessel. The thin discontinued lines show limits of agreement, upper limit 53.5 mm3 and lower limit − 45.5 mm3.
Table IIa. Inter-pullback reproducibility of GS IVUS lumen volume (mm3) in sub-segments.
Table IIb. Inter-pullback reproducibility of GS IVUS vessel volume (mm3) in sub–segments.
Table IIc. Inter-pullback reproducibility of GS-IVUS plaque volume (mm3) in sub-segments.
Table III. Inter-pullback reproducibility of GS-IVUS lumen, vessel, and plaque + media volume (mm3) in whole segments.
For the stented segments, agreements between pullbacks were inferior compared to non-stented segments with larger absolute differences between pullbacks, and the relative differences were higher with larger standard deviations than in non-stented segments ().
The inter-pullback reproducibility in RF-IVUS analyses was generally inferior to reproducibility in GS-IVUS analyses (). For RF-plaque volumes, the relative differences were large for the distal reference segment and distal edge segment, due to generally small plaque volumes in these segments. This resulted in large percentage relative differences although absolute differences in these segments were rather small and comparable with the other segments. When analyzing RF-plaque volume in the whole non-stented segment, the relative difference between pullbacks was − 4.5% corresponding to a very good agreement. For plaque subtypes volumes, the absolute differences between pullbacks were low and the relative differences between pullbacks ranged from − 7.0% to 4.8% (). However, all RF-analyses revealed large standard deviations for the relative differences, indicating a weaker agreement than in GS-analyses. For necrotic core volume, the relative difference between pullbacks was 2.4%, and was the lowest of the four tissue types. Bland–Altman plot for necrotic core volume in the whole segment is illustrated in .
Figure 4. Bland Altman plot displaying the inter-pullback reproducibility between pullbacks for necrotic core volume (mm3) in the whole vessel. The thin discontinued lines show limits of agreement, upper limit 16.1 mm3 and lower limit − 18.5 mm3.
Table IV. Inter-pullback reproducibility of RF-IVUS plaque volumes (mm3) in sub-segments and in whole segment.
Table V. Inter-pullback reproducibility of RF-IVUS plaque subtypes volumes (mm3) in whole segments.
Discussion
Volumetric IVUS is an established method to assess geometrical and compositional characteristics of coronary plaques in serial studies, and is also the method of choice to evaluate in-stent hyperplasia or restenosis. There is a lack of reproducibility data from stented coronary arteries. Variability in data acquisition from intervened vessels could potentially represent a source of error that may have implications for the design of serial stent studies assessing the development of in-stent restenosis. We assessed the accuracy of volumetric GS-IVUS and RF-IVUS image acquisition after coronary stent implantation by comparing two different pullbacks at the same time point, thus simulating data collection in a serial study performed in stented coronary arteries. Our main finding was that inter-pullback reproducibility of data using GS-IVUS was very good for non-stented segments while the agreements between pullbacks were weaker in stented segments. The inter-pullback reproducibility of compositional data by RF-IVUS was acceptable, but standard deviations of the relative differences were larger than in GS-analyses, indicating a weaker agreement.
The reproducibility of two-dimensional GS-IVUS and RF-IVUS from repeated pullbacks was assessed by Rodriguez–Granillo et al., who demonstrated very reproducible geometrical measurements, and that compositional measurement in RF-IVUS analyses were more variable than GS-variables (Citation11). Some years later, these findings were confirmed in a study using a clinical setting approach, demonstrating excellent agreement between pullbacks for two-dimensional geometrical data, and acceptable agreement for two-dimensional compositional data (Citation8). Hartmann et al. were the first to examine reproducibility of volumetric RF-data from repeated pullbacks. In this study, a high agreement between repeated pullbacks for most variables was demonstrated, and the reproducibility for compositional measurements was slightly lower than for geometrical measurements (Citation7). None of the abovementioned studies included patients with coronary stents, and therefore results may not be generalized to a population with intervened coronary arteries.
Intracoronary stents represent a challenge in IVUS data acquisition due to a higher tendency of the catheter to stall or stick during pullback of the IVUS probe through stented segments. It may therefore be anticipated that the inter-pullback reproducibility in stented segments is lower than in non-stented segments. This is an important topic due to the share of clinical studies that use IVUS for the assessment of coronary stents, such as the development of in-stent hyperplasia or restenosis (Citation12–14). In our study, the inter-pullback reproducibility of measurements in stented segments was indeed somewhat lower than in non-stented segments. However, relative differences between different pullbacks did not exceed 10% for any variable in the stented segment, and ranged in the magnitude of 5–7% for lumen-, vessel-, and plaque volumes. Although small, the lower agreement between pullbacks in stented segments may be clinically significant in longitudinal studies assessing the process of in-stent hyperplasia. Observed changes in in-stent geometry, such as the in-stent lumen volume, tend to be rather small (Citation15). Based on our data, future longitudinal studies using IVUS in stented coronary arteries should therefore account for a variability of 5–10% attributed to the acquisition of images.
Our findings from non-stented segments and RF-IVUS support the previously reported data from non-intervened vessels (Citation7,Citation11), as relative differences between pullbacks were less than 5% for most GS-geometrical variables and slightly higher for compositional variables. In RF-plaque volume analysis, the relative difference between pullbacks was less than 5% when analyzing the non-stented segments combined, corresponding to a very good agreement. This indicates that reproducibility of IVUS parameters in non-stented segments of stented coronary arteries is not influenced by the stent. This is an important piece of information as it could be anticipated that the stent could interfere with the entire pullback thus affecting the results also in non-stented segment. For plaque subtype volumes, absolute differences between pullbacks were low, and relative differences were less than 7% for all four tissue types. However, standard deviations for the relative differences were larger than for GS-variables, indicating a weaker agreement. Necrotic core output showed the lowest variability of all tissue types with a relative difference between pullbacks of 2.4%. The reproducibility of necrotic core between pullbacks is important, as necrotic core is the main component of the thin-cap fibroatheroma (Citation10), which is used as endpoint in clinical trials due to its property as precursor to plaque rupture (Citation16) and the association with coronary events (Citation2). It should be noted that RF-IVUS data acquisition is triggered by the R-wave in ECG. Accordingly, heart rate will influence data collection. In our study there was no significant difference in heart rate in the short time interval between the two pullbacks. However, in serial studies with RF-IVUS data collection during two separate interventional procedures heart rate may significantly differ and thus influence reproducibility of RF-IVUS results.
The present study should also be interpreted with some other limitations as the number of patients and coronary segments in the present study was limited, but still comparable to other studies that have assessed IVUS reproducibility (Citation7,Citation8,Citation11). Observer reproducibility was not measured in the present study, and as images were analyzed offline at a CoreLab with very experienced analysts, observer reproducibility may be higher than in clinical and online IVUS cases. Nevertheless, this would imply that the observed differences between pullbacks are the result from true differences during image acquisition.
Conclusions
The present study demonstrated that in stented coronary arteries the inter-pullback reproducibility were weaker in stented than in non-stented segments. Based on our data, future longitudinal IVUS studies in intervened vessels should account for a variability of 5–10% attributed to the acquisition of images. Our findings may have implications for the design and power calculations in longitudinal studies using IVUS-based endpoints in stented coronary arteries.
Acknowledgments
We appreciate the assistance of Tove Vindsetmo, Ann Mari Myraunet and Anita Størdal at the Angiolab at St.Olav's University Hospital in inclusion of patients.
Declaration of interest: The authors report no declarations of interest. The authors alone are responsible for the content and writing of the paper.
The study was conducted with funding from The Liaison Committee for Central Norway Regional Health Authority and the Norwegian University of Science and Technology, the Reserarch Fund at St.Olav's University Hospital, the Norwegian Council on Cardiovascular Disease, and the Norwegian Council for Public Health.
References
- Garcia-Garcia HM, Costa MA, Serruys PW. Imaging of coronary atherosclerosis: intravascular ultrasound. Eur Heart J. 2010;31:2456–69.
- Stone GW, Maehara A, Lansky AJ, de Bruyne B, Cristea E, Mintz GS, et al. A prospective natural-history study of coronary atherosclerosis. N Engl J Med. 2011;364:226–35.
- Huisman J, Egede R, Rdzanek A, Bose D, Erbel R, Kochman J, et al. Multicenter assessment of the reproducibility of volumetric radiofrequency-based intravascular ultrasound measurements in coronary lesions that were consecutively stented. Int J Cardiovasc Imaging. 2012;28:1867–78.
- Regar E, Werner F, Klauss V, Siebert U, Henneke KH, Rieber J, et al. IVUS analysis of the acute and long-term stent result using motorized pullback: intraobserver and interobserver variability. Catheter Cardiovasc Interv. 1999; 48:245–50.
- Regar E, Werner F, Siebert U, Rieber J, Theisen K, Mudra H, et al. Reproducibility of neointima quantification with motorized intravascular ultrasound pullback in stented coronary arteries. Am Heart J. 2000;139:632–7.
- Blessing E, Hausmann D, Sturm M, Wolpers HG, Amende I, Mugge A. Intravascular ultrasound and stent implantation: intraobserver and interobserver variability. Am Heart J. 1999;137:368–71.
- Hartmann M, Mattern ES, Huisman J, van Houwelingen GK, de Man FH, Stoel MG, et al. Reproducibility of volumetric intravascular ultrasound radiofrequency-based analysis of coronary plaque composition in vivo. Int J Cardiovasc Imaging. 2009;25:13–23.
- Prasad A, Cipher DJ, Mohandas A, Roesle M, Brilakis ES, Banerjee S. Reproducibility of intravascular ultrasound virtual histology analysis. Cardiovasc Revasc Med. 2008;9:71–7.
- Mintz GS, Garcia-Garcia HM, Nicholls SJ, Weissman NJ, Bruining N, Crowe T, et al. Clinical expert consensus document on standards for acquisition, measurement and reporting of intravascular ultrasound regression/progression studies. EuroIntervention. 2011;6:1123–30.
- Garcia-Garcia HM, Mintz GS, Lerman A, Vince DG, Margolis MP, van Es GA, et al. Tissue characterisation using intravascular radiofrequency data analysis: recommendations for acquisition, analysis, interpretation and reporting. EuroIntervention. 2009;5:177–89.
- Rodriguez-Granillo GA, Vaina S, Garcia-Garcia HM, Valgimigli M, Duckers E, van Geuns RJ, et al. Reproducibility of intravascular ultrasound radiofrequency data analysis: implications for the design of longitudinal studies. Int J Cardiovasc Imaging. 2006;22:621–31.
- Hakim DA, Mintz GS, Sanidas E, Rusinova R, Weisz G, Leon MB, et al. Serial gray scale intravascular ultrasound findings in late drug-eluting stent restenosis. Am J Cardiol. 2013;111:695–9.
- Tsujino I, Koizumi T, Shimohama T, Ako J, Waseda K, Krucoff M, et al. Intravascular ultrasound insights from the Cobalt Chromium Stent With Antiproliferative for Restenosis II (COSTAR II) trial comparing CoStar and Taxus paclitaxel-eluting stents. Cardiovascular Revascularization Medicine. 2012;13:111–8.
- Yamasaki M, Tsujino I, Lima-Filho MO, Ako J, Shimohama T, Hasegawa T, et al. Comparison of vascular response to the everolimus-eluting stent versus the paclitaxel-eluting stent: intravascular ultrasound results from the SPIRIT III trial. EuroIntervention. 2012;8:724–31.
- Brugaletta S, Costa JR Jr, Garcia-Garcia HM. Assessment of drug-eluting stents and bioresorbable stents by grayscale IVUS and IVUS-based imaging modalities. Int J Cardiovasc Imaging. 2011;27:239–48.
- Finn AV, Nakano M, Narula J, Kolodgie FD, Virmani R. Concept of vulnerable/unstable plaque. Arterioscler Thromb Vasc Biol. 2010;30:1282–92.