Abstract
Glutathione S-transferase enzyme (GST) (EC 2.5.1.18) was purified from rainbow trout erythrocytes, and some characteristics of the enzyme and effects of some metal ions on enzyme activity were investigated. For this purpose, erythrocyte glutathione S-transferase enzyme which has 16.54 EU/mg protein specific activities was purified 11,026-fold by glutathione-agarose affinity chromatography with a yield of 59%. Temperature was kept under control (+4°C) during purification. Enzyme purification was checked by performing SDS-PAGE. Optimal pH, stable pH, optimal temperature, and KM and Vmax values for GSH and 1-chloro-2, 4-dinitrobenzene (CDNB) were also determined for the enzyme. In addition, IC50 values, Ki constants and the type of inhibition were determined by means of Line-Weaver-Burk graphs obtained for such inhibitors as Ag+; Cd2+, Cr2+ and Mg2+.
Introduction
Glutathione S-transferase plays a crucial role by detoxifying xenobiotics in combination with several mechanisms in the metabolismCitation1. This enzyme inactivates electrophilic xenobiotics by conjugating them with reduced glutathione (GSH) and eliminates them from the bodyCitation2. Glutathione S-transferase isoenzymes are homodimeric and heterodimeric proteins synthesized from a multitude of gene loci with a molecular mass of about 25 kDa. Each subunit has an active position involving two different functional sites, which are the G region that binds the physiological substrate and the hydrophobic H region that binds the structurally different electrophilic substrates. The amino acid composition of GST isozymes differs in the hydrophobic H region, which is the reason behind the substrate diversity of the enzyme family. Glutathione S-transferase is a member of the family of phase-II detoxification enzymes which catalyze the conjugation of glutathione with xenobiotics, to which living organisms are exposed voluntarily or involuntarily, and convert them into less toxic metabolitesCitation3–5.
The effects of some metal ions on E. Coli GSTCitation6, human serum GSTCitation7, rainbow trout liver GR, human erythrocyte CA-I, CA-II and human erythrocyte GR activities have been investigatedCitation8,Citation9. However, no reports could be found in the literature about the effects of Ag+, Cd2+, Cr2+, and Mg2+ on rainbow trout erythrocytes GST. Dispersion and penetration properties of metals in the environment, which may cause vital danger in living organisms, are notable and very common. Metals are notable for their wide environmental dispersion from such activities as their tendency to accumulate in select tissues of the human body and their overall potential to be toxic even at relatively minor levels of exposure. On the other hand, some metals such as copper and iron are essential to life and play unavoidable roles in some critical enzyme systems. Other metals, xenobiotic, i.e., have no useful role in human physiology (and most other living organisms) and, even worse, as in the case of lead and mercury, may be toxic even at trace levels of exposureCitation8,Citation9. The aim of this study was to investigate in vitro effects of some metal ions on purified and characterized rainbow trout erythrocytes GST activities.
Material and methods
Materials
Glutathione-agarose, Sephadex G-100, GSH, CDNB, protein assay reagents, chemicals for electrophoresis and all other chemicals used were obtained from either Sigma or Sigma-Aldrich Co. (Germany).
Preparation of the haemolysate
Fresh fish blood was sampled into heparinised (5 IU/mL) Vacuntainer® tubes and centrifuged at 2.500g for 15 min. The plasmas were removed by drip. The erythrocytes were washed three times with isotonic NaCl solution (0.154 M) the samples being centrifuged at 2.500g each time and the supernatants removed. The erythrocytes were haemolysed with 5 vol. of ice-cold water and centrifuged (+4°C, 10.000g) for 30 min to remove ghosts and intact cells. Then, all haemolysate samples were pooled in a tubeCitation10.
Glutathione-agarose affinity chromatography
A 1 g lyophilized powder of glutathione-agarose was weighed for 10 mL of bed volume and washed several times with 200 mL distilled water to remove solid particles. Washing swelled the gel, which was degraded by using a water trompe and suspended by adding stabilization buffer (0.05 M K-phosphate (pH 7.4), 1 mM EDTA, and 1 mM DTT). The suspended gel was packed in a cooled column with a 1 × 10 cm closed system. After precipitation, the gel was washed using a peristaltic pump with stabilization buffer. Stabilization of the column was clear from the fact that the absorbance and pH of the eluate and buffer were identical. The affinity column was thus prepared. The prepared heamolysate was directly applied to the glutathione-agarose affinity column. Subsequently, the column was washed by passing through 10 mM KH2PO4 and 0.1 M KCl (pH 8.0). The washing procedure was monitored on a spectrophotometer through equal-to-blind absorbance values. After the column was stabilized, the enzyme was purified by gradient elution. Elution solvent was prepared from a solvent gradient containing 50 mM Tris–HCl and (1.25–10 mM GSH, pH 9.5). The eluates were taken into 1.5 mL tubes and their activity was measured by monitoring the increase in absorbance at 340 nm. The column flow rate was set to 35 mL/h using a peristaltic pump. The purification procedure was carried out at +4°CCitation2,Citation11.
Activity determination
Among its many other substrates, the aromatic electrophile 1-chloro-2,4-dinitrobenzene is one that is most often used to determine GST enzyme activity. As the product obtained by the use of this substrate, dinitrobenzene S-glutathione (DNB-SG) displays maximum absorbance at 340 nm. Activity measurements were thus carried out by using the absorbance increase at this wavelength. In order to measure the activity of enzyme firstly, 0.5 M 200 µL potassium phosphate buffer (K2HPO4/KH2PO4 pH 7.4) and 25 mM 20 µL 95% CDNB (in ethanol) were added in to the cuvettes. After incubation at 37°C for 3 min, 20 mM 50 µL GSH was added to cuvettes, and thoroughly stirred. After a quick addition of 50 µL enzyme sample, the cuvettes were placed in the spectrophotometer and reading was initiatedCitation12.
Protein determination
Bradford’s method was followed in quantitative protein determination. This method is based on the binding of Coomassie Brilliant Blue G-250 to protein. The complex formed spectrophotometrically shows maximum absorbance at 595 nm. We used bovine serum albumin solution as standardCitation13.
SDS-polyacrylamide gel electrophoresis
To control enzyme purity, Laemmli’s procedure was performed in 3% and 10% acrylamide concentrations for stacking and running gels, respectively. 1% SDS was added to this acrylamide solution. The obtained SDS-polyacrylamide gel electrophoresis (SDS-PAGE) gel was first stabilized for 30 min in a solution containing 50% propanol, 10% TCA, and 40% distilled water. Then, the gel was stained for 2 h in a solution containing 0.1% Coomassie Brilliant Blue R-250, 50% methanol, and 10% acetic acid. Finally, washing was performed with a solvent containing 50% methanol, 10% acetic acid, and 40% distilled water until the protein bands were clearCitation14.
Optimal pH determination
For the optimal pH determination, the enzyme activity was measured in 0.5 M phosphate buffers within the pH of 5.3 to 8.0.
Optimum ionic strength determination
For determination of optimum ionic strength, enzyme activity was determined using different concentrations of phosphate buffer, pH: 7.3, in the range from 0.01 M to 0.2 M.
Stable pH determination
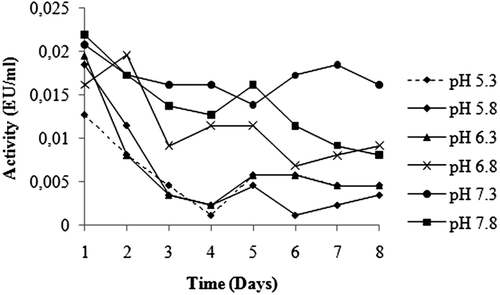
For this purpose, the enzyme activity was determined in 1 M phosphate buffer at pH of 5.3, 5.8, 6.3, 6.8, 7.3, and 7.8. In each experiment, equal volumes of buffer and enzyme solutions were mixed and kept refrigerated (+4°C). Activity determinations were made within an interval of 1 day to 8 days.
Effect of temperature on GST activity
The enzyme activity was measured between 0 and 70°C at optimal pH and ionic strength for this purpose.
Molecular weight determination
Sephadex G-100 gel filtration
The molecular weight of the enzyme was determined according to AndrewsCitation15. At first, to calculate the void volume, Blue Dextran (2000 kDa) was passed through the column; then, cytochrome c (12 kDa), bovine erythrocyte carbonic anhydrase (29 kDa), yeast alcohol dehydrogenase (150 kDa) and β-amylase (200 kDa) were used as standard proteinsCitation16.
SDS-PAGE
The subunit determination was made by SDS-PAGECitation10. Rabbit phosphorylase B (97.4 kDa), bovine albumin (66 kDa), chicken ovalbumin (45 kDa), and bovine carbonic anhydrase (29 kDa) were used as standards.
Kinetic studies
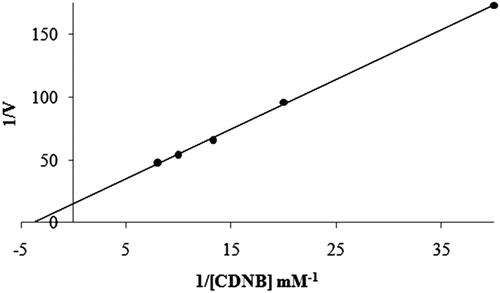
For KM and Vmax evaluation, we used Lineweaver-Burk curves obtainedCitation17 with five different concentrations of CDNB (0.0005, 0.001, 0.015, 0.002 and 0.0025 mM) and one constant concentration of GSH (1 mM). The same experiments were done with five different concentrations of GSH (0.001, 0.002, 0.003, 0.004 and 0.005 mM) and one fixed CDNB concentration (0.5 mM). All kinetic studies were performed at 25°C and at optimal pH (0.01 M K-phosphate, pH 7.3).
In vitro metal ions effects
In order to determine the effects of some metal ions on human GST, different concentrations of Ag+ (0.005–0.06 mM), Cd2+ (0.025–0.5 mM), Cr2+ (0.25–1.5 mM), Mg2+ (20–68 mM), were added to the reaction medium. The enzyme activity was measured and an experiment in the absence of inhibitor was used as control (100% activity). The IC50 values were obtained from activity (%) vs. metal ion concentration plots. In order to determine Ki constants in the media with inhibitor, the substrate (GSH) concentrations were 0.04, 0.1, 0.18, 0.25 and 0.4 mM. Inhibitors (metal ions) solutions were added to the reaction medium, resulting in 3 different fixed concentrations of inhibitors in 1 mL of total reaction volume. Lineweaver-Burk graphs were drawn by using 1/V vs. 1/[S] values and Ki constant were calculated from these graphsCitation17.
Results
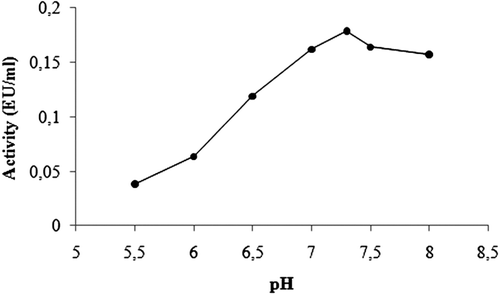
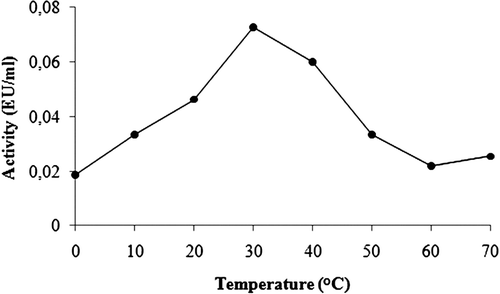
Purification of GST enzyme led to a specific activity of 16.54 EU/mg proteins, a yield of 59% and a purification coefficient of 11,026 (). SDS polyacrylamide gel electrophoresis was performed after the purification of the enzyme, and the electrophoretic pattern was photographed (). For the standard proteins and GST, Rf values were calculated, and an Rf-Log MW graph () was obtained according to Laemmli’s procedure, showing a molecular weight of 23 kDa for GST. The molecular weight of the enzyme was also determined by gel filtration chromatography. A Kav-log MW graph was obtained (), which showed a molecular weight of 47 kDa for GST. Optimal pH, optimal ionic strength, optimal temperature and stable pH for enzyme were found as 7.3 using 0.01 M K-phosphate (), 10 mM K-phosphate () and 30°C () and 7.3 using 0.01 M K-phosphate (), respectively. The Lineweaver-Burk graphs constructed for GSH and CDNB are shown in and , which were constructed for GSH and CDNB. A KM of 0.0395 mM and a Vmax of 0.0328 EU/mL were obtained for GSH, and 0.259 mM and 0.0655 EU/mL for CDNB. IC50 values of Ag+, Cd2+, Cr2+, Mg2+ were 0.0348, 0.171, 1.042 and 46.33 mM, and the Ki constants 0.0243 ± 0.009, 0.0243 ± 0.009, 2.506 ± 1.1040, and 65.73 ± 17.378 mM, respectively ( and and ). All inhibition types for metal ions were found non-competitive.
Table 1. Purification scheme of GST from rainbow trout erythrocytes.
Table 2. Ki and IC50 values obtained from regression analysis graphs for rainbow trout erythrocytes GST in the presence of different metal ion concentrations.
Figure 1. SDS-PAGE photograph. Lane 1: Rainbow trout erythrocytes GST. Lane 2: Standard proteins: rabbit phosphorylase B (97 kDa), bovine albumin (66 kDa), chicken ovalbumin (45 kDa), bovine erythrocyte carbonic anhydrase (29 kDa).
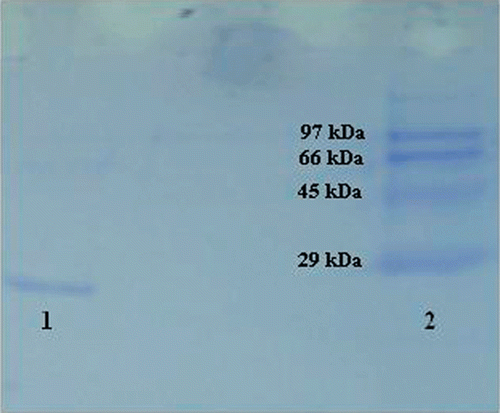
Figure 2. Standard Rf-Log MW graph of GST using SDS-PAGE. (Standards: Rabbit phosphorylase B (97.4 kDa), bovine albumin (66 kDa), chicken ovalbumin (45 kDa), and bovine carbonic anhydrase (29 kDa).
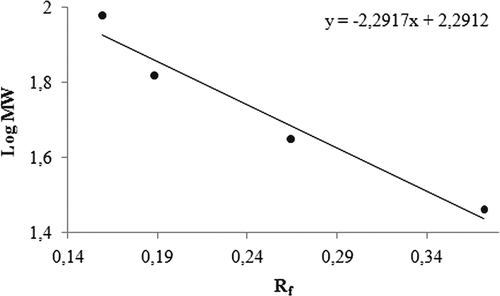
Figure 3. Standard Kav-Log MW graph of GST using gel filtration. (Standards: Cytochrome c (12 kDa), bovine erythrocyte carbonic anhydrase (29 kDa), yeast alcohol dehydrogenase (150 kDa) and β-amylase (200 kDa).
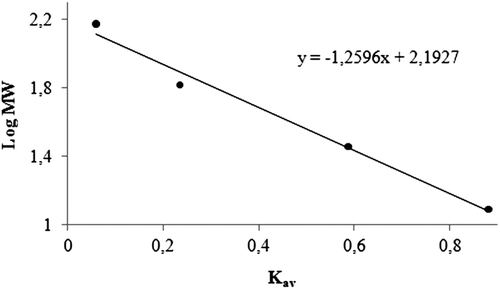
Figure 8. Lineweaver-Burk graph in 5 different GSH concentrations and in constant CDNB concentration.
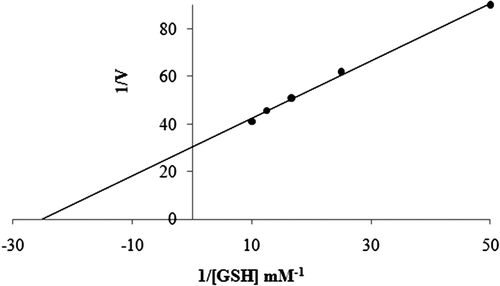
Figure 9. Lineweaver-Burk graph in 5 different CDNB concentrations and in constant GSH concentration.
Discussion
As is well known, medications used for treatment of different diseases have numerous adverse effects for metabolism. The metabolism contains various enzymatic and non-enzymatic defense systems to eliminate or minimize such side effects. Enzymatic defense is provided by several enzyme systems such as glutathione S-transferase, glutathione reductase, glutathione peroxidase, superoxide dismutase, and catalaseCitation18. With a specific role in the metabolism of a wide group of electrophilic substrate that include antibiotic, analgesic, and anticancer medications, glutathione S-transferasesCitation10–12 constitute a group of multifunctional enzymes which are involved in conjugating both endogenous and exogenous electrophilic compounds with reduced glutathione (GSH) and thus catalyzing their conversion into less toxic metabolitesCitation19–21.
Rainbow trout erythrocyte GST was purified in this study by heamolysate preparation and glutathione-agarose affinity chromatography. shows a purification characterized with a specific activity of 16.54 EU/mg proteins, a yield of 59% and a purification coefficient of 11,026. These figures mean that the procedure used in the study is good enough to be used by investigators. This purification procedure also has an advantage of short experimental duration of about 6 to 7 h. exhibits the SDS-PAGE done for the determination of purity and molecular weight of the enzyme. A high purity for the enzyme has been obtained. Also to perform kinetic studies; optimal pH, optimal ionic strength, optimal temperature and stable pH (–) and KM and Vmax for substrate’s ( and ) were found for enzyme.
Additionally, molecular weights of GST were found 23 and 47 kDa with SDS-PAGE and gel filtration respectively ( and ). Since the molecular weight determined by gel filtration chromatography was approximately two-fold greater than that of SDS-PAGE electrophoresis, native GST may be a homodimer.
Heavy metals have various toxicological effects on living organisms. For example, it has been reported that heavy metals such as mercury and cadmium exist exert toxic action in a synergistic fashion with salinityCitation22,Citation23. To the best of our knowledge, although the toxic effects of the metal ions have been described, their effects on rainbow trout erythrocyte GST have not been studied yet.
In order to show inhibitory effects, while the most suitable parameter is the Ki constant, some researchers use the IC50 value. Therefore, in this study, both the Ki and IC50 parameters of these metal ions for GST were determinedCitation24. As shown in , the Ki values were 0.0243 ± 0.009, 0.0243 ± 0.009, 2.506 ± 1.1040, and 65.73 ± 17.378 mM for Ag+, Cd2+, Cr2+, and Mg2+, respectively and the corresponding IC50 values were 0.0348, 0.1710, 1.0420 and 46.330 mM, respectively. Ki values and IC50 values show that Ag+ was the most potent inhibitor followed by Cd2+, Cr2+ and Mg2+ respectively.
An examination of the Ki constants and IC50 values of the medications with inhibitory effect on the activity of rainbow trout erythrocyte GST enzyme () demonstrates that all of them are strong inhibitors of GST, but Ag+ is the medication displaying the highest inhibitory effect. Both the results of our study and those of others in the literature we have mentioned have revealed that the metal ions used in the present research are potential inhibitors for metabolic enzymes. Such medications inhibit not only GST enzyme, but also other enzymes that produce glutathione as a GST substrate (glutathione reductase), which will result in a serious failure of detoxification reactions. Therefore, the people and especially the industrialists and administrators need to be extremely careful about the metal and industrial residues.
Declaration of interest
The authors declare no conflicts of interest.
References
- Hayes JD, Pulford DJ. The glutathione S-transferase supergene family: Regulation of GST and the contribution of the isoenzymes to cancer chemoprotection and drug resistance. Crit Rev Biochem Mol Biol 1995;30:445–600.
- Güvercin S, Erat M, Sakiroglu H. Determination of some kinetic and characteristic properties of glutathione S-transferase from bovine erythrocytes. Protein Pept Lett 2008;15:6–12.
- Hayes JD, Flanagan JU, Jowsey IR. Glutathione transferases. Annu Rev Pharmacol Toxicol 2005;45:51–88.
- Strange RC, Spiteri MA, Ramachandran S, Fryer AA. Glutathione-S-transferase family of enzymes. Mutat Res 2001;482:21–26.
- Armstrong RN. Structure, catalytic mechanism, and evolution of the glutathione transferases. Chem Res Toxicol 1997;10:2–18.
- Iizuka M, Inoue Y, Murata K, Kimura A. Purification and some properties of glutathione S-transferase from Escherichia coli B. J Bacteriol 1989;171:6039–6042.
- Turkanoglu A. (2007). Human serum arylesterase and glutathıone S-transferase activities in patients with ischemic stroke compared to healthy controls. Approval of the thesis master of science in biochemistry department, Middle East Technical University.
- Tekman B, Ozdemir H, Senturk M, Ciftci M. Purification and characterization of glutathione reductase from rainbow trout (Oncorhynchus mykiss) liver and inhibition effects of metal ions on enzyme activity. Comp Biochem Physiol C Toxicol Pharmacol 2008;148:117–121.
- Coban TA, Senturk M, Ciftci M, Kufrevioglu OI. Effects of some metal ions on human erythrocyte glutathione reductase: An in vitro study. Protein Pept Lett 2007;14:1027–1030.
- Hunaiti AA, Soud M. Effect of lead concentration on the level of glutathione, glutathione S-transferase, reductase and peroxidase in human blood. Sci Total Environ 2000;248:45–50.
- Toribio F, Martínez-Lara E, Pascual P, López-Barea J. Methods for purification of glutathione peroxidase and related enzymes. J Chromatogr B, Biomed Appl 1996;684:77–97.
- Habig WH, Pabst MJ, Jakoby WB. Glutathione S-transferases. The first enzymatic step in mercapturic acid formation. J Biol Chem 1974;249:7130–7139.
- Bradford MM. A rapid and sensitive method for the quantitation of microgram quantities of protein utilizing the principle of protein-dye binding. Anal Biochem 1976;72;248–254.
- Laemmli DK. Cleavage of structural proteins during in assembly of the head of Bacteriophage T4. Nature 1970;227:680–685.
- Andrews P. The gel-filtration behaviour of proteins related to their molecular weights over a wide range. Biochem J 1965;96:595–606.
- Keha EE, Kufrevioglu OI. (2000). Biyokimya (Turkish). 2nd ed. Istanbul: Aktif Yayınevi, 338–349.
- Lineweaver H, Burk D. The determination of enzyme dissociation constants. J Am Chem Soc 1934;57:658–666.
- Almeida JA, Diniz YS, Marques SF, Faine LA, Ribas BO, Burneiko RC et al. The use of the oxidative stress responses as biomarkers in Nile tilapia (Oreochromis niloticus) exposed to in vivo cadmium contamination. Environ Int 2002;27:673–679.
- Ketterer B. Detoxication reactions of glutathione and glutathione transferases. Xenobiotica 1986;16:957–973.
- Vermeulen NPE. (1990). Analysis of mercapturic acids as a tool in biotransformation, biomonitoring and toxicological studies. Glutathione S-transferases and drug resistance. Vol. 1. London: Taylor and Francis, 141–153.
- Celik VK, Armutcu F, Aker A. Human placental glutathione-S-Transferase: Isolation, kinetic properties and in vitro interactions with several drugs. CU Tip Fakultesi Dergisi 2003;25:187–192.
- O’Hara J. Cadmium uptake by fiddler crabs exposed to temperature and salinity stress. J Fish Res Board Can 1973;30:846–848.
- Vitale AM, Monserrat JM, Castilho P, Rodriguez EM. Inhibitory effects of cadmium on carbonic anhydrase activity and ionic regulation of the estuarine crab Chasmagnathus granulata (Decapoda, Grapsidae). Comp Biochem Physiol C, Pharmacol Toxicol Endocrinol 1999;122:121–129.
- Ekinci D, Beydemir S, Küfrevioglu OI. In vitro inhibitory effects of some heavy metals on human erythrocyte carbonic anhydrases. J Enzyme Inhib Med Chem 2007;22:745–750.

![Figure 5. Activity – [K-phosphate] for determination optimal ionic strength of GST.](/cms/asset/234bfd2f-8e6c-434a-b5e7-2df0597023ff/ienz_a_729829_f0005_b.gif)
![Figure 10. Activity % vs [metal ions] regression analysis graphs for rainbow trout GST in the presence of 5 different (a) [Ag+] (b) [Cd2+] (c) [Cr2+] (d) [Mg2+] concentrations.](/cms/asset/1a3bac66-05d3-47b1-aa84-8a93d485b45f/ienz_a_729829_f0010_b.gif)
![Figure 11. Lineweaver-Burk graph with 5 different substrate (GSH) concentrations and 3 different (a) [Ag+] (b) [Cd2+] (c) [Cr2+] (d) [Mg2+] concentrations for determination of Ki.](/cms/asset/dd28db93-ba86-436f-8804-e2b5e81583a2/ienz_a_729829_f0011_b.gif)