
Abstract
Stochastic sensing was employed for pattern recognition of HER-1 in biological fluids. Nanostructured materials such as 5,10,15,20-tetraphenyl-21H,23H-porphyrin, maltodextrin and α-cyclodextrin were used to modify diamond paste for stochastic sensing of HER-1. Pattern recognition of HER-1 in biological fluids was performed in a linear concentration range between 5.60 × 10⁻¹¹ and 9.72 × 10⁻⁷ mg ml−1. The lower limits of determination (10−12 mg ml−1 magnitude order) were recorded when maltodextrin and α-cyclodextrin were used for stochastic sensing. The pattern recognition test of HER-1 in biological fluids samples shows high reliability for both qualitative and quantitative assay.
Introduction
HER-1 also known as epidermal growth factor receptor (EGFR) and ErbB-1 is a 170-kd receptor tyrosine kinases (TK), that dimerizes and phosphorylates several tyrosine residues upon binding of several specific ligands including epidermal growth factor and transforming growth factor alphaCitation1–5. The phosphorylated tyrosines serve as the binding sites for different signal transducers that initiate multiple signaling pathways resulting in cell proliferation, migration and metastasis, evasion from apoptosis or angiogenesis, all of which are associated with cancer phenotypesCitation1,Citation2. This biomarker, the first of four members of the ErbB familyCitation6, is overexpressed in many solid tumors, including non–small-cell lung cancer (NSCLC)Citation7–11. The efficiency of HER-1 inhibitors, together with favorable toxicity profiles, in preclinical models, had led to their utilization in treatment of NSCLC and other solid tumorsCitation12.
To date, HER-1 can be assayed using different techniques, including, enzyme linked immunosorbent assayCitation13, immunohistochemistry (IHC) and indirect immunofluorescenceCitation14, ELISA assayCitation15, fluorescenceCitation16 and electrochemical methodsCitation17.
The purpose of this work was to develop a method for pattern recognition of HER-1 in biological fluids samples using stochastic sensing. Diamond paste modified with nanostructured materials such as 5,10,15,20-tetraphenyl-21H,23H-porphyrin, maltodextrin and α-cyclodextrin was used for stochastic sensing. Although the costs of diamond and carbon pastes are comparable, we preferred the diamond paste because it can keep better the nanostructured material’s channels for stochastic sensing, and also the organic materials did not adsorb or absorb easily on its surface.
Materials and methods
Materials
HER-1, natural monocrystallin diamond powder [particle size 1 μm (99.9%)], maltodextrin (dextrose equivalent 4-7) (MD), 5,10,15,20-tetraphenyl-21H,23H-porphyrin (P), tetrahydrofuran (THF) were purchased from Aldrich (Milwaukee, WI); paraffin oil was purchased from Fluka (Buchs, Switzerland). α-Cyclodextrin (α-CD) was supplied by Wacher-Chemie GmbH (Germany). Titrisol buffer solution (pH = 7.4) were purchased from Merck. Deionized water obtained from a Millipore Direct-Q 3 System (Molsheim, France) was used for the preparation of all solutions. All standard solutions were prepared in buffer solution pH = 7.4 and deionized water mixed in a ratio of 1:1 ratio (v/v).
Design of stochastic sensors
The modified diamond pastes (DP) used in stochastic sensing were prepared as following: monocrystallin natural diamond powder was mixed with paraffin oil to form a paste. About 50-µl 10−3 mol l−1 solution of MD, α-CD (in water) and P (in THF) were added to obtain the modified pastes. The modified paste was placed into a plastic tube. The diameter of the sensors was ∼250 µm. Electric contact was obtained by inserting an Ag/AgCl wire into the modified paste. The surface of the sensors was wetted with deionized water and polished with alumina paper (polishing strips 30144-001, Orion) before using. When not in use, the sensors were stored in a dry state at room temperature.
Apparatus
A PGSTAT 12 and software Ecochemie (version 4.9, Utrecht, The Netherlands) were used for pattern recognition. A Pt electrode and an Ag/AgCl electrode served as the counter and reference electrodes in the cell. A Cyberscan PCD 6500 pH/mV-meter from Eutech Instruments (Landsmeer, The Netherlands) was employed for pH measurement.
Methods
Stochastic mode
A chronoamperometric technique was used for the measurements of ton and toff when a potential of 125 mV versus Ag/AgCl was applied. A Ag/AgCl (0.1 mol/l KCl) electrode served as reference electrode and a platinum electrode served as counter electrode. The electrodes were dipped into a cell containing standard solutions of different HER-1 concentrations (1 × 10⁻¹³–1 × 10⁻³ mg ml−1). Equations of calibration 1/ton = f(Conc.) are determined using statistics (linear regression equation). The unknown concentrations of HER-1 in biological fluid samples were determined, by inserting the value of 1/ton in the equation of calibration.
Results and discussion
Response characteristics of the sensors used in stochastic mode for pattern recognition of HER-1
Response characteristics of the stochastic sensors are shown in . The patterns obtained using stochastic mode can be used for the qualitative as well for quantitative analysis of HER-1Citation18. The signature of analyte is given by toff values () while the ton values are used for the quantitative assessment of the pattern (), and for the determination of the equation of calibration, sensitivity, linear concentration range and limit of quantification. The main principle of the method was described by Stefan-van Staden and Moldoveanu elsewhereCitation19: the current flowing through a channel under an applied potential is altered when the HER-1 is binding within the channel wall. There are two stages: stage 1 on which the HER-1 extracted from the solution into the membrane-solution interface is blocking the channel, the intensity of the current recorded being 0 for a certain period of time named signature of the analyte which is measured using toff; the channel is losing the conductivity. The value of toff is used for the qualitative assay of HER-1. When HER-1 is interacting with the wall of the channel (Stage 2), the following equilibrium equation is taking place:
where Ch is the channel and i is the interface. The time of equilibrium for interaction with the channel process is defined as ton and is used for the quantitative assay of HER-1. Therefore, stage 2 is known as bounding stage.
Figure 1. Examples of pattern recognition of HER-1 in whole blood samples using stochastic sensing based on (a) 5,10,15,20-tetraphenyl-21H,23H-porphyrin; (b) maltodextrin and (c) α-cyclodextrin.
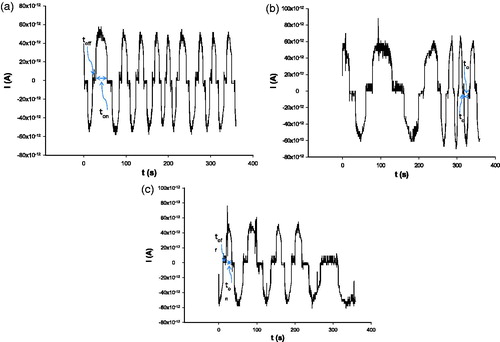
Table 1. Response characteristics of stochastic sensors used in pattern recognition of HER-1.
The pattern recognition of HER-1 can be performed on the linear concentration range between 5.60 × 10⁻¹¹ and 9.72 × 10⁻⁷ mg ml−1. The best response characteristic in terms of sensitivity and limit of quantification were recorded when pattern recognition was performed using the stochastic sensor based on α-CD (). The slopes of the sensors (sensitivities) were measured for 6 months, when RSD values were <0.1% – proving the stability of the sensors. The reproducibility of the design was proved by making 10 modified diamond pastes for each modifier (P, MD, α-CD) in 10 different days, and measuring the response characteristics of the microsensors; RSD(%) values <0.01% were recorded when compare the sensitivities (slopes) of the 10 microsensors for each modifier.
Selectivity studies were performed versus different biomarkers for cancer, neurotransmitters and genes. The selectivity studies refer to determination of the signatures of different analytes that can be found in whole blood samples together with HER-1. Taking into account the mechanism of current development, and that the signature (toff value) of a molecule is depending on different parameters: unfolding capacity, velocity of molecule movement through the pore/channel, size of molecule, it will be difficult to find two molecules with the same signature. Different values were obtained for the signatures (measured in seconds) of the following analytes when: (1) the sensor based on 5,10,15,20-tetraphenyl-21H,23H-porphyrin was used: ovarian tumor antigen (4.80), breast tumor antigen (3.95), gastrointestinal tumor antigen (3.60), prostate cancer antigen (6.90), carcinoembryo antigen (5.20), dopamine (5.7), epinephrine (7.7), norepinephrine (8.8), leptin (6.4); (2) the sensor based on maltodextrin was used: breast tumor antigen (3.3), HBVAg (1.9), d-pipecoloc acid (4.9), antigens of gastrointestinal, prostate and carcinoembryo tumors (<3.0) dopamine, epinephrine, norepinephrine (<2.0), leptin (3.9) and (3) the sensor based on α-cyclodextrin was used: HBVAg (2.9), antigens of the following tumors: ovarian, breast, gastrointestinal, prostate and carcinoembryo (<3). These values proved that the sensors are selective versus the substances for which the signatures (toff values were determined).
Analytical applications
Whole blood and peritoneal fluid samples were obtained from the Universitary Hospital in Bucharest (ethics committee approval nr. 11/2013), and they were used for screening without any pretreatment. Pattern recognition of HER-1 in biological fluids was recorded using the stochastic sensors (). The signature (toff value) of HER-1 was found in the patterns recorded () for biological fluids – these results being in agreement with the standard method (ELISA) performed in the clinical laboratories of the hospital. shows the quantities of HER-1 found in the biological fluids. Statistical analysis (pair t-test) shows that there is no significant difference between the values obtained using the three stochastic sensors at 99.00% confidence level (tteoretical = 4.032). The comparison refers to paired data.
Table 2. Pattern recognition of HER-1 in whole blood and peritoneal fluid using stochastic sensing.
ELISA was also employed as standard method to determine HER-1 in the same whole blood sample and in the peritoneal fluid. The results obtained using ELISA for the serum sample (1.20 × 10⁻⁷ mg/ml) obtained from the whole blood sample used in pattern recognition of HER-1 with stochastic sensors, and for the peritoneal fluid (9.25 × 10⁻⁷ mg/ml) correlated very good with those reported in for the stochastic sensors, proving the accuracy of the proposed method.
One can conclude that the pattern recognition of HER-1 in biological fluids can be reliably performed using stochastic sensing. The stochastic sensors proposed were reproducible as design and response characteristics. The best results were obtained using the stochastic sensor based on α-cyclodextrin was used. The screening can be performed in real time at low cost. No sample preparation is needed for the biological fluids.
Declaration of interest
The authors report no declaration of interest. This work was supported by PNII Program Capacity, 2012--2014, Contract nr. 3ERC-like/2012. Iuliana Moldoveanu acknowledge the support of the Sectorial Operational Programme Human Resources Development (SOP HRD), financed from the European Social Fund and the Romanian Government under the contract number POSDRU/159/1.5/S/137390/.
References
- Arteaga CL. Overview of epidermal growth factor receptor biology and its role as a therapeutic target in human neoplasia. Semin Oncol 2002;29:3–9
- Yang XO, Chen C, Peng CW, et al. Quantum dot-based quantitative immunofluorescence detection and spectrum analysis of epidermal growth factor receptor in breast cancer tissue arrays. Int J Nanomed 2011;6:2265–73
- Carpenter G, Cohen S. Epidermal growth factors. In: Litwack G, ed. Biochemical actions of hormones. New York: Academic Press; 1978:203–47
- Carpenter G, Cohen S. Epidermal growth factor. J Biol Chem 1990;265:7709–12
- Real FX, Rettig WJ, Chesa PG, et al. Expression of epidermal growth factor receptor in human cultured cells and tissues: relationship to cell lineage and stage of differentiation. Cancer Res 1986;46:4726–31
- Rossi A, Galetta D. Biomarkers for the targeted therapies of non-small cell lung cancer. Curr Biomarker Find 2012;2:7–17
- Fukuoka M, Yano S, Giaccone G, et al. A multi-institutional randomized phase II trial of gefitinib for previously treated patients with advanced non-small cell lung cancer. J Clin Oncol 2003;21:2237–46
- Kris MG, Natale RB, Herbst RS, et al. Efficacy of gefitinib, an inhibitor of the epidermal growth factor receptor tyrosine kinase, in symptomatic patients with non-small cell lung cancer: a randomized trial. JAMA 2003;290:2149–58
- Hendler FJ, Ozanne BW. Human squamous cell lung cancers express increased epidermal growth factor receptors. J Clin Investig 1984;74:647–52
- Cerny T, Barnes DM, Hasleton P, et al. Expression of epidermal growth factor receptor (EGFR) in human lung tumours. Br J Cancer 1986;54:265–9
- Veale D, Ashcroft T, Marsh C, et al. Epidermal growth factor receptors in non-small cell lung cancers. Br J Cancer 1987;55:513–16
- Akita RW, Sliwkowski MX. Preclinical studies with erlotinib (Tarceva). Semin Oncol 2003;30:15–24
- Chung KY, Shia J, Kemeny NE, et al. Cetuximab shows activity in colorectal cancer patients with tumors that do not express the epidermal growth factor receptor by immunohistochemistry. J Clin Oncol 2005;23:1803–10
- Korc M, Chandrasekar B, Yamanaka Y, et al. Overexpression of the epidermal growth factor receptor in human pancreatic cancer is associated with concomitant increases in the levels of epidermal growth factor and transforming growth factor alpha. J Clin Invest 1992;90:1352–60
- Gullick WJ, Marsden JJ, Whittle N, et al. Expression of epidermal growth factor receptors on human cervical, ovarian, and vulval carcinomas. Cancer Res 1986;46:285–92
- Haigler H, Asht JF, Singert SJ, Cohen S. Visualization by fluorescence of the binding and internalization of epidermal growth factor in human carcinoma cells A-431 (fluorescent growth factors/hormone receptors/endocytosis/immunofluorescence). Proc Natl Acad Sci USA 1978;75:3317–21
- Takahashi Y, Miyamoto T, Shiku H, et al. Electrochemical detection of epidermal growth factor receptors on a single living cell surface by scanning electrochemical microscopy. Anal Chem 2009;81:2785–90
- Bayley H, Cremer PS. Stochastic sensors inspired by biology. Nature 2001;413:226–30
- Stefan-van Staden RI, Moldoveanu I. Stochastic microsensors based on nanostructured materials used in the screening of whole blood for hepatitis B. J Electrochem Soc 2014;161:B3001–5