
Abstract
Falcipain-2 (FP-2) is a key cysteine protease from the malaria parasite Plasmodium falciparum. Many previous studies have identified FP-2 inhibitors; however, none has yet met the criteria for an antimalarial drug candidate. In this work, we assayed an in-house library of non-peptidic organic compounds, including (E)-chalcones, (E)-N’-benzylidene-benzohydrazides and alkyl-esters of gallic acid, and assessed the activity toward FP-2 and their mechanisms of inhibition. The (E)-chalcones 48, 54 and 66 showed the lowest IC50 values (8.5 ± 0.8 µM, 9.5 ± 0.2 µM and 4.9 ± 1.3 µM, respectively). The best inhibitor (compound 66) demonstrated non-competitive inhibition, and using mass spectrometry and fluorescence spectroscopy assays, we suggest a potential allosteric site for the interaction of this compound, located between the catalytic site and the hemoglobin binding arm in FP-2. We combined structural biology tools and mass spectrometry to characterize the inhibition mechanisms of novel compounds targeting FP-2.
Introduction
Malaria, a disease caused by Plasmodium falciparum, is one of the most serious infectious disease in the world, leading to about 627 000 deaths in 2012Citation1. A key factor contributing to the inability to control this disease is the resistance to nearly all available antimalarial drugsCitation1.
Erythrocytic P. falciparum parasites take up hemoglobin from erythrocyte cytosol and transport it to an acidic food vacuole, where it is hydrolyzed, and used as a source of amino acidsCitation2. Among the P. falciparum proteases that hydrolyze hemoglobin is the cysteine-protease falcipain-2 (FP-2)Citation3, which was shown to be responsible for 93% of the total hemoglobin proteolysis encountered in soluble trophozoite extractsCitation3,Citation4, being a key enzyme for the successful establishment of a P. falciparum infectionCitation5. Another P. falciparum cysteine protease, falcipain-3, is also a key hemoglobinase that is biochemically similar to FP-2, but it is active later than FP-2 along the life cycleCitation6.
Several studies have focused on FP-2 as a promising target for antimalarial chemotherapyCitation7,Citation8, and several classes of organic compounds have been identified as FP-2 inhibitors, including peptides, peptidomimetics, isoquinolines, thiosemicarbazones and chalconesCitation9, with both reversible and irreversible mechanisms of action. Despite the potency of some described inhibitors such as peptidyl vinyl sulfonesCitation10 and pyrimidine nitrilesCitation11, no compound has progressed through the drug discovery pipeline to the candidate stage. Nonetheless, FP-2 remains a promising target for antimalarial chemotherapy.
In this context, chalcones, benzohydrazides and alkyl-esters of gallic acid are of particular interest since these classes of compounds present a variety of biological activities. Chalcones are intermediate compounds in flavonoid biosynthesis presenting a benzalacetophenone fundamental coreCitation12, and benzohydrazides are compounds structurally related to them having the propanone group replaced by a hydrazide group. The alkyl esters of gallic acid are derived from the natural triphenol flavonoid gallic acid and are widely used in food and pharmaceutical industries as antioxidantsCitation13. Several reports have documented the properties of natural or synthesized chalcones, benzohydrazides and alkyl-esters of gallic acid, which include antitumoral, antiinflammatory, antimicrobial and antiviral, among other biological activitiesCitation14–19. Chalcones and benzohydrazides had already been studied as antimalarial compoundsCitation14–16 and as FP-2 inhibitorsCitation9.
In this work, we assayed an in-house library of non-peptidic organic compounds, including 82 (E)-chalcones, 17 (E)-N′-benzylidene-benzohydrazides and 11 alkyl-esters of gallic acid (), and assessed their activity toward FP-2 inhibition and their mechanism of action.
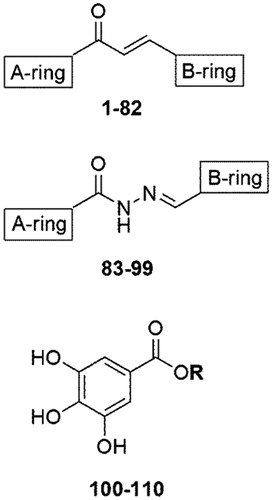
Figure 1. Generic chemical structure of the three classes of compounds assayed in this work: (E)-chalcones 1–82, (E)-N′-benzylidene-benzohydrazides 83–99, and alkyl-esters of gallic acid 100–110.
Materials and methods
Synthesis and purification of the compounds
The 110 assayed synthetic compounds (Table S1, Supplementary information), were prepared as described in our previous reportsCitation19–29. Reagents were obtained from Sigma-Aldrich® (St. Louis, MO) and solvents from Vetec (Duque de Caxias, RJ, Brazil).
The (E)-chalcones 1–82 were prepared by aldol condensation using methanol as solvent under basic conditions (KOH 50% w/v) at room temperature for 24 h. Distilled water and 10% hydrochloric acid were added to the reaction for total precipitation of the compounds, which were then obtained by vacuum filtration and later recrystallized in dichloromethane and hexaneCitation20–29.
The (E)-N′-benzylidene-benzohydrazides 83–99 were synthesized by condensation of the benzohydrazide (2 mmol) or 3,4,5-trimethoxy-benzohydrazide (2 mmol), with the appropriate aldehyde (2 mmol) in methanol (15 mL) and refluxed for 2 h. After cooling, the crude product was collected by filtration, washed and recrystallized from hot ethanol to give white solidsCitation20–29.
To obtain the alkyl-esters of gallic acid 100–110, gallic acid (5 mmol) and the corresponding alcohol (15 mmol) were mixed. The mixture was dissolved in toluene (70 mL) and sulfuric acid concentration (0.4 mL), heated for 8–12 h in reflux using Dean-Stark, and the solvent was removed under reduced pressure. Alternatively, the mixture was dissolved in dioxane (10 mL) and p-toluenesulfonic acid (0.3 mL), and heated for 2–4 h in bath oil under vacuum. All products were purified by column chromatographyCitation19.
The purity of the compounds was confirmed by melting point measurement (with a MGAPF-301 apparatus), infrared spectroscopy (in an Abb Bomen FTLA 2000 spectrometer on KBr disks; Zurich, Switzerland) and 1H and 13C nuclear magnetic resonance spectroscopy (on a Varian Oxford AS-400 400 MHz instrument; Agilent Technologies, Santa Clara, CA), as well as elementary analysis (carried out using a CHNS EA 1110). The chemical characterization of the three more active compounds is shown.
48 – (2E)-1-(3′-nitrophenyl)-3-(1,3-benzodioxol-5-yl)-2-propen-1-one. Brown solid, m.p. 144–146 °C; 1H NMR (CDCl3) δ 6.05 (s, 2H, –OCH2O–), 6.86 (d, 1H, J = 8.0 Hz, H5), 7.15 (d, 1H, J = 8.0 Hz, H6), 7.19 (s, 1H, H2), 7.36 (d, 1H, J = 15.2 Hz, Hα), 7.70 (m, 1H, H5′), 7.81 (d, 1H, J = 15.2 Hz, Hβ), 8.33 (d, 1H, J = 8.0 Hz, H6′), 8.43 (d, 1H, J = 8.0 Hz, H4′), 8.81 (s, 1H, H2′). 13C NMR (CDCl3) δ 102.1 (–OCH2O–), 107.0 (C2), 109.0 (C5), 118.8 (C6), 123.4 (Cα), 126.2 (C6′), 127.2 (C1), 129.0 (C4′), 130.1 (C5′), 134.3 (C2′), 139.9 (C1′), 146.9 (Cβ), 148.6 (C3′), 148.8-150.8 (C3, C4), 188.1 (C=O). IR νmax/cm–1 1661, 1211 (C=O), 1588 (C=C), 1248, 1036 (C–O), 1527, 1347, 850 (N=O), 3040, 2900, 1609, 1503, 1489, 1446, 1102, 927, 808, 700 (Ar) (KBr). Anal. Calcd for C16H11NO5: C 64.65; H 3.73; N 4.71; found: C 64.70; H 3.80; N 4.99. Yield = 40%.
54 – (2E)-1-(3′-nitrophenyl)-3-(2,4,5-trimethoxyphenyl)prop-2-en-1-one. Dark yellow solid, m.p. 161–162 °C; 1H NMR (400 MHz, DMSO-d6) δ 3.83 (s, 3H, o-OCH3), 3.89 (s, 3H, m-OCH3), 3.92 (s, 3H, p-OCH3), 6.77 (s, 1H, H3), 7.58 (s, 1H, H6), 7.84 (d, 1H, J = 16.0 Hz, Hα), 7.88 (t, 1H, J = 8.0 Hz, H5′), 8.16 (d, 1H, J = 16.0 Hz, Hβ), 8.49 (dd, 1H, J = 8.0/1.0 Hz, H6′), 8.61 (dd, 1H, J = 8.0/1.0 Hz, H4′), 8.77 (m, 1H, H2′); 13C NMR (100 MHz, DMSO-d6) δ 55.8 (o-OCH3), 56.3 (m,p-OCH3), 97.3 (C3), 111.0 (C1), 113.9 (C6), 117.7 (C2′), 122.5 (Cα), 126.9 (C4′), 130.4 (C5′), 134.5 (C6′), 139.2 (C1′), 139.9 (Cβ), 143.0 (C2), 148.1 (C3′), 153.4 (C5), 154.7 (C4), 187.1 (C=O). Anal. Calcd for C18H17NO6: C 62.97, H 4.99, N 4.08. Found: C 63.15, H 5.03, N 4.06. Yield = 83%.
66 – (2E)-1-(2′,4′,5′-trimethoxyphenyl)-3-[5-(2-chloro-5-trifluoromethyl-phenyl)-furan-2-yl]-2-propen-1-one. Gold yellow solid, m.p. 134–136 °C; 1H NMR (CDCl3) δ 3.91 (s, 3H, o-OCH3), 3.96 (s, 3H, m-OCH3), 3.99 (s, 3H, p-OCH3), 6.57 (s, 1H, H3′), 6.78 (d, 1H, J = 4.0 Hz, H5), 7.33 (d, 1H, J = 4.0 Hz, H4), 7.46 (s, 1H, H6′), 7.47 (dd, 1H, J = 8.0/1.0 Hz, H3″), 7.54 (d, 1H, J = 16.0 Hz, Hα), 7.59 (d, 1H, J = 8.0 Hz, H4″), 7.81 (d, 1H, J = 16.0 Hz, Hβ), 8.25 (s, 1H, H6″). 13C NMR (CDCl3) δ 56.2 (o-OCH3), 56.3 (m- and p-OCH3), 96.7 (C3′), 113.2 (C6′), 114.8 (C5), 117.0 (C4), 119.9 (C1′), 123.7 (CF3), 124.8 (C4″), 124.9 (C6″), 126.1 (Cα), 127.4 (C3″, C5″), 129.2 (C2″), 131.6 (Cβ), 133.8 (C1″), 143.4 (C5′), 149.9 (C1), 152.2 (C3), 154.0 (C2′), 155.3 (C4′), 188.5 (C=O). IR νmax/cm–1 1649, 1224 (C=O), 1585 (C=C), 1141 (C–Cl), 1265, 1027 (C–O), 1164 (C–F), 2954, 2844, 1610, 1515, 1466, 1402, 1333, 1110, 986, 899, 791, 678 (Ar) (KBr). Anal. Calcd for C23H18ClF3O5: C 59.17, H 3.89. Found: C 58.63, H 3.21. Yield = 92%.
Plasmid for expression of FP-2
Plasmid pTrcHis2A-35proFP2 containing the 875 bp FP-2 gene is described in the original report for FP-2 expressionCitation3, the construct was designed to include the catalytic domain of FP-2, 35 residues from N-terminal pro-domain and a 6xhis-tagCitation30.
Expression, purification and refolding of FP-2
A BL21-DE3 Escherichia coli colony harboring the pTrcHis2A-35proFP2 plasmid was transferred to a 10 mL Luria-Bertani (LB) medium tube containing 100 mg/mL ampicillin and grown overnight at 37 °C. Thereafter, 10 mL medium were transferred to a 250-mL flask containing LB medium with the same antibiotic concentration and grown at 37 °C until OD600 = 0.8 was reached. Isopropyl β-d-thiogalactoside 1 mM was used to induce bacterial expression, and maximal expression was achieved after four hours at 37 °CCitation30. Cells were harvested by centrifugation (5000 × g, 4 °C, 20 min), resuspended in cold buffer (100 mM Tris-HCl, EDTA 10 mM, pH 7.4) and disrupted by sonication (12 cycles, 10 s, 10 s rest). The homogenate was then centrifuged at 12 000 × g, 4 °C for 30 min. The pellet was washed once with cold buffer A (2.5 M urea, 20 mM Tris-HCl, 2.5% Triton X-100, pH 8.0), centrifuged at 17 000 × g, 4 °C for 30 min and solubilized in buffer B (6 M guanidine HCl, 20 mM Tris-HCl, 250 mM NaCl, 20 mM imidazole, pH 8.0) for 60 min. The suspension was centrifuged at 27 000 × g 4 °C for 30 min to remove all insoluble content. The supernatant was loaded on a Ni2+-NTA resin (Qiagen, Venlo, Netherlands) previously equilibrated with buffer (8 M urea, 30 mM imidazole, 20 mM Tris-HCl, pH 8.0). The resin was washed sequentially with the same buffer, containing 30, 60 and 100 mM imidazole. Finally, FP-2 was eluted with imidazole 1 M, and reduced with dithiothreitol (DTT) 10 mM at 37 °C for 45 min. Refolding was carried out in a buffer (100 mM Tris-HCl, 1 mM EDTA, 250 mM l-arginine, 30% glycerol, 1 mM reduced glutathione (GSH), 1 mM oxidized glutathione (GSSG), pH 9.0) with a 100-fold dilution of reduced FP-2 into 200 mL of the ice-cold buffer. Complete processing of the active form of FP-2 was achieved as previously describedCitation31.
Enzymatic assay for FP-2 inhibition
Stock solutions of the 110 synthesized compounds were prepared at 10 mM in 100% DMSO. Fluorimetric assays were performed in a buffer (100 mM NaOAc, 10 mM DTT, pH 5.5) using Z-FR-AMC (7-amino-4-methylcoumarin, N-CBZ-l-phenylalanyl-l-arginine amide) as a substrate. FP-2 (70 nM) was incubated for five minutes at room temperature with 50 µM of each of the 110 compounds before substrate addition. The AMC release after hydrolysis was monitored for one minute at room temperature in a fluorimeter (Cary Eclipse, Agilent©, Agilent Technologies, Santa Clara, CA) with excitation set to 355 nm and emission at 460 nm. All scans were corrected from the corresponding blanks, and controls (FP-2 + DMSO 2%, Z-FR-AMC + DMSO 2% and FP-2 + Z-FR-AMC + DMSO 2%). Compounds capable of inhibiting at least 85% of the FP-2 activity in the initial screening were selected to determine IC50 values. The experiments were done four times, and IC50 values were derived from plots of activity over at least six compound concentrations.
Kinetic assays
Compounds with IC50 values below 10 µM were selected to discriminate the mechanism of inhibition. Ki values were obtained from replots of KMapp or Vi over inhibitor concentration. At least three different concentrations of the selected inhibitors and seven concentrations of the substrate (1–64 µM) were used in the assays, which were repeated at least five times.
Mass spectrometry
Inhibitors with IC50 values below 10 µM were selected for mass spectrometry analyses. The experiments were done following the previously published methodologyCitation32 with minor changes. In a final reaction volume of 10 µL, approximately 1 µM FP-2 was incubated in the presence of the selected inhibitors (100 or 300 µM) in 100 mM NaOAc, 10 mM DTT, pH 5.5 for 5 min at room temperature (final DMSO concentration 2%). FP-2 was also incubated in the presence of the substrate and used as a control. Finally, 40 µL of 25 mM NH4HCO3, pH 8.0 were added to the reaction, followed by trypsin (10 ng/µL with a protease:protein ratio of 0.5:1.0 (w/w)) (Promega, Madison, WI). The reactions containing FP-2, selected inhibitors and trypsin were incubated at 37 °C for three hours with gentle stirring. After digestion, about 1 µL of each reaction was mixed with 9 µL of the matrix α-cyano-4-hydroxycinnamic acid (5 mg/mL) dissolved in 50% acetonitrile and 3% trifluoracetic acid, then, 1 µL of this mixture was spotted in triplicate in a MALDI MTP 384 target polished steel plate (Bruker Daltonics, Bremen, Germany). MS analysis was performed on a matrix-assisted laser desorption/ionization time-of-flight mass spectrometry (MALDI-TOF)/TOF spectrometer model Autoflex III (Bruker Daltonics) equipped with a 337 nm nitrogen laser (Smartbeam® 200 Hz) using an extracting voltage of 20 kV, ion gate 400 m/z, 4000 laser shots over a mass range from 800 to 4000 m/z. All experiments were done at least three times in the automated mode, and the spectra were processed using FlexAnalysis 3.3 sofware (Bruker Daltonics).
Fluorescence analyses
FP-2 (1 µM) was incubated in the presence of 100 µM of the selected inhibitors for 5 min in 100 mM NaOAc, 10 mM DTT, pH 5.5 at room temperature, in a quartz cuvette. The measurements were obtained in a JASCO J815 Spectropolarimeter (JASCO, Easton, MD) equipped with a fluorescence detection unit (FMO-427). Fluorescence excitation was set to 295 nm in order to excite only tryptophans, and the emission was scanned over the range from 320 to 500 nm. The assays were done in triplicate.
Molecular modeling
FP-2 models were constructed with the PyMOL Software version 1.5 (Delano Scientific LLC, Philadelphia, PA) using the PDB file 2GHUCitation33.
Results and discussion
Inhibition of FP-2 activity
An in-house library of 110 compounds, including 82 (E)-chalcones, 17 (E)-N′-benzylidene-benzohydrazides and 11 alkyl-esters of gallic acid, were screened against recombinant FP-2. In initial screening, 17 compounds inhibited FP-2 activity ≥85%, including 14 (E)-chalcones (2, 10, 23, 24, 34, 39, 43, 48, 54, 57, 66, 72, 76 and 79) and three alkyl-esters of gallic acid (104, 105 and 106) (Table S1, Supplementary information). These 17 compounds were selected to determine the IC50 values ().
Table 1. IC50 values of compounds active against recombinant falcipain-2.
The three alkyl-esters of gallic acid (104, 105 and 106) and (E)-chalcones (10, 23, 39, 57, 72, 76 and 79) slightly inhibited FP-2, with IC50 > 20 µM. Compounds 2, 24, 34 and 43 had modest activity (IC50 = 10–20 µM), and interestingly the (E)-chalcones 48, 54 and 66 were the most active compounds, with IC50 values below 10 µM.
Among the (E)-chalcones, inhibitor 66 (IC50 = 4.9 ± 1.3 µM) has a 2,4,5-trimethoxyphenyl group at A-ring position, and a 2-(2-chloro-5-(trifluoromethyl)phenyl)furan group as its B-ring. Switching the A-ring to a 2,5-dimethoxyphenyl group (compound 81) or a 3,4-methylenedioxyphenyl group (compound 44) led to a decrease in inhibitory activity (data not shown). Replacing the B-ring of compound 66 with a 3-chlorophenyl ring (compound 57, IC50 > 20 µM) also decreased inhibitory activity at least 4-fold.
Both the (E)-chalcones 48 (IC50 = 8.5 ± 0.8 µM) and 54 (IC50 = 9.5 ± 0.2 µM) showed similar inhibitory activity, and contain a 3-nitrophenyl group as the A-ring, and a 3,4-methylenedioxyphenyl or 2,4,5-trimethoxyphenyl group as the B-ring. The inhibitory activity was slightly reduced when the B-ring was changed to the 1-naphthyl group (compound 2, IC50 = 12.0 ± 2.1 µM) and reduced 2-fold when the B-ring was the 2-naphthyl group (compound 10, IC50 > 20 µM). When the rings of compound 48 (IC50 = 8.5 ± 0.8 µM) were inverted, forming compound 43 (IC50 = 14.8 ± 1.4 µM) with a 3-nitrophenyl group as B-ring, the inhibitory activity was reduced almost 50%. Similarly, the inversion of the rings of compound 54 (IC50 = 9.5 ± 0.2 µM), forming compound 64 with a 3-nitrophenyl group as B-ring, reduced the inhibitory activity considerably (data not shown). The inversion of the rings of compound 10 (IC50 > 20 µM), resulting in compound 24 (IC50 = 19.5 ± 1.5 µM) with a 3-nitrophenyl group as B-ring, did not change the activity. These data allow us to suggest that the 3-nitrophenyl group is well tolerated at the A-ring, and in the B-ring reduces the inhibitory activity.
When the 3,4-methylenedioxyphenyl group is the A-ring, compounds with a 3-nitrophenyl group (34, IC50 = 11.2 ± 0.3 µM) or a substituted furan (43, IC50 = 14.8 ± 1.4 µM) as B-ring showed decreased inhibition of FP-2. When the B-ring was replaced by a 2,4,5-trimethoxyphenyl group, the inhibitory activity was further reduced (39, IC50 > 20 µM). Still, compounds with the 3,4,5-trimethoxyphenyl group as A-ring showed slight inhibition of FP-2 (72 and 76, both with IC50 > 20 µM), even when the B-ring is a substituted furan (72) as that present in compound 34 (IC50 = 11.2 ± 0.3 µM). Compounds with chlorine atoms at the B-ring also showed low inhibitory activity when the A-ring was a 2,4,6-trimethoxyphenyl group (79, IC50 > 20 µM) or a 2-naphthyl group (23, IC50 > 20 µM).
Determination of the mechanism of FP-2 inhibition by selected compounds
The three most active compounds, the (E)-chalcones 48, 54 and 66, were used in kinetic analyses for elucidation of the mechanism of inhibition of FP-2, using different concentrations of Z-FR-AMC as substrate. Three different concentrations of each inhibitor were used to calculate the Ki values (10, 20 and 40 µM for compounds 48 and 54, and 5, 10 and 20 µM for compound 66). Interestingly, the Lineweaver–Burk double-reciprocal plots for these three compounds () displayed three different kinetic behaviors.
Figure 2. Lineweaver–Burk plots of the kinetic behavior of inhibitors 48, 54 and 66. The plots represent an average of at least five different experiments.
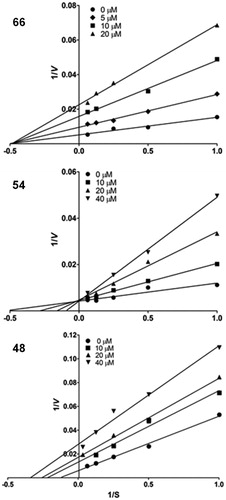
In the plot of compound 66 (), all lines converged at the x-axis (–1/KMapp), whereas the y-axis intercepts (1/Vmax app) varied as a function of the inhibitor concentration. The constant value of KMapp and the decreased values of Vmax proportional to increasing inhibitor concentrations indicated that this compound is a non-competitive inhibitor (α = 1), with a Ki value of 7.0 ± 2.2 µM.
In the plot of compound 54 (), all lines converged at the y-axis (1/Vmax), so Vmax remained constant. The slope (–KMapp/Vmax) and x-axis intercepts (–1/KMapp) varied with inhibitor concentration, and the Kmapp values increased with increasing inhibitor concentrations. These observations are consistent with a competitive mechanism, where the inhibitor competes with the substrate for binding to the free enzyme active site. The Ki value determined for compound 54 was 12.0 ± 1.8 µM.
In the plot of compound 48 (), the lines converged below the x-axis. Vmax app and KMapp decreased as a function of inhibitor concentration, but to different degrees. This mechanism is recognized as non-competitive (α < 1). The Ki value determined for compound 48 was 44.9 ± 5.95 µM.
Interaction of compounds 48, 54 and 66 with FP-2 analyzed by mass spectrometry
In order to investigate the mechanisms of FP-2 inhibition observed in the FP-2 kinetic experiments, further analysis of the interaction between FP-2 and compounds 48, 54 and 66 was done by MALDI-TOF/TOF mass spectrometry and trypsin protection assays. The peptide mass fingerprint (PMF) of FP-2 in the presence of the selected inhibitors at different concentrations was compared to the PMF without inhibitors, as well as in the presence of 50 µM substrate.
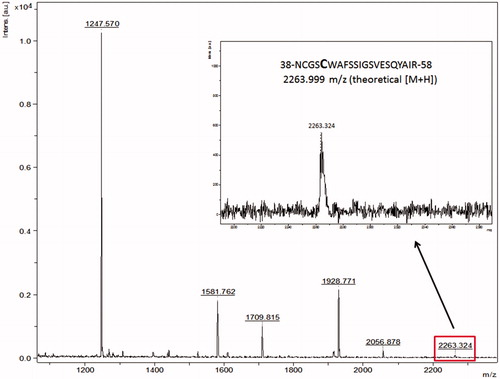
About 73% of the FP-2 primary structure was covered in the PMF (Figure S1, Supplementary information). shows a series of ions that correspond to peptides from FP-2 cleaved by trypsin. The inset indicates the peptide 38-NCGSCWAFSSIGSVESQYAIR-58 (m/z 2263.324), which contains the catalytic Cys42. This peptide covers a large part of the catalytic pocket (Figure S2, Supplementary information).
Figure 3. Peptide mass fingerprint of falcipain-2 with a coverage of 73%. Inset: peak m/z 2263.324 corresponds to the peptide-containing the catalytic Cys42. The spectrum represents a sum of 4000 lasers shots subtracted from the baseline.
The PMF of FP-2 in the presence of the substrate Z-FR-AMC was used as a control (Figure S3, Supplementary information). In the presence of the substrate, the peak m/z = 2263.324, which corresponds to the peptide-containing catalytic Cys42, was not found. This might be explained by the substrate occupying the catalytic pocket and, therefore protecting it from trypsin digestion. Spectra of all four replicates showed similar profiles.
We analyzed the PMF spectra of FP-2 in the presence of the most active inhibitors at the same experimental conditions (). Interestingly, the best inhibitor 66 (IC50 = 4.94 µM), which in the kinetics evaluations showed a non-competitive pattern (), failed to protect the catalytic pocket, as seen by the presence of the peptide-containing Cys42 (m/z 2263.376) in the spectrum (, panel B). Most likely inhibitor 66 interacts with another region of the FP-2 structure, consistent with its demonstrated non-competitive mechanism of inhibition.
Figure 4. Peptide mass fingerprint of falcipain-2 in the presence of the three best inhibitors. The arrows indicate the peptide-containing the catalytic Cys42, m/z 2263.324. Panels show falcipain-2 without inhibitors (A), in the presence of the non-competitive inhibitor 66 (B), in the presence of the competitive inhibitor 54 (C) and in the presence of the mixed-type inhibitor 48 (D). The spectrum represents a sum of 4000 lasers shots subtracted from the baseline.
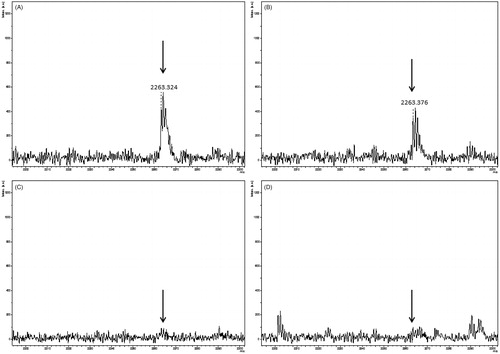
The PMF spectrum of 54 (IC50 = 9.47 µM) (, panel C) was very similar to that of FP-2 in the presence of the substrate Z-FR-AMC (Figure S3, Supplementary information). The peptide-containing Cys42 was absent, indicating that this inhibitor might interact with the catalytic pocket, consistent with its demonstrated competitive mechanism of inhibition ().
Inhibitor 48 (IC50 = 8.45 µM) exhibited a mixed-type inhibition in the kinetics experiments (). Its PMF spectra (, panel D) displayed a similar profile to that of compound 54 (, panel C).
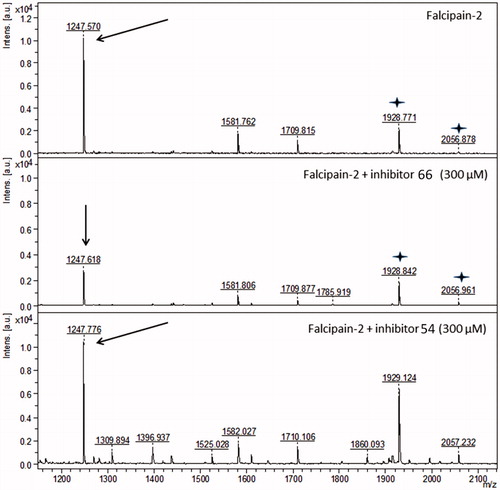
We also analyzed other peaks found in the PMF of inhibitors 54 and 66, compared with the control (PMF of FP-2; ). shows that peaks at m/z 1928.771 and 2056.878 were unaltered in the presence of the selected inhibitors. However, the peak which correspond to the peptide 204-NSWGQQWGER-213 (1247.719 m/z) decreased proportionally with increasing concentration of inhibitor 66, but it was not affected even with the highest concentrations of inhibitor 54 (300 µM) (, lower panel). This peptide is the first indication of a possible site of interaction for the inhibitor 66 with FP-2. This region is relatively far from both the catalytic site and the hemoglobin binding site (Figure S4, Supplementary information). Moreover, this peptide contains two tryptophan residues (206 and 210), which may be used to get insights about FP-2 tertiary structure, for example, by fluorescence analysis.
Figure 5. Peptide mass fingerprint of falcipain-2. The peak corresponding to the peptide 204-NSWGQQWGER-213 is labeled (m/z 1247.719, arrows). The panels show falcipain-2 in the absence of the inhibitors, in the presence of the non-competitive inhibitor 66, and in the presence of the competitive inhibitor 54. The spectra represents a sum of 4000 lasers shots subtracted from the baseline. Stars represent the peaks m/z 1928.771 and m/z 2056.878, which are not affected by inhibitor 66.
Analyses of compounds 48, 54 and 66 by fluorescence spectroscopy
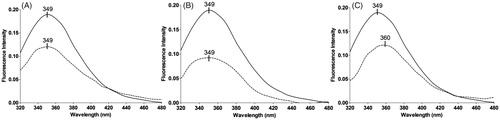
FP-2 has four tryptophan residues, two of them, apart from each other (23 and 43) and the other two, (206 and 210) structurally close. Using tryptophan intrinsic fluorescence analyses, we evaluated the effect of the selected inhibitors in the tryptophan microenvironment (). All three inhibitors (48, 54 and 66) decreased tryptophan fluorescence. However, only the non-competitive inhibitor 66 induced a bathochromic shift of 11 nm in the tryptophan maximum emission. This shift may represent a disruption in the tryptophan microenvironment and possibly an overall conformational change. This data indicate that the most active inhibitor 66, acting via a non-competitive inhibition mechanism may interact with a potential allosteric site, which might be represented by the surroundings of peptide 1247.719 m/z ( and S4). This interaction most likely leads to a conformational change in FP-2, resulting in the loss of activity.
Figure 6. Intrinsic tryptophan fluorescence of falcipain-2 in the absence (solid line) and in the presence (dashed line) of the three best inhibitors: compound 48 (A), compound 54 (B) and compound 66 (C). Spectra represent a mean of three scans from two different experiments.
Conclusions
In this work, we used both structural biology tools and mass spectrometry to propose inhibition mechanisms of new compounds targeting FP-2. The best three inhibitors were (E)-chalcones, and presented good IC50 values (4.9–8.5 µM), and different kinetic mechanisms for FP-2 inhibition: competitive (compound 54), non-competitive with α = 1 (compound 66) and non-competitive with α < 1 (compound 48). Using mass spectrometry, we were able to depict a potential allosteric site where compound 66 binds, located between the catalytic site, and the hemoglobin binding arm in FP-2. Fluorescence data also revealed that compound 66 was responsible for modifications in a particular tryptophan microenvironment leading to a conformational change, which seems consistent with an allosteric inhibitor interaction. We used a combined enzyme kinetic analysis, fluorescence spectroscopy and mass spectrometry to determine inhibition mechanisms for novel FP-2 inhibitors. The (E)-chalcones 66, 54 and 48, containing a new chemical scaffold for FP-2 inhibition, are attractive lead compounds for further optimization.
Declaration of interest
We thank CNPq and CAPES for financial support.
Supplementary material available online
SUPPLEMENTAL
Download PDF (659.1 KB)Acknowledgements
We thank Taisa Regina Stumpf for technical support in some of the chemical synthesis.
References
- WHO, World Malaria Report [Online]. 2013. Available from: http://www.who.int/malaria/publications/world_malaria_report_2013/wmr2013_no_profiles.pdf?ua=1 [last accessed 18 Feb 2014]
- Olliaro PL, Yuthavong Y. An Overview of chemotherapeutic targets for antimalarial drug discovery. Pharmacol Ther 1999;81:91–110
- Shenai BR, Sijwali PS, Singh A, Rosenthal PJ. Characterization of native and recombinant falcipain-2, a principal trophozoite cysteine protease and essential hemoglobinase of Plasmodium falciparum. J Biol Chem 2000;275:29000–10
- Shenai BR, Rosenthal PJ. Reducing requirements for hemoglobin hydrolysis by Plasmodium falciparum cysteine proteases. Mol Biochem Parasitol 2002;122:99–104
- Sijwali PS, Rosenthal PJ. Gene disruption confirms a critical role for the cysteine protease falcipain-2 in hemoglobin hydrolysis by Plasmodium falciparum. Proc Natl Acad Sci USA 2004;101:4384–9
- Sijwali PS, Shenai BR, Gut J, et al. Expression and characterization of the Plasmodium falciparum haemoglobinase falcipain-3. Biochem J 2001;360:481–9
- Marques AA, Esser D, Rosenthal PJ, et al. Falcipain-2 inhibition by suramin and suramin analogues. Biorg Med Chem 2013;21:3667–73
- Pérez B, Gomes JRB, Gomes P. Development of Plasmodium falciparum protease inhibitors in the past decade (2002–2012). Curr Med Chem 2013;20:3049–68
- Ettari R, Bova F, Zappalà M, et al. Falcipain-2 inhibitors. Med Res Rev 2010;30:136–67
- Shenai BR, Lee BJ, Alvarez-Hernandez A, et al. Structure-activity relationships for inhibition of cysteine protease activity and development of Plasmodium falciparum by peptidyl vinyl sulfones. Antimicrob Agents Chemother 2003;47:154–60
- Coterón JM, Catterick D, Castro J, et al. Falcipain inhibitors: optimization studies of the 2-pyrimidinecarbonitrile lead series. J Med Chem 2010;53:6129–52
- Dewick PM. Medicinal natural products: a biosinthetic approach. Cichestes: John Wiley & Sons; 1997:136–7
- Ow YY, Stupans I. Gallic acid and gallic acid derivatives: effects on drug metabolizing enzymes. Curr Drug Metab 2003;4:241–8
- Nowakowska ZA. A review of anti-infective and anti-inflammatory chalcones. Eur J Med Chem 2007;42:125–37
- Ni L, Meng CQ, Sikorski JA. Recent advances in therapeutic chalcones. Expert Opin Ther Pat 2004;14:1669–91
- Rollas S, Küçükgüzel SG. Biological activities of hydrazone derivatives. Molecules 2007;12:1910–39
- Locatelli C, Filippin-Monteiro FB, Creczynski-Pasa TB. Alkyl esters of gallic acid as anticancer agents: a review. Eur J Med Chem 2013;60:233–9
- Kubo I, Xiao P, Fujita K. Anti-MRSA activity of alkyl gallates. Bioorg Med Chem Lett 2002;12:113–16
- Savi LA, Leal PC, Vieira TO, et al. Evaluation of anti-herpetic and antioxidant activities, and cytotoxic and genotoxic effects of synthetic alkyl-esters of gallic acid. Arzneimittelforschung 2005;55:66–75
- Borchhardt DM, Mascarello A, Chiaradia LD, et al. Biochemical evaluation of a series of synthetic chalcone and hydrazide derivatives as novel inhibitors of cruzain from Trypanosoma cruzi. J Braz Chem Soc 2010;21:142–50
- Chiaradia LD, Mascarello A, Purificação M, et al. Synthetic chalcones as efficient inhibitors of Mycobacterium tuberculosis protein tyrosine phosphatase PtpA. Biorg Med Chem Lett 2008;18:6227–30
- Bello ML, Chiaradia LD, Dias LRS, et al. Trimethoxy-chalcone derivatives inhibit growth of Leishmania braziliensis: synthesis, biological evaluation, molecular modeling and structure–activity relationship (SAR). Biorg Med Chem 2011;19:5046–52
- Chiaradia LD, Martins PGA, Cordeiro MNS, et al. Synthesis, biological evaluation, and molecular modeling of chalcone derivatives as potent inhibitors of Mycobacterium tuberculosis protein tyrosine phosphatases (PtpA and PtpB). J Med Chem 2012;55:390–402
- Salum LB, Altei WF, Chiaradia LD, et al. Cytotoxic 3,4,5-trimethoxychalcones as mitotic arresters and cell migration inhibitors. Eur J Med Chem 2013;63:501–10
- Osório TM, Delle Monache F, Chiaradia LD, et al. Antibacterial activity of chalcones, hydrazones and oxadiazoles against methicillin-resistant Staphylococcus aureus. Bioorg Med Chem Lett 2012;22:225–30
- Mascarello A, Nunes RJ, Yunes RA, et al. Compostos acil-hidrazonas e oxadiazóis, composições farmacêuticas compreendendo os mesmos e seus usos, Patent WO 2013/075199 A1; 2013
- Nunes AS, Campos VP, Mascarello A, et al. Activity of chalcones derived from 2,4,5-trimethoxybenzaldehyde against Meloidogyne exigua and in silico interaction of one chalcone with a putative caffeic acid 3-O-methyltransferase from Meloidogyne incognita. Exp Parasitology 2013;135:661–8
- Ferreira NC, Marques IA, Conceição WA, et al. Anti-prion activity of a panel of aromatic chemical compounds: in vitro and in silico approaches. PLoS One 2014;9:e84531
- Stumpf TR. Síntese de 2,4,5-trimetoxichalconas e avaliação de sua Atividade frente à proteína tirosina fosfatase a (PtpA) de Mycobacterium tuberculosis. Available from: https://repositorio.ufsc.br/xmlui/handle/123456789/96776 [last accessed 18 Feb 2014]
- Sarduy ES, Muñoz AC, Trejo SA, Chavéz Planes MDLA. High-level expression of falcipain-2 in Escherichia coli by codon optimization and auto-induction. Protein Expr Purif 2012;83:59–69
- Sijwali PS, Brinen LS, Rosenthal PJ. Systematic optimization of expression and refolding of the Plasmodium falciparum cysteine protease falcipain-2. Protein Expr Purif 2001;22:128–34
- Mascarello A, Mori M, Chiaradia-Delatorre LD, et al. Discovery of Mycobacterium tuberculosis protein tyrosine phosphatase B (PtpB) inhibitors from natural products. PLoS One 2013;8:e77081
- Hogg T, Nagarajan K, Herzberg S, et al. Structural and functional characterization of falcipain-2, a hemoglobinase from the malarial Parasite Plasmodium falciparum. J Biol Chem 2006;281:25425–37