
Abstract
The dopamine hypothesis states that decreased dopaminergic neurotransmission reduces schizophrenia symptoms. Neurokinin-3 receptor (NK3) antagonists reduce dopamine release and have shown positive effects in pre-clinical and clinical trials. We employed 2D and 3D-QSAR analysis on a series of 40 non-peptide NK3 antagonists. Multivariate statistical analysis, PCA and HCA, were performed to rational training/test set splitting and PLS regression was employed to construct all QSAR models. We constructed one highly predictive CoMFA model (q2 = 0.810 and r2 = 0.929) and acceptable HQSAR and CoMSIA models (HQSAR q2 = 0.644 and r2 = 0.910; CoMSIA q2 = 0.691, r2 = 0.911). The three different techniques provided convergent physicochemical results. All models indicate cyclopropane, piperidine and di-chloro-phenyl ring attached to cyclopropane ring and also the amide group attached to the piperidine ring could play an important role in ligand–receptor interactions. These findings may contribute to develop potential NK3 receptor antagonists for schizophrenia.
Introduction
Schizophrenia is a psychotic disorder that affects 24 million people around the world, with a major peak of appearance between 15 and 35 years of ageCitation1. The most accepted theory for schizophrenia is the dopamine hypothesis, which states that the disorder results from increased dopaminergic neurotransmission. According to this view, pharmacological approaches that decrease dopaminergic neurotransmission in the brain should alleviate psychotic symptomsCitation2,Citation3. Therefore, all drugs currently employed to treat schizophrenia act, to some extent, on dopamine receptors, mainly as antagonists of D2-type receptors. However, antagonism of D2 receptors in the nigrostriatal pathway is responsible for severe side effects of antipsychotics, such as Parkinsonism, acute dystonias, akathisia, and tardive dyskinesiaCitation3.
In the search for molecules with better side-effect profiles, neurokinin-3 receptor (NK3) has been investigated as a new target for schizophrenia. Stimulation of this receptor is known to increase dopamine release and, therefore, binding of antagonists may decrease dopaminergic neurotransmission without interfering with dopamine receptorsCitation2,Citation3. Neurokinin receptors are G protein-coupled receptors (GPCRs) activated by neurokinins, peptides from the tachykinin family, which includes substance P, neurokinin A and neurokinin B. NK3 receptor is mainly activated by neurokinin B. The exact distribution of this receptor in the brain is still unknown, but it seems to be found predominantly in cortical regions such as the frontal and parietal cortex, and also in the hippocampusCitation3–5. Data from pre-clinical and clinical trials of non-peptide NK3 antagonists used to treat schizophrenia have shown positive effects, with significant reduction of symptoms and lack of major side effectsCitation3,Citation6–8.
Of the many available drug design strategies, quantitative structure–activity relationship (QSAR) models are widely employed due their advantages, such as the ability of mathematical models to predict the biological activity of untested compounds, providing physicochemical insights into molecular optimization (for example, the influence of certain substituent or molecular properties on the biological activity, ligand–target interactions, etc.)Citation8–14. To this date, there are few quantitative structure and activity relationship studies for NK3 antagonistsCitation15,Citation16; therefore, there is a lack of information in this research field.
Here, we constructed QSAR models employing molecular hologram quantitative structure activity relationship (HQSAR) as a 2D-QSAR approach, comparative molecular fields analysis (CoMFA) and comparative molecular similarity indices analysis (CoMSIA) as 3D-QSAR approaches. The models presented good convergence towards physichochemical properties influencing activity. Significant information was extracted regarding structure–activity relationships, contributing to define important structural features for NK3 antagonism to be used in the discovery of novel antipsychotic drugs. Furthermore, the compounds studied in this work showed high affinity to NK3 receptors at nanomolar range and some compounds also presented good balance between binding affinity and pharmacokinetics profile related to CNS effectsCitation4. Therefore, the constructed QSAR models highlight the main physicochemical properties related to NK3 antagonism of a promising drug candidates series.
Material and methods
Biological data, molecular alignment and descriptors calculations
The data set contains 40 NK3 receptor inhibitors () synthesized and in vitro evaluated (Ki) by Juhl et al.Citation4. The pKi values (−log Ki) were used as the dependent variable in the QSAR models, spanning approximately three logarithmic unities. Visual inspection demonstrated that pKi values are bimodally distributed, with an adequate number of compounds with low, moderate, and high pKi values.
Table 1. 2D structure of data set compounds with its Ki and pKi values.
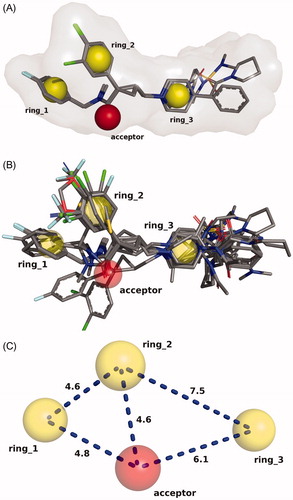
The 3D molecular structures were constructed with Marvin SketchCitation17, which was also used to calculate molecular and structural descriptors. Each structure was further refined using the OMEGA 2 softwareCitation18,Citation19, which employs the Merck molecular force fieldCitation20 for conformational analysis by systematic search in order to generate 50 minimum energy conformers. The molecular alignment, a necessary step for 3D-QSAR calculations of molecular interaction fields (MIFs) and similarity indices, was performed using ROCs software (OpenEye Scientific Software, Inc., Santa Fe, NM) ()Citation21,Citation22. In this step, we considered the three most active compounds as a template to the molecular alignment which was performed using a chemical similarity score (linear combination of Tanimoto indices for 3D shape and chemical features, ).
Figure 1. (A) Molecular alignment of the three most active compounds. Rings 1, 2, 3 and the carbonyl oxygen (acceptor) were used as superimposition sites as well as its 3D shapes. (B) Molecular alignment of all 40 studied compounds. (C) Chemical feature sites were employed as the template for the molecular alignment (distances are shown in Å).
After the generation of conformers by molecular alignment, partial atomic charges were calculated employing the PM3 semi-empiric methodCitation23,Citation24 with MOPAC software. Polar surface area (PSA) and charged partial surface area (CPSA) descriptors, atoms, fragment and ring counts, ClogP, molecular volume, and molecular surface area were calculated with SYBYL-X 2.1.1Citation25; molecular orbital energies (HOMO and LUMO) were calculated using the Hartree–Fock/6-31G(d,p) methodCitation26 with Gaussian 03WCitation27; ClogD at pH 1.5, 5.0, 6.5, and 7.4, molecular refractivity, molecular polarizability, and topological indices were calculated with Marvin BeansCitation17. These descriptors made up the matrix X and were used in the hierarchical cluster analysis (HCA) and principal component analysis (PCA).
Data set division
The test set should be representative of the total data set with respect to the molecular structure and biological activity. To this end, HCA and PCA were performed using the Pirouette 3.11 software (Infometrix Inc., Bothell, WA)Citation28 in order to explore similarities between the samples (compounds) and guide to the selection of molecules for the test set. HCA considers the complete-linkage clustering method and Euclidean distance to calculate similarities between samples and variables. EquationEquation (1)(1) was used to calculate the distances between the samples:
(1)
The multivariate distance dkl between the sample vectors, k and l, is calculated taking into account the numeric differences in all the m variables. M represents the order of the Euclidian distance (M = 2). Once all intersample distances are calculated, the values are organized in a matrix made of similarity indices (similarity kl = 1 – dkl/dmax, where dmax is the maximum distance in the data set). The similarity indices span from zero (dissimilar samples) to one (identical samples), and the larger the similarity index value is, the more similar the species areCitation29. The results can be seen as dendrograms (see “Results and discussion” section) and highlights samples agglomeration into clusters. Ideally, one should choose few compounds from each cluster to comprise the test set.
In PCA, the variables are rearranged in principal components (PCs) in such a way that each PC accounts for most of the variability of the data set. The first PC (PC1) is defined taking into account the maximum variability of the data set. Each succeeding PC is taken orthogonally to PC1 and describes the highest possible remaining variability.
After data transformation, just few PCs are necessary to explain the most relevant information contained in the whole data set. The original data matrix X (I × J, where I corresponds to the molecules and J is the number of descriptors), is decomposed in two new matrices, T and L, in such a way that X = TLT. T is the scores matrix and represents the position (classification) of the compounds on system defined by the PCs. The scores matrix holds important information about the relationships between samples, their similarities and differences, as well as how samples are distributed across the PCs. L is the loadings matrix and describes the weight by which variable should be multiplied to obtain the each component score. In other words, L specifies how the PCs are obtained on the basis of the original variablesCitation30,Citation31. In this study, PCA was run up to eight factors.
QSAR models
All QSAR models were constructed with SYBYL-X 2.1.1 package (Tripos, St. Louis, MO)Citation24 employing partial least squares (PLS) regression technique. Various HQSAR, CoMFA, and CoMSIA models were initially constructed and selected according to their robustness, measured as the leave-one-out (LOO) internal validation regression coefficient (q2) and predictive power, measured through external validation coefficients and its error ( and RMSEP). Next, leave-N-out tests were conducted in triplicate in each of the best HQSAR, CoMFA, and CoMSIA models, leaving 5–30 cross-validation groups out of training set in internal validation. This approach was adopted to verify how the robustness of each model varied according to the size and the composition of the training set. Finally, external validation was carried out using a test set of seven compounds, which were not included in QSAR model development. The predictive ability of the models was evaluated by the residual of the predicted pKi values and the external validation coefficient (
)Citation32. The best-validated QSAR models were used to generate contribution and contour maps for the data set compounds, as well as mutually corroborating physicochemical information. All validation coefficients were evaluated according to acceptable reference valuesCitation9,Citation11,Citation32. Our strategy was based on many works which combine different QSAR methods in the drug designCitation33–38.
HQSAR
HQSAR is a 2D-QSAR method that employs molecular fingerprints to generate models correlating activity with structural featuresCitation39. Molecules are broken down into fragments which are used to generate molecular holograms related to biological data. First, we fixed the fragment size (4–7 atoms), used the 12 default series of hologram length and evaluated the influence of fragment distinction [atomic type (A), bonds (B), connections (C), hydrogen atoms (H), chirality (Ch), and H-bond donor/acceptor atoms (DA)]. Then, we used the best obtained models, fixed the fragment distinction and evaluated the influence of fragment size in models. First, HQSAR models were generated with the training set ranging the parameters that affect hologram generation. The fragment distinction combinations used were the following: A/B, A/C, A/B/C, A/B/H, A/C/DA, A/C/Ch, A/B/C/H, A/C/H/Ch, A/C/Ch/DA, and A/B/C/H/Ch. In all combinations, we tested all options of hologram lengths (53, 59, 61, 71, 83, 97, 151, 199, 257, 307, 353, and 401). For the best models, the fragment size was varied in length (2–5, 3–6, 5–8, and 6–9) to improve statistical significance.
CoMFA and CoMSIA
CoMFA and CoMSIA descriptors were calculated after molecular alignment, described in Biological data, molecular alignment and descriptors calculations section. In CoMFA, electrostatic and steric energy field descriptors were calculated in each grid point (2 Å) of a cubic box using a sp3 hybridized carbon probe with a charge of + 1.0 and 1.52 Å van der Waals radius. The interactions were calculated with the Tripos force fieldCitation40 with an energy cut-off of 30 kcal/mol. CoMSIA similarity indices descriptors (steric, electrostatic, hydrophobic, H-bond donor, and H-bond acceptors) were obtained for each point of the grid box using the same probe as in the CoMFA analysis. In order to obtain better CoMFA and CoMSIA models, we employed focus strategy which consists of combining the two follow variations: (i) to focus of fields varying the distance of each point at 3D grid from 1 to 4 Å multiplying the original value by a distance factor (d) and (ii) to apply a standard deviation weight factor (w) from 0.3 to 0.7.
Results and discussion
Variable selection and data set division
After descriptor calculation, the initial X matrix contained 63 descriptors (independent variables) plus the pKi values (dependent variable) and 40 compounds. The list of all 63 calculated descriptors is available at Supplementary Table 1. Visual inspection of the plots of each independent variable versus pKi was used as a first filter to exclude invariant descriptors, since they do not contribute to explain the variability of the biological activity. Next, we employed HCA recurrently to identify pairs of descriptors with over 85% of correlation between themselves. The decision of what descriptor should be included in the final model was made assisted by the loading values. We decided to exclude variables with low absolute loading values, since they contribute to a lesser degree to the PCA axis formation. Moreover, variables with similar absolute loading values but opposite signals were not considered because they do not significantly contribute to the new PCA axes. We selected the X variables in order to represent the descriptors with the same nature of the employed ones in HQSAR (constitutional), CoMFA (steric and electrostatic), and CoMSIA (electrostatic and hydrophobic) model construction.
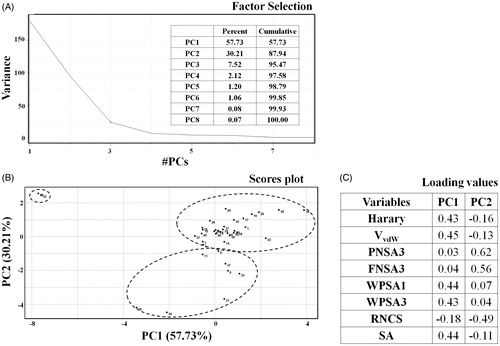
After the elimination of redundant information, the final matrix contained eight variables. The first two PCs were sufficient to explain almost 88% of the original data variance. The scores plot shows samples (compounds) disposition and values on PC1 and PC2, separated in dashed circles. The loading chart shows the contribution of each descriptor for each PC (). Steric and topological descriptors (Harary_index, van der Waals volume, and Surface_Area) have greater absolute loading values on PC1. Descriptors related to partial positive charge distribution (WPSA1 and WPSA3) have greater contribution on PC1, while descriptors related to partial negative charge distribution (PNSA3, FNSA3 and RNCS) have greater contribution on PC2.
Figure 2. PCA findings for the studied data set. (A) Factor selection, (B) scores plot, and (C) loadings values.
HCA findings further clarify and support PCA pattern separation, seen as a dendrogram. At 50% of similarity index (solid line in Supplementary Figure 1), three clusters were formed. Molecules from each group were selected based on the shared similarity index (Si) with other molecules. This way, we ensured that the test set comprised representatives of the total data set. The following compounds were chosen: 34 (94% of Si with 21); 35 (97% of Si with 4); 36 (98% Si with 10); 37 (95% Si with 5); 38 (98% Si with 12 and 2); 39 (90% Si with 18); and 40 (94% Si with 27). Moreover, the test set pKi values also represent the distribution of the original data, ranging from 5.4 (6) to 7.5 (25).
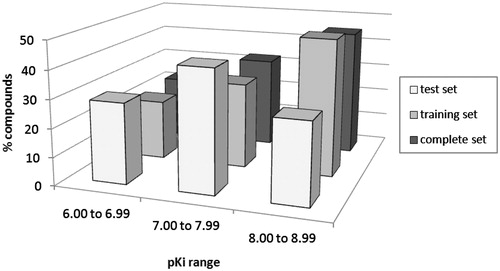
All test set has a similar distribution according to its pKi range values in comparison with training and complete set (). The PCA and HCA findings support that all test set compounds have physicochemical similarity to train set ones at the two main found clusters. These results also corroborates the PC1 versus PC2 plots of HQSAR, CoMFA and CoMSIA models (Supplementary Figure 2) which indicates that all test set compounds were inside the chemical spaces employed to QSAR models construction and, therefore, test set was suitable to external validation performing.
Figure 3. Distribution of test, training, and complete sets compounds according to pKi range.
QSAR models
From the molecular alignment (), we can note that all compounds are within the spatial restrictions of the chemical features. In particular, the cyclopropane ring at the center of all compounds is well aligned. Due to the high flexibility and stereochemistry of some compounds, it is expected that some groups seem to be unaligned. displays the distances in Å between each chemical feature site.
HQSAR model
After screening all constructed models with different fragment distinction, the three best models were 29, 41, and 42, according to the statistical results obtained from PLS analysis (). Model 29 resulted from the combination of A, B, and H fragment distinctions; models 41 and 42 resulted from the combination of A, B, C, and H. We observed that H atoms are important to describe NK3 inhibition since the addition this parameter increases q2, as it is observed in models 1 (A/B, q2 = 0.596) and 10 (A/B/H, q2 = 0.610); 2 (A/B/C, q2 = 0.566), and 3 (A/B/C/H, q2 = 0.587); and 8 (A/C/Ch, q2 = 0.594) and 7 (A/C/H/Ch, q2 = 0.611).
Table 2. Statistical parameters analysis of the three bests HQSAR models using fragment size default (4–7).
The fragment size controls the minimum and maximum lengths of each fragments encoded in the hologram fingerprintCitation39. We varied the size of the three best models to improve statistical parameters (Supplementary Table 3). The best model is shaded in light gray. Model 42 used fragment size 2–5 and showed acceptable statistical parameters (q2 = 0.644 and r2 = 0.910), indicating internal consistency. Moreover, the difference between r2 and q2 is less than 0.30 suggesting that the data are not overfitted. Our model shows that atom types, bonds, connections, hydrogen atoms, and chirality are essential molecular features for NK3 inhibition.
For model 42, we carried out LNO tests on six different cross-validation groups, in triplicate (Supplementary Figure 3). The results indicate that all LNO cross-validation runs achieved q2 values superior to 0.60, which indicates the robustness of our model.
CoMFA model
CoMFA models were generated for the training set based on the molecular alignment. After varying the grid distance and the weight factor, the model with the highest q2 value was selected. The best model was generated using a grid distance of 2 Å and a weight factor of 0.50. A statistical comparison between the best CoMFA models is shown in . Other generated CoMFA models are shown in Supplementary Table 4. Field contribution percentages of the best model show that steric and electrostatic parameters are important to define molecular activity, the latter being more significant (64.1%).
Table 3. Statistical data of the best CoMFA models.
LOO validation showed that our CoMFA model has internal consistency, with q2 higher than 0.70 (0.810) and SEV lower than 0.50 (0.351). LNO internal validation was performed with six different group sizes, varying from 5 to 30. All the q2 values were higher than 0.60 (Supplementary Figure 3), emphasizing the consistency of the chosen CoMFA model.
CoMSIA model
CoMSIA model was also generated after molecular alignment using training set for all possible combinations of the five similarity fields (steric, electrostatic, hydrophobic, H-bond donor, and H-bond acceptor). After varying the grid distance and the application of weight factors of the two best non-focused models, the model with the highest q2, and lowest RMSEP was selected. The best final model had contributions of steric, electrostatic, hydrophobic, H-bond donor, and H-bond acceptor similarity fields and was generated with a grid distance of 2 Å (d = 1.0) and a standard error weight factor of 0.3. It is important to note that the model generated with a grid distance of 1 Å is statistically equivalent to the chosen model; nonetheless our choice was based on the lowest number of employed grid points. The statistical results of the two best models and the final CoMSIA model are shown in . The best CoMSIA models obtained with the best two field distinctions and also all models constructed with focus strategy are shown in Supplementary Tables 5 and 6.
Table 4. Statistical data of the best CoMSIA models.
On one hand, field contribution percentages of the selected models demonstrate that the steric differences between the molecules are less important to describe the activity. On the other hand, electrostatic characteristics are the most significant feature to describe the molecular activity of our CoMSIA model, since this field weight is 31.7%.
The CoMSIA model LOO validation showed q2 of 0.691 and SEV of 0.426, indicating its acceptancy. The LNO internal validation was performed with six different group sizes, varying from 5 to 30. All the q2 values were also higher than 0.60 (Supplementary Figure 3), reflecting the consistency of the obtained CoMSIA model.
QSAR models external validation
The predictive power of the three best QSAR models was tested by predicting the pKi values of the test set compounds, which were not included during the construction of the models (). The plot in shows experimental versus predicted activities.
Figure 4. Plots of predicted versus experimental pKi values HQSAR (A), CoMFA (B), and CoMSIA (C) best models.
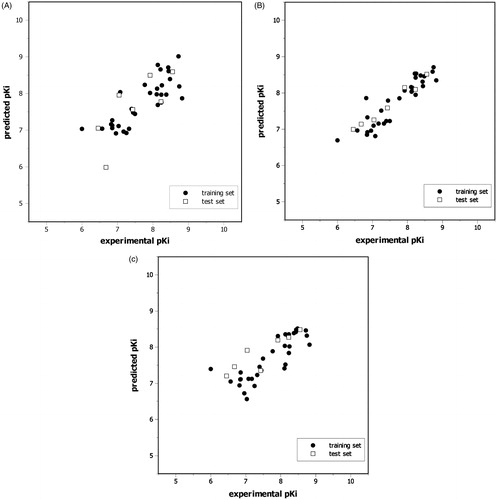
Table 5. Experimental (Exp.) and predicted (Pred.) biological activities (pKi) for the test set (Cpd).
The external validation of the HQSAR model showed good agreement between experimental and predicted pKi values ( and ). The HQSAR model obtained is robust and reliable, thus can be used to predict biological activity of novel compounds within this structural class. Both CoMFA and CoMSIA models were able to predict the activity of the test compounds with accuracy, as can be seen on and . Furthermore, the residual values were all lower than 1.00 (), reinforcing the model reliability. All constructed QSAR models showed an external validation coefficient () values higher than 0.50, which is acceptable by literatureCitation32. The calculated
values of HQSAR, CoMFA, and CoMSIA models were equals to 0.592, 0.969, and 0.781, respectively.
In order to verify the applicability domain of our models, we calculated the missing information and also plotted the scores values of first and second principal components of all models. From the first analysis, the missing information of test set compounds did not exceed 0%, 7%, and 3% for HQSAR, CoMFA, and CoMSIA models, respectively. These results indicate that the test set compounds were able to generate around 100% of descriptors used to construct the models. The principal component plots showed that all predicted activity of the test set is inside the range of the training set, suggesting that our models respect the applicability domain.
QSAR models physicochemical interpretation
HQSAR also provides information about what molecular fragments are related to the studied biological activity. This is shown as contribution maps that use color coding to represent the atomic contributions to the activity. Colors reflecting low contribution to the activity are at the red end of the spectrum, while colors reflecting favorable contribution are at the green endCitation41.
The contribution map for compound 19, a phenyl piperidine analogue which is the most potent antagonist, is shown in . The piperidine ring and its nitrogen atom, and both cyclopropane and phenyl ring attached to it contribute positively to the activity. Furthermore, other atoms such as the methylenic hydrogen adjacent to the carbamate group and the carbon of the aromatic ring connected to N-benzyl amide group also contribute positively to the activity.
Figure 5. HQSAR contribution maps for the most potent antagonist (A) and the least active antagonist (B). Green and yellow correspond to positive contributions to activity. Red and orange correspond to negative contributions to activity. The colored maps are available in online version.
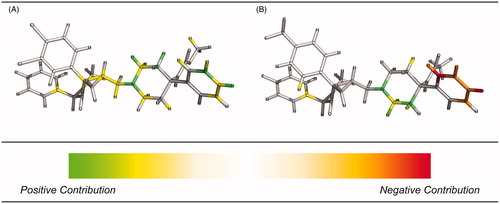
The least active antagonist, compound 6, presents an aromatic ring on the cyclopropane core (). In this case, the aromatic ring connected to the piperidine ring has negative contribution to activity, which was not observed in compound 19. We concluded that substituents on the aromatic ring connected to the cyclopropane ring influence the contribution to the activity of this ring connected to the piperidine moiety.
The results of CoMFA model can be visualized as stereochemical and electrostatic contour maps. For better interpretation, these maps are showed for the most (19) and the least active (6) compounds (). Stereochemical contours are depicted in green (favored) and yellow (disfavored), while electrostatic fields are shown in red (negative charges enhancing the activity) and blue (positive charges enhancing the activity).
Figure 6. Energy contribution maps for the most (A) and the least active antagonists (B) generated for the best CoMFA model.
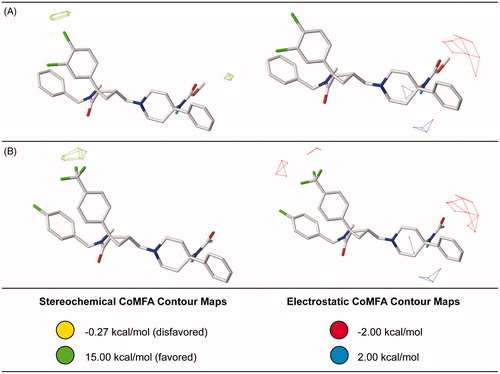
As the steric contour maps show, bulky substituents in the aromatic ring adjacent to the cyclopropane core favor the activity. This property explains the great antagonist activity of compound 19, since it has two chlorine atoms. On the other hand, the least active compound has a trifluormethyl substituent, which has smaller volume. Moreover, compound 19 has a chlorine atom as substituent in the meta position, which increases the volume in a neighboring region, probably favoring interaction with the receptor. Moreover, the methyl group attached to the carbamate is located near a green polyhedral which is not present in compound 6, indicating a steric interaction in this region.
We observed that the positive charge adjacent to the amide nitrogen favors the activity, which indicates the importance of a positively charged group in this position. These maps also show that the negatively charged area near the carbonyl has a great significance to the activity. The comparison between the two compounds highlights the advantage of a carbamate group instead of an amide moiety to increase the electron density in that region, favoring the activity.
Similar to the CoMFA analysis, CoMSIA results can also be interpreted with the aid of contour maps generated for the best model. The steric and electrostatic similarity fields are shown in and the hydrophobic, H-bond donor and H-bond acceptor fields are shown in . The steric contour map generated with the CoMSIA model showed that both carbamate group and para substituents of the phenyl attached to the cyclopropane ring have important role in the antagonist activity.
Figure 7. Steric and electrostatic contribution maps for the most (A) and the least active antagonists (B) generated for the best CoMSIA model.
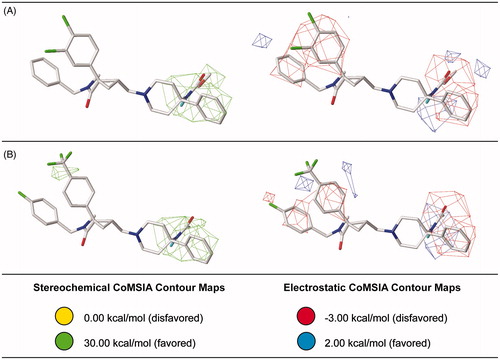
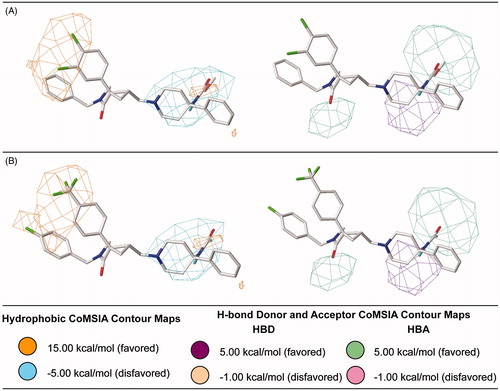
Figure 8. Hydrophobic, H-bond donor, and H-bond acceptor contribution maps for the most (A) and the least active antagonists (B) generated for the best CoMSIA model.
CoMSIA electrostatic contour maps are in agreement CoMFA results. Besides the importance of the negative partial charge around the carbonyl and the positive charge on the nitrogen of the carbamate group, this model also shows the role of a substituted aromatic ring. As said before, great electron density in the aromatic ring can improve compounds’ antagonism.
The hydrophobic contour map calculated for the CoMSIA best model shows a polar favorable region indicating that highly polar groups, such as the carbamate in compound 19, favor the activity. The aromatic substituent also influences the hydrophobicity and, therefore, the molecule efficacy. This result shows that, besides electrostatic contribution, the two chlorines can also favor the antagonism, since they have greater hydrophobic contribution in comparison with a trifluormethyl substituentCitation42,Citation43. Juhl et al.Citation4 have also observed that molecules with hydrophobic substituents are potent antagonists, while compounds with polar moieties are less active.
H-bond acceptor and donor contour maps show three favorable regions (). An H-bond acceptor in the vicinity of the carbamate methoxy region, existent only in compound 19, contributes positively to the activity, as well as the carbonyl of the amide attached to the cyclopropane core. Similarly, the amide nitrogen might play an important role on the interaction with the receptor, since it favors activity.
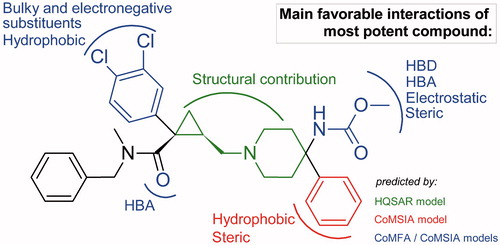
All QSAR models showed convergent physicochemical evidences of the possible interactions between NK3 antagonists and its biological targets. Due the statistical consistency of constructed models, this information (summarized in ) could be employed in the design of new NK3 antagonists.
Figure 9. Structure–activity relationship obtained from all QSAR models.
Conclusions
HQSAR, CoMFA, and CoMSIA models to predict NK3 receptor antagonism were developed and validated. All constructed models were robust (q2 = 0.644, 0.810, and 0.691, respectively) and externally predictive ( values were higher than 0.50 and all residual values of pKi prediction were lower than 1 log unity). Further physicochemical interpretation of models was based on contribution and contour maps. From these maps, we could infer that the central cyclopropane ring and the piperidine ring contribute positively to the inhibitory activity of the compounds. The di-chloro-phenyl ring attached to cyclopropane ring also contributes positively to biological activity due its high volume and hydrophobicity. The carbamate attached to piperidine ring has electrostatic contributions (CoMFA) and also contributes to H-bond donor and acceptor favored CoMSIA map. Last but not least, the carbonyl of the amide attached to the cyclopropane core also provides an H-bond favorable site to the activity. These insights show that some cores and atoms have different effects on the activity of the inhibitors and are useful for the design of new NK3 receptor antagonists.
Supplementary material available online Supplementary Figures 1-3 and Tables 1-6.
Supplemental Material.pdf
Download PDF (207.7 KB)Acknowledgements
The authors thank NAP – Univ São Paulo Center for Innovation in Diagnostics & Therapeutics (IDx&T). We also thank OpenEye Scientific Software Inc. for providing Academic License of the software (ROCs and OMEGA 2). We thank alNAP – Univ São Paulo Center for Innovation in Diagnostics & Therapeutics (IDx&T). The authors also acknowledge Prof. Dr. Marcelo S. Castilho (Federal University of Bahia/Brazil) for having provided access to Pirouette 3.11 software.
Declaration of interest
The authors would like to thank FAPESP (M. C. P. 2013/15947-3), CAPES, and CNPq (G. H. G. T. 477002/2013-7) for financial funding.
References
- WHO, World Health Organization. Mental Health: schizophrenia. Available from: http://www.who.int/mental_health/management/schizophrenia/en/ [last accessed 13 Jun 2013]
- Lisman J. Excitation, inhibition, local oscillations, or large-scale loops: what causes the symptoms of schizophrenia? Curr Opin Neurobiol 2011;22:1–8
- Spooren W, Riemer C, Meltzer H. NK3 receptor antagonists: the next generation of antipsychotics? Nat Rev Drug Discov 2005;4:967–75
- Juhl K, Hansen T, Kehler J, et al. Identification of a new series of non-peptidic NK3 receptor antagonists. Bioorg Med Chem 2011;21:1498–501
- Hoveyda HR, Roy MO, Blanc S, et al. Discovery of 3-aryl-5-acylpiperazinyl pyrazoles as antagonists to the NK3 receptor. Bioorg Med Chem 2011;21:1991–6
- Malherbe P, Knoflach F, Marcuz A, et al. Mapping the binding pocket of a novel, high-affinity, slow dissociating tachykinin NK3 receptor antagonist: biochemical and electrophysiological characterization. Neuropharmacology 2014;86:259–72
- Hanessian S, Jennequin T, Boyer N, et al. Design, synthesis, and optimization of balanced dual NK1/NK3 receptor antagonists. Med Chem Lett 2014;5:550–5
- Arroio A, Honório KM, Silva ABF. Propriedades químico-quânticas empregadas em estudos das relações estrutura-atividade. Quím Nova 2010;33:694–9
- Kiralj R, Ferreira MMC. Basic validation procedures for regression models in QSAR and QSPR studies: theory and applications. J Braz Chem Soc 2009;20:770–87
- Oprea TI. On the information content of 2D and 3D descriptors for QSAR. Braz Chem Soc 2002;13:811–5
- Gertrudes JC, Maltarollo VG, Silva RA, et al. Machine learning techniques and drug design. Curr Med Chem 2012;19:4289–97
- Cherkasov A, Muratov EN, Fourches D, et al. QSAR modeling: where have you been? Where are you going to? J Med Chem 2014;57:4977–5010
- Nagar S, Saha A. Modeling of diarylalkyl-imidazole and diarylalkyl-triazole derivatives as potent aromatase inhibitors for treatment of hormone-dependent cancer. J Comput Chem 2010;31:2342–53
- Agarwal A, Taylor EW. 3-D QSAR for intrinsic activity of 5-HT1A receptor ligands by the method of comparative molecular field analysis. J Comput Chem 2004;14:237–45
- Geldenhuysa WJ, Simmons MA. 3D-Quantitative structure-activity relationship and docking studies of the tachykinin NK3 receptor. Bioorg Med Chem Lett 2011;21:7405–11
- Geldenhuys WJ, Kuzenko SR, Simmons MA. Virtual screening to identify novel antagonists for the G protein-coupled NK3 receptor. J Med Chem 2010;53:8080–8
- ChemAxon. (2012) Marvin Sketch 5.10.13 ed
- Hawkins PCD, Skillman AG, Warren GL, et al. Conformer generation with OMEGA: algorithm and validation using high quality structures from the Protein Databank and Cambridge Structural Database. J Chem Inf Model 2010;50:572–84
- OpenEye Scientific Software (2013) OMEGA 2.5.1.4 edn. Available from: http://www.eyesopen.com
- Halgren TA. Merck molecular force field. I. Basis, form, scope, parameterization, and performance of MMFF94. J Comput Chem 1996;17:490–519
- Hawkins PCD, Skillman AG, Nicholls A. Comparison of shape-matching and docking as virtual screening tools. J Med Chem 2007;50:74–82
- OpenEye Scientific Software (2013) ROCS 3.2.0.4 edn. Available from: http://www.eyesopen.com
- Stewart JJP. Optimization of parameters for semiempirical methods I. Method J Comput Chem 1989;10:209–20
- Stewart JJP. Optimization of parameters for semiempirical methods II. Applications. J Comput Chem 1989;10:221–64
- Tripos Inc. (2013) Sybyl-X Suite 2.1.1 edn
- Fock V. Năherungsmethode zur Lasung des quantenmechanischen Mehrkarperpro-blems. Z Phys 1930;61:126–48
- Frisch MJ, Trucks GW, Schlegel HB, et al. (2004) Gaussian 03, Revision C.02
- Infometrix Inc. (2003) Pirouette 3.11 edn
- Beebe KR, Pell RJ, Seasholtz MB. Chemometrics: a practical Guide; 1998
- Ferreira MMC. Multivariate QSAR. J Braz Chem Soc 2002;13:742–53
- Schuurmann G, Ebert RU, Chen J, et al. External validation and prediction employing the predictive squared correlation coefficient test set activity mean vs training set activity mean. J Chem Inf Model 2008;48:2140–5
- Golbraikh A, Tropsha A. Beware of q2!. J Mol Graph Model 2002;20:269–76
- Guido RVC, Trossini GHG, Castilho MS, et al. Structure–activity relationships for a class of selective inhibitors of the major cysteine protease from Trypanosoma cruzi. J Enzyme Inhib Med Chem 2008;23:964–73
- Carvalho LL, Maltarollo VG, Lima EF, et al. Molecular features related to HIV integrase inhibition obtained from structure-and ligand-based approaches. PLoS One 2014;9:1–9
- Araujo SC, Maltarollo VG, Honório KM. Computational studies of TGF-βRI (ALK-5) inhibitors: analysis of the binding interactions between ligand-receptor using 2D and 3D techniques. Eur J Pharm Sci 2013;49:542–9
- Maltarollo VG, Silva DC, Honório KM. Advanced QSAR studies on PPARδ ligands related to metabolic diseases. J Braz Chem Soc 2012;23:78–84
- Cunha LB, Freitas HF, Castilho MS. Hologram-and descriptor-based QSAR studies for a series of non-azoles derivatives active against C. neoformans. J Braz Chem Soc 2013;24:1623–34
- Nantasenamat C, Isarankura-Na-Ayudhya C, Prachayasittikul V. Advances in computational methods to predict the biological activity of compounds. Expert Opin Drug Discov 2010;5:633–54
- Lowis DR. HQSAR: a new, highly Predictive QSAR Technique; 1997
- Clark M, Cramer III RD, Opdenbosch NV. Validation of the general purpose Tripos 5.2 forcefield. J Comput Chem 1989;10:982–1012
- Andricopulo AD, Salum LB. Fragment-based QSAR: perspectives in drug design. Mol Divers 2009;13:277–85
- Meylan WM, Howard PH. Estimating log P whit atom/fragments and water solubility with log P. Perspect Drug Discov Des 2000;19:67–84
- Craig PM. Interdependence between physical parameters and selection of substituent groups for correlation studies. J Med Chem 1071;14:680–4