Abstract
Objective. To examine the association between maternal and fetal genetic variants and small-for-gestational-age (SGA).
Methods. A case–control study was conducted in patients with SGA neonates (530 maternal and 436 fetal) and controls (599 maternal and 628 fetal); 190 candidate genes and 775 SNPs were studied. Single-locus, multi-locus and haplotype association analyses were performed on maternal and fetal data with logistic regression, multifactor dimensionality reduction (MDR) analysis, and haplotype-based association with 2 and 3 marker sliding windows, respectively. Ingenuity pathway analysis (IPA) software was used to assess pathways that associate with SGA.
Results. The most significant single-locus association in maternal data was with a SNP in tissue inhibitor of metalloproteinase 2 (TIMP2) (rs2277698 OR = 1.71, 95% CI [1.26–2.32], p = 0.0006) while in the fetus it was with a SNP in fibronectin 1 isoform 3 preproprotein (FN1) (rs3796123, OR = 1.46, 95% CI [1.20–1.78], p = 0.0001). Both SNPs were adjusted for potential confounders (maternal body mass index and fetal sex). Haplotype analyses resulted in associations in α 1 type I collagen preproprotein (COL1A1, rs1007086-rs2141279-rs17639446, global p = 0.006) in mothers and FN1 (rs2304573-rs1250204-rs1250215, global p = 0.045) in fetuses. Multi-locus analyses with MDR identified a two SNP model with maternal variants collagen type V α 2 (COL5A2) and plasminogen activator urokinase (PLAU) predicting SGA outcome correctly 59% of the time (p = 0.035).
Conclusions. Genetic variants in extracellular matrix-related genes showed significant single-locus association with SGA. These data are consistent with other studies that have observed elevated circulating fibronectin concentrations in association with increased risk of SGA. The present study supports the hypothesis that DNA variants can partially explain the risk of SGA in a cohort of Hispanic women.
Introduction
Neonates with a birth weight below the 10th percentile for their gestational age at delivery are considered to be small-for-gestational-age (SGA) [Citation1]. SGA is one of the ‘Great obstetrical syndromes’ [Citation2,Citation3] and it is often associated with other pregnancy complications such as preeclampsia (PE), preterm prelabor rupture of the membranes (pPROM), and preterm labor and delivery as well as increased risk of future health and developmental problems [Citation4–12]. The known maternal risk factors for SGA include race, maternal age (≥35 years), low maternal body mass index (BMI), chronic hypertension, smoking, maternal occupation, substance abuse and maternal birth weight [Citation13–32]. In addition, mechanisms of disease involved in SGA include: (1) abnormal physiologic transformation of the spiral arteries [Citation33–36]; (2) chronic uteroplacental ischemia [Citation37–47]; (3) endothelial cell dysfunction [Citation48–51]; (4) increased trophoblast apoptosis/necrosis [Citation52]; (5) intravascular inflammation [T helper 1 (Th1)-biased immune response] [Citation53–56]; and (6) an anti-angiogenic state [Citation57–74].
Multiple lines of evidence suggest that SGA may have a genetic component: (1) mothers born SGA have as much as a 50% increased risk of delivering an SGA infant [Citation15,Citation75–78]; (2) familial aggregation of SGA among siblings, especially documented sib–sib odds ratios (≥2.5) [Citation79,Citation80]; (3) racial disparity exists in the incidence of SGA, which is higher among African-Americans, Indians, and Asians compared to other racial groups [Citation14,Citation29,Citation81,Citation82]; and (4) several polymorphisms have been studied in the context of intrauterine growth restriction and SGA [Citation83–107]. Taken together, these data support a role for a genetic predisposition to SGA. Of note, in contrast to data on maternal genes, fetal genetic predisposition to SGA has been even less studied [Citation97,Citation108].
In this study, a large-scale candidate gene screen was conducted to comprehensively assess the role of genetic variations in maternal and fetal DNA on SGA risk in a Hispanic population. We examined 775 single nucleotide polymorphisms (SNPs) selected from 190 candidate genes involved in pathophysiologic pathways of SGA and other adverse pregnancy outcomes including PE, pPROM, and preterm labor and delivery with intact membranes. Single-, haplotype, and multi-locus analyses tests of association were performed in both maternal and fetal DNA samples. In addition, to better understand genetic contributions to the pathophysiology of SGA, exploratory pathway analyses were performed.
Materials and methods
Study design
This was a case–control study that included patients with SGA neonates (530 maternal and 436 fetal) and controls (599 maternal and 628 fetal). Gestational age was determined by last menstrual period or by ultrasound. In cases of discrepancies between these two measures, ultrasound dating was used. SGA was defined as a birth weight <10th percentile for the gestational age at delivery according to the Chilean birth weight distribution of a Hispanic population [Citation109]. The majority of both maternal and fetal samples were paired (406 case pairs and 578 control pairs). Controls were defined as women having a full-term pregnancy (37–42 weeks of gestation) who delivered a neonate with a birth weight between 10th and 90th percentile for the gestational age at delivery [Citation109] without complications including PE, eclampsia, HELLP syndrome, pPROM, preterm labor and delivery, large for gestational age, fetal demise, placental abruption, placenta previa, maternal sepsis, or chorioamnionitis.
Patients of Hispanic origin were recruited at the Sotero del Rio Hospital, in Puente Alto, Chile. All eligible mothers were enrolled in a research protocol, which requested permission to collect DNA from the mother and child for research purposes. The exclusion criteria included: (1) known major fetal anomalies or fetal demise; (2) multiple pregnancy; (3) serious medical illness (renal insufficiency, congestive heart disease, etc.); (4) refusal to provide written informed consent; and (5) a clinical emergency, which prevented counseling of the patient about participating in the study, such as fetal distress or maternal hemorrhage. A blood sample was obtained from the mother at the time of enrollment in the protocol, and from the umbilical cord from the fetus after delivery. Demographic and clinical characteristics of the mothers were obtained from a data collection form administered by trained medical and paramedical personnel. The collection of samples and their utilization for research purposes was approved by the Institutional Review Boards of the Sotero del Rio Hospital, Santiago, Chile (an affiliated of the Pontificia Catholic University of Santiago, Chile), and the Eunice Kennedy Shriver National Institute of Child Health and Human Development (NICHD), National Institute of Health (NIH), Department of Health and Human Services (DHHS).
Genotyping
Candidate genes were selected for analysis based on biological plausibility for a role in SGA and other pregnancy complications such as PTB, pPROM, and PE. Genes involved in processes such as the control of the immune response (pattern recognition receptors, cytokines, chemokines and their respective receptors), uteroplacental ischemia, or angiogenesis were considered appropriate candidates for this study. A complete list of the 190 genes evaluated is included in the supplemental materials (Supplementary Table 1).
SNP discovery within the candidate genes was performed by DNA sequencing at Genaissance Pharmaceuticals Inc. (New Haven, Connecticut, USA) using its index repository, which includes a total of 93 subjects with Native American, Hispanic/Latino, European, Asian, and African-American ancestry [Citation110]. To determine which individuals in the Genaissance index repository were most representative of the genetic variation observed in the Chilean population, 96 unrelated Chilean individuals who are representative of the patient cohort were sequenced for 16 DNA fragments. A subset of 42 subjects from the index repository that is heavily weighted with the Native American and Hispanic/Latino subjects (although European, Asian, and African-American subjects contributed to the subset as well) was determined to be most representative of the variation for the Chilean population, based on the correlation in the minor allele frequencies for the SNPs in 16 DNA fragments that were sequenced in both the index repository and the sample of patients from Chile (mothers delivered at the same hospital and with the same ethnicity). This subset of 42 individuals was used to select polymorphisms for the candidate genes. The SNPs selected for genotyping were intended to capture at least 90% of the haplotypic diversity of each gene covering variation in the coding regions [Citation111], 100 bases at each end of the introns, 1000 bases upstream of the start codon, and 100 bases downstream of the stop codon.
Template DNA for genotyping was obtained by whole-genome amplification [Citation112] of genomic DNA isolated from blood using an automated DNA-isolation protocol (BioRobot 9604, Qiagen, Valencia, California, USA). Genotyping was carried out using the MassARRAY® TM System (Sequenom Inc., San Diego, California, USA) at the high-throughput genotyping facility at Genaissance. Each genotyping assay involved PCR amplification from template DNA in a target region defined by specific primers for the respective polymorphic sites, purification of the amplification product, annealing of the indicated extension primer to one strand of the amplification product adjacent to the polymorphic site, extending the primer by one nucleotide using the MassEXTEND® TM reaction (Sequenom Inc.) and detection of the allele-specific extension product by mass spectrometry [Citation113].
Quality control
Univariate and multivariate distributions were evaluated for each variable to identify significant outliers. Outliers were removed only if found to be incorrect on reexamination. Each SNP was verified to ensure consistency between the genotypes of mother and offspring. Numerous programs are available for detecting relationship errors [Citation114–118]; however, to produce accurate results, these programs require genotyping for a larger proportion of the genome than was available in this study. Therefore, we considered the number of Mendelian inconsistencies between mother and fetus to identify potential relationship errors (e.g. sample mix-ups or mislabeling). When an inconsistency for an individual marker was observed, those genotypes were removed at that marker. In the case of multiple inconsistencies in a given pair, the pair was excluded for further analysis (10 pairs in controls and 5 pairs in cases). Finally, we assessed the presence of genotyping errors. In some instances, genotyping errors will lead to Mendelian inconsistencies, which can be easily identified and removed from the analysis. However, most genotyping errors for SNPs will be Mendelian consistent [Citation119]. For example, with mother–fetus pedigree structures, genotyping errors where a homozygous individual has been mistyped as a heterozygous individual will never lead to a Mendelian inconsistency for SNPs. Deviations from Hardy–Weinberg equilibrium (HWE) may indicate the presence of a genotyping error or hidden population stratification [Citation120], or reflect a biological effect such as natural selection (or other evolutionary force) and/or the association of disease and genotype [Citation121–125].
Tests for deviations from HWE were performed for mothers and fetuses separately and again separately for diagnostic subgroups. Because it is currently unclear how to unequivocally distinguish between deviations from HWE due to genotyping error and deviations from HWE due to biological causes, such as location at or near a disease susceptibility locus we noted SNPs that deviate from HWE, but we did not remove them from the analysis. If necessary, we could follow-up these observations with additional testing. We tested for population stratification in cases and controls using STRUCTURE [Citation126], which indicated that case and control Chilean samples both cluster with HapMap European samples (data not shown).
Statistical analysis
Continuous clinical and demographic characteristics of cases and controls were tested for normality using Shapiro–Wilks tests. These included gestational age, birth weight, maternal age, and BMI. All measurements deviated significantly from normality; therefore, Mann–Whitney two-sample rank sum tests were used for case–control comparisons for these traits. χ2 tests were used to test for differences in smoking, and fetal gender between cases and controls. Rank sum tests were used to test for differences in the frequency of parity and Apgar scores 1 and 5. STATA 10.0 statistical software (StataCorp, College Station, TX, USA) was used for all analyses.
Single-locus tests of association
Statistical tests for single-locus association and for deviations from HWE were calculated using PLINK statistical software [Citation127]. Statistical significance for deviations from HWE in cases and controls were determined using Fisher's Exact tests. Single-locus tests of association were performed with logistic regression using an additive genotypic model where the minor allele was coded as the risk allele, standard summary statistics, odds ratios (OR) and confidence intervals (CI), were reported for these tests of association. Prior to performing single-locus and haplotype analyses linkage disequilibrium (LD)-based SNP pruning was performed, using PLINK software, a cutoff of r2 = 0.8. Of the 775 SNPs that passed quality control (QC), we analyzed 696 maternal and 664 fetal SNPs. We also excluded a small number of X chromosome SNPs (seven total) for fetal data, as neonates included in the study were both males and females, and power is greatly reduced in both samples when analyzed separately. These criteria accounted for the difference in the number of SNPs tested in mothers and fetuses.
Multiple testing corrections
A false discovery rate (FDR) correction was performed to adjust for multiple comparisons using a q* of 0.15 in single-locus tests of association in maternal and fetal analyses separately [Citation128,Citation129]. The q* indicates the expected proportion of results that are identified as interesting, which are actually false. This is in contrast to α (typically set to 0.05), which indicates the probability of obtaining even one false positive result among all tests for which the null hypothesis is rejected. FDR is used to measure global error, that is, the expected number of false rejections of the null hypothesis among the total number of rejections. The critical significance level was calculated by ranking the results by p-values and then multiplying this rank by q* divided by the total number of tests using the step-up approach of Benjamini and Hochberg [Citation128]. The threshold q* = 0.15 is deliberately generous, for the purposes of discovery, in which false acceptance of the null is more problematic than false rejection.
Haplotype tests of association
Haplotype analyses were run on genes with at least one significantly associated SNP (p < 0.01) and at least two SNPs in the same gene. Haplotype frequencies were calculated using PLINK[Citation127] statistical software. PLINK software was used to calculate global p-values for haplotype-based association analyses for the dichotomous PTB outcome with 2 and 3 marker sliding windows. Only haplotypes that had a frequency of 0.05 were analyzed, and only SNPs that had less than 5% missing data were used. The strongest associated haplotype windows are reported (global p < 0.05) and only these were analyzed for haplotype specific effects. We present the calculation of OR for each haplotype (using the most common haplotype as referent), as well as determination of case and control haplotype frequencies. Standard summary statistics for pairwise linkage disequilibrium (LD), r2, were calculated using Haploview [Citation130,Citation131]. Haplotype blocks were assigned using the confidence interval algorithm created by Gabriel et al. [Citation132].
Multi-locus analysis
Exploratory multi-locus analyses were performed, using multifactor dimensionality reduction (MDR) to identify interactions among maternal, fetal, and maternal/fetal SNPs. MDR has been previously described in Ritchie et al. [Citation133] and is available as open source software at www.epistasis.org. Briefly, MDR is a non-parametric (does not assume any statistical model) and model free (no assumption mode of genetic inheritance) tool for identifying gene–gene interactions. MDR collapses all of the genetic data into two categories (high and low risk) by comparing all single-locus and all multi-locus combinations, and then categorizing each genotype into either high-risk or low-risk on the basis of the ratio of cases to controls that have that genotype. MDR ultimately selects one genetic model, either single or multi-locus, that most successfully predicts phenotype or disease status.
Analyses were performed: (1) separately for maternal and fetal data (tag SNPs only); and (2) combined for available maternal and fetal paired DNA samples. In our case, we analyzed 664 fetal and 696 maternal SNPs for a total of 1360 in the combined analysis. The different number of SNPs in maternal and fetal samples was due to different QC results for the two, and the fact that we did not want to remove possible interactions among genes in mothers and fetuses. Data were analyzed for two- and three-way interactions with 10-fold cross-validation and average balanced accuracy as the metrics for evaluating a model [Citation134]. Several filtering steps and parameters were explored and are described in . The MDR algorithm was implemented with the full array of tag SNPs as well as after filtering, using the Tuned ReliefF (TuRF) approach as described in detail by Moore and White [Citation135]. TuRF is a modification of ReliefF [Citation136]. Briefly, ReliefF and similar computational algorithms have been developed, primarily in the computer science and data mining fields, to provide means to screen attributes/variables on rational bases that relate to quality in terms of ability to classify an outcome. They allow the reduction in importance of those attributes that are irrelevant to an outcome and will provide noise to any subsequent analyses. Many of the developed algorithms assume independent effects, and are therefore not appropriate when there are interactions between variables that affect outcome/disease. ReliefF does not make this assumption. It is an extension of Relief and we will briefly describe Relief to provide a better understanding of the attribute election process. In Relief, an instance (in this case an individual, either case or control) is randomly selected and then the two nearest neighbors, the nearest case and the nearest control, based on the multi-locus genotype data are also selected. Attributes (alleles) that are shared with those of the same status are increased in value and those that are shared among individual of opposite classes are devalued. Unshared values of an attribute in two cases are similarly decreased in value. This is repeated a preset number of times. ReliefF is done in a similar way except instead of choosing just a single individual of the same and single individual of the opposite status an arbitrary number of individuals is selected to value the attributes. In our case, we use a sample of 10 nearest cases and 10 nearest controls on the genotype space. TuRF goes a step further and instead of just changing the attributes (e.g. SNP) values it systematically removes attributes (e.g. SNPs) that poorly differentiate cases and controls [Citation135]. The motivation behind this algorithm is that the ReliefF estimates of the true associating SNPs will improve as the non-associating SNPs are removed from the dataset. We also used SuRF (Spatially Uniform ReliefF) and TuRF to filter SNPs [Citation137]. This is an extension of TuRF that instead of using a set number of case and control nearest neighbors sets a radius around the selected individual and tests all individuals within this radius [Citation138]. In addition, SNPs were filtered based on results of the single SNP analyses and only SNPs that had a marginal p-value of ≤0.1 were included, or only those with a p-value <0.05 were analyzed separately. Permutation testing with 1000 permutations was used to determine statistical significance of all MDR models, addressing potential multiple testing issues.
Table I. Parameters explored in MDR analyses.
MDR as described above is ideal for a balanced data set where the number of cases and controls are the same or close to the same. However, computational methods have been developed since the initial development of MDR to test for prediction accuracies in an imbalanced data set [Citation134]. The method, termed balanced accuracy, corrects for imbalanced data by taking an average of the sensitivity and specificity and is defined as the arithmetic mean of sensitivity and specificity, but approaches actual accuracy as the data becomes more balanced. We tested for balanced accuracy in this manuscript.
Bioinformatics tools
The SNPper (http://snpper.chip.org) database using dbSNP Build 125 was used to determine marker positions (bp), marker function, and identify amino acid changes.
Pathway analysis
To examine whether the SNPs found to be putatively-associated with SGA mapped to different biological networks and disease functions, an exploratory analysis was performed using ingenuity pathway analysis (IPA) [Citation139–143]. The gene variants that were statistically significantly-associated with SGA in our single-locus analysis (p ≤ 0.05) were entered into the IPA analysis tool. These genes were termed ‘focus genes’. The IPA software was used to measure associations of these molecules with other molecules and disease functions stored in its knowledge base. The knowledge base includes relationships between proteins, genes, cells, tissues, xenobiotics, and diseases. The information is scientist-curated, updated, and integrated from the published literature and other databases such as OMIM, Gene Ontology, and KEGG.
The IPA functional annotations integrate GO data (http://www.geneontology.org), but the IPA knowledge base is more extensive and complete, and therefore uses different but overlapping terminology.
We used the IPA software to identify new molecular network(s) that involve our focus genes. We mapped focus genes to networks based on their mechanistic associations with each other and partner molecules. The IPA statistical algorithm identifies molecular pathways, involving these focus genes based on their selective interconnectivity with each other and additional molecules stored in the genome-scale knowledge base. These networks are illustrated and ranked by the software for significance of focus gene enrichment.
Results
Examination of demographic and clinical data () revealed significant differences between cases and controls for gestational age at delivery, birth weight, BMI, and fetal sex. We adjusted for potential confounders BMI and fetal sex in all single-locus tests of association.
Table II. Demographic and clinical characteristics of the study population.
Single-locus tests of association
A summary of the gene information for the SNPs with the most significant associations with SGA (p < 0.01) in maternal and fetal DNA is provided on . There were no significant deviations from HWE in maternal controls. There was one deviation from HWE in fetal controls at rs2304573 (p = 0.007), but this marker did not have a statistically significant deviation from HWE in cases (). The most significant single-locus association in maternal DNA was at a synonymous coding (S101S) SNP in tissue inhibitor of metalloproteinase 2 (TIMP2) (rs2277698 OR = 1.71, 95% CI [1.26–2.32], p = 0.0006). The minor allele frequency for this SNP (A) was 0.11 in cases and 0.07 in controls. This association was not significant after FDR correction ().
Table III. Gene summary information with the strongest associations (p < 0.01).
Table IV. Single-locus tests of association (p < 0.01) adjusted for fetal sex and BMI.
The most significant single-locus association in fetal DNA was an intronic SNP in fibronectin 1 isoform 3 (FN1) (rs3796123, OR = 1.46, 95% CI [1.20–1.78], p = 0.0001) (). The minor allele frequency (A) for rs3796123 in fetal DNA was reversed in cases and controls (allele frequency of 0.51 in cases and 0.44 in controls). Fetal SNP rs3796123 remained statistically significant after FDR correction. Additional SNPs that were associated with SGA at a p-value of < 0.05 are presented in . Although we have not emphasized these findings in the present report, in some instances they represent associations in pathways previously reported, (e.g. IGF1R and IGF1 in the present report and IGF2 in Nagaya et al.[Citation108]) that may lend support to previous findings or may be additional SNPs in genes reported with a p-value <0.01. Such findings strengthen the likelihood of an association because they are based on multiple SNPs for the same gene.
Table V. Single-locus tests of association (p < 0.05) adjusted for fetal sex and BMI.
Haplotype tests of association
Haplotype analyses identified six genes in maternal DNA [interleukin 6 receptor isoform 1 (IL6R), matrix metalloproteinase 9 (MMP9), α1 type I collagen preprotein (COL1A1), fibroblast growth factor 4 precursor (FGF4), coricotropin releasing hormone receptor 2 (CRHR2), and elastin (ELN)] that associated with SGA and one in fetal DNA, fibronectin 1 (FN1) (, and ). For maternal DNA haplotypes, the most significant association was a two SNP haplotype in COL1A1 rs2141279-rs17639446 (global p = 0.005). The G-G haplotype was the most significant haplotype with the strongest effect (OR = 1.92, 95% CI [1.35–2.74], p = 0.0001). This haplotype included COL1A1 SNP rs17639446, a SNP that independently associated with SGA () (p = 0.004) where the G allele was the risk allele. These two SNPs are in weak LD (r2 = 0.02 in cases and r2 = 0.01 in controls, ).
Table VI. Haplotype sliding windows association results unadjusted for covariates (p < 0.05).
Figure 1. Haploview plots of genes identified in analyses of haplotype tests of association in maternal samples. LD plots were generated in Haploview and are presented for: (A) MMP9 controls r2; (B) MMP9 cases r2; (C) COL1A1 controls r2; (D) COL1A1 cases r2; (E) IL6R controls r2; (F) IL6R cases r2; (G) FGF4 controls r2; (H) FGF4 cases r2; (I) CRHR2 r2 controls; (J) CRHR2 cases r2; (K) ELN r2 controls; (L) ELN r2 cases. Within each triangle is presented the pair-wise correlation coefficient (r2) LD plots white (r2 = 0.01 shades of grey (0 < r2 < 11 black (r2 = 1).
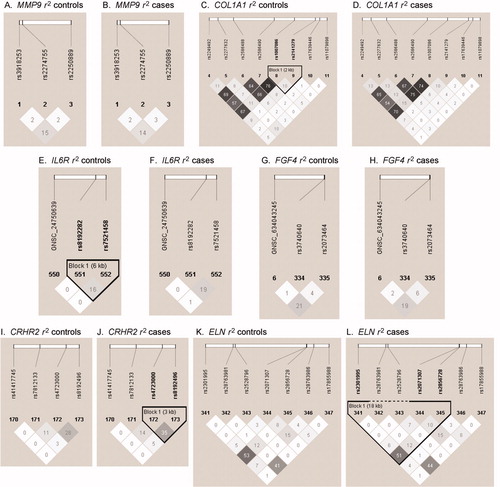
Figure 2. Haploview plots of genes identified in analyses of haplotype tests of association in fetal samples. LD plots were generated in Haploview and are presented for: (A) FN1 controls r2; (B) FN1 cases r2. Within each triangle is presented the pair-wise correlation coefficient (r2) LD plots whit1 (r2 = 01 shades of gre1 (0 < r2 <11 blac1 (r2 = 1).
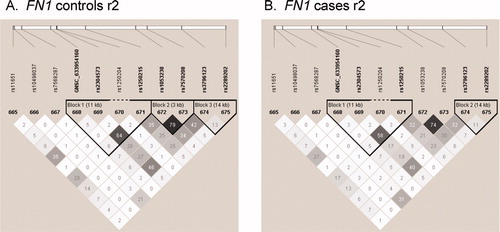
The only haplotype that showed an association in fetal DNA was in FN1, rs2304573-rs1250204-rs1250215 (global p = 0.045) with the C-G-C haplotype having the strongest association (OR = 0.36, 95% CI [0.30–0.43], p < 0.0001). One of these SNPs, rs2304573, was independently associated with SGA, although this is not the most significant FN1 SNP in single-locus analyses; the other two did not associate with predisposition to SGA (p > 0.05 for both).
Multi-locus analysis
Exploratory MDR analyses were performed using different filtering approaches as described in statistical methods. In maternal DNA, one significant two locus interaction model was identified after SuRF and TuRF filtering (GNSC_6351 48713 and rs2227562; testing balanced accuracy 0.59, p = 0.035; CVC = 10/10) (, ). GNSC_ 635148713 in collagen type V α 2 (COL5A2) and rs2227562 is in plasminogen activator urokinase (PLAU), suggesting an interaction between genes in the extracellular matrix metabolism and hemostasis.
Table VII. Summary of MDR analyses.
Figure 3. MDR schematic for 2-way interaction involving maternal SNPs GNSC_635148713 in collagen type V α2 (COL5A2) and rs2227562 in plasminogen activator urokinase (PLAU). Dark gray boxes represent high-risk genotypes and light gray boxes represent low-risk genotypes. The left hand bar in each box is the number of SGA cases with that genotype and the right bar is the number of controls with that genotypes.
There were no statistically significant multi-locus interactions (p < 0.05) in fetal DNA; however, there was one interaction between rs2076059, rs1250215, and rs1077835 that had a balanced accuracy of 0.59, p = 0.077 and a CVC of 9/10 (). rs2076059 is in selectin E (SELE), rs1250215 is in fibronectin 1 isoform 3 (FN1) and rs1077835 is in hepatic lipase (LIPC). None of these SNPs were among our strongest (p < 0.01) single-locus associations, although the fibronectin SNP rs1250215 is in LD with SNPs that associated either individually (rs2304573) or in haplotypes in our samples (r2 = 0.58 in cases and r2 = 0.64 in controls, ).
Pathway analysis
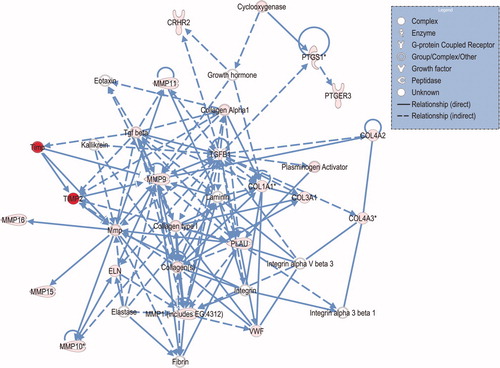
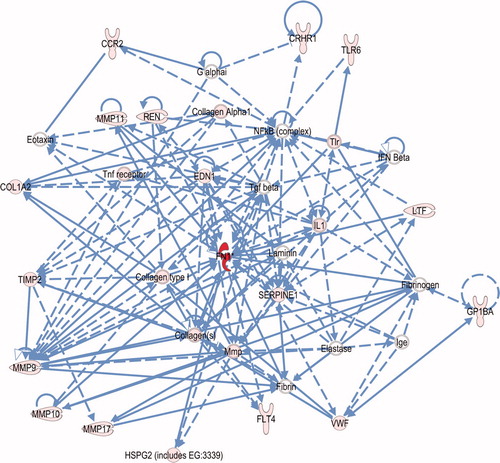
To discover novel networks of interacting molecules that could be involved in SGA, the IPA was seeded with our focus genes meeting the p < 0.05 criterion. In the mothers, the IPA network algorithm discovered that our focus biomarkers are incorporated into four highly significant networks with scores ranging between 8 and 42 (corresponding to IPA network p-values of p = 10−8 to p = 10−42 (Supplementary Table 2A). The network diagram for the top scoring network is shown in . The top ranked function of this network was connective tissue disorders, which involved regulatory interactions of TIMP2, MMPs, PLAU, collagen, and PTGS1.
Figure 4. Connection map for first ranked maternal network generated by IPA from focus gene input. The biomarkers passing the p < 0.05 significance threshold (focus molecules) were entered in to the IPA software for an unsupervised functional analysis to discern regulatory networks involving these molecules. Focus molecules are depicted in pink and the most statistically-significant molecule is in red. The asterisk indicates that there was more than one SNP probe for the gene tested and the most significant value was placed into the analysis. Solid lines show direct interaction (binding/physical contact); dashed line indirect interaction supported by the literature but possibly involving one or more intermediate molecules that have not been investigated definitively. Molecular interactions involving only binding are connected with a line without an arrowhead since directionality cannot be inferred.
Using the fetal genes as input, two highly significant networks (scoring 24 and 44), and two marginally significant networks (each scoring 3) were detected (Supplementary Table 2B). The most significant functional roles for this network were cell signaling, tissue development (including extracellular matrix remodeling), and reproductive system development. Fibronectin 1 participated in both the top scoring network () and the third-ranked network.
Figure 5. Connection map for first ranked fetal network generated by IPA from focus gene input. The biomarkers passing the p < 0.05 significance threshold (focus molecules) were entered in to the IPA software for an unsupervised functional analysis to discern regulatory networks involving these molecules. Focus molecules are depicted in pink and the most statistically-significant molecule is in red. The asterisk indicates that there was more than one SNP probe for the gene tested and the most significant value was placed into the analysis. Solid lines show direct interaction (binding/physical contact); dashed line indirect interaction supported by the literature but possibly involving one or more intermediate molecules that have not been investigated definitively. Molecular interactions involving only binding are connected with a line without an arrowhead since directionality cannot be inferred.
Discussion
Principal findings of the study
We report the results of the first, large-scale genetic association study of carefully phenotyped women with an SGA neonate from a homogeneous Hispanic population. This study identified DNA variants that predispose to SGA. The main observations were: (1) a SNP in FN1 in the fetus increased the risk for SGA; (2) haplotypes in COL1A1 and MMP9 in the mother and FN1 in the fetus were associated with SGA; (3) multi-locus analysis with MDR revealed a significant interaction between PLAU and COL5A2 in mothers; (4) pathway analysis (Supplementary Table 2) suggested that maternal and fetal genes involved in extracellular matrix function predispose to SGA; (5) Importantly, TIMP2 and FN1 were found to participate in both maternal and fetal networks along with other molecules associated with SGA. Collectively, these findings support the concept that there is a genetic component in the risk of SGA and that this risk is mediated in part by extracellular matrix function (e.g. cell adhesion, chemotaxis, collagen remodeling).
Single-locus analysis
The findings of this study support a significant role for a fibronectin genetic variant in the fetal DNA. Fibronectin is a well-documented glycoprotein present in the intrauterine tissues and cervix that interacts with extracellular matrix components including collagen and integrins [Citation144,Citation145]. It is localized at the maternal–fetal interface of the fetal membranes and decidua, acting as ‘glue’ between the chorioamniotic membranes and the uterus. The presence of high concentrations of fetal fibronectin in the amniotic fluid of asymptomatic women during second trimester has been associated with the subsequent development of severe preeclampsia and intrauterine growth restriction, suggesting involvement of extracellular matrix [Citation146,Citation147]. In vitro studies documented that excess fibronectin stimulates cell growth and reverse the established growth arrest of tumor cells [Citation148]. This supports the hypothesis that FN1 can have a role in fetal growth. Although we identified a putative association between TIMP2 and SGA in mothers, it did not remain significant after correcting for multiple testing. However, TIMP2 appears to play a central role as part of the extracellular matrix metabolism associated with SGA as documented by IPA (see below). The significance of the fetal FN1 association and the weaker association with maternal gene variants supports the view that isolated SGA is predominantly a disease of fetal origin. However, our multi-locus analyses described below do not necessarily support this.
Haplotype analyses identified novel genes predisposing to SGA
Haplotype analysis of maternal and fetal DNA revealed association between SGA and genes involved in the extracellular metabolism. Specifically, we identified significant haplotypes in MMP9 and COL1A1 in the maternal genome and FN1 in the fetal genome. In the FN1 analysis, three SNP haplotypes that are associated with SGA did not include the one SNP that showed single-locus significance after testing for multiple testing, suggesting that multiple variants in this gene may affect the risk of SGA.
MMP9 is specifically involved in the degradation of the basement membrane collagen type IV and has been documented to be associated with pregnancy complication such as spontaneous preterm birth and pPROM [Citation149–161]. MMP9 activity is essential for the of trophoblast cells invasion into the maternal endometrium and myometrium during embryo implantation [Citation162].
Exploratory analysis
SGA is syndromic in nature, and multiple mechanisms of disease are likely to be involved [Citation2,Citation3]. To address the complexity of the genetic predisposition to this phenotype, we performed two exploratory analyses. MDR explicitly addressed the potential role of interactions among genes (maternal, fetal, and maternal–fetal). The MDR results in maternal DNA indicate a significant interaction between PLAU and COL5A2. This finding is of note, because in monocytes PLAU has been shown to induce the expression of MMP9 that can promote proteolysis. In addition, maternal MMP9 SNP (rs2274755) was nominally associated with SGA. It is of note that the most significant model in maternal DNA is a two-locus model, implying that the role of the maternal genome is more complex than that of the fetal genome in affecting risk of SGA. In fetal DNA, no MDR model was statistically significant. However, MDR data provided weak evidence (p = 0.077) of epistatic interaction between SNPs in the fibronectin, selectin E and hepatic lipase genes. Taken with our other results, this lends support to the involvement of extracellular matrix and adhesion-related molecules especially through FN1.
There is an increasing realization of the importance of pathways in determining the phenotype of complex diseases. We utilized IPA to examine the contribution of genetic variants in determining networks and disease functions. In maternal IPA analysis, the top ranking network incorporated connective tissue disorders and included 18 of the genes that we found to be significantly associated with SGA (p < 0.05) in single-locus analysis. This network was highly enriched with collagens, MMPs, and their regulators including PLAU and TIMP2, further emphasizing the importance of extracellular matrix metabolism in predisposing to SGA. This network also included growth hormone, indicating a functional connection between this hormone and extracellular matrix molecules associated with SGA.
Strengths and limitations of the study
This is the largest study to examine the genetic predisposition to SGA in terms of number of subjects studied and number of genetic variants analyzed in both maternal and fetal DNA. Other strengths include a well-defined phenotype (SGA) and a homogeneous population. Importantly, we identified that both maternal and fetal DNA variants contributed to modify the risk of SGA, although only fetal single-locus results remained significant after multiple testing correction. As all studies of this type, our findings require confirmation in additional cohorts. In addition, we have not incorporated environmental variables that can potentially interact with genetic variations in our analysis that are known to play a role in the risk of SGA. Functional studies are also needed to assess the precise physiologic implications of the DNA variants identified in this study.
Conclusion
This large genetic association study of candidate genes suspected to be involved in adverse pregnancy outcome revealed that different maternal and fetal DNA variants are associated with SGA.
Supplementary Material
Download PDF (49.2 KB)Supplementary Material
Download PDF (36.6 KB)Acknowledgements
This research was supported, in part, by the Perinatology Research Branch, Division of Intramural Research, Eunice Kennedy Shriver National Institute of Child Health and Human Development, NIH, DHHS.
References
- Battaglia FC, Lubchenco LO. A practical classification of newborn infants by weight and gestational age. J Pediatr 1967;71:159–163.
- Di Renzo GC. The great obstetrical syndromes. J Matern Fetal Neonatal Med 2009;22:633–635.
- Romero R. Prenatal medicine: the child is the father of the man. 1996. J Matern Fetal Neonatal Med 2009;22:636–639.
- Albertsson-Wikland K, Karlberg J. Natural growth in children born small for gestational age with and without catch-up growth. Acta Paediatr Suppl 1994;399:64–70.
- Hokken-Koelega AC, de Ridder MA, Lemmen RJ, Den HH, De Muinck Keizer-Schrama SM, Drop SL. Children born small for gestational age: do they catch up? Pediatr Res 1995;38:267–271.
- Gazzolo D, Scopesi FA, Bruschettini PL, Marasini M, Esposito V, Di Renzo GC, de Toni E. Predictors of perinatal outcome in intrauterine growth retardation: a long term study. J Perinat Med 1994;22:71–77.
- Padoan A, Rigano S, Ferrazzi E, Beaty BL, Battaglia FC, Galan HL. Differences in fat and lean mass proportions in normal and growth-restricted fetuses. Am J Obstet Gynecol 2004;191:1459–1464.
- Verkauskiene R, Figueras F, Deghmoun S, Chevenne D, Gardosi J, Levy-Marchal M. Birth weight and long-term metabolic outcomes: does the definition of smallness matter? Horm Res 2008;70:309–315.
- Berko P, Joubert K. The effect of intrauterine development and nutritional status on perinatal mortality. J Matern Fetal Neonatal Med 2009;22:552–559.
- Hayes B, Sharif F. Behavioural and emotional outcome of very low birth weight infants – literature review. J Matern Fetal Neonatal Med 2009;22:849–856.
- Puddu M, Podda MF, Mussap M, Tumbarello R, Fanos V. Early detection of microalbuminuria and hypertension in children of very low birthweight. J Matern Fetal Neonatal Med 2009;22:83–88.
- Tome T, Guimaraes H, Bettencourt A, Peixoto JC. Neonatal morbi-mortality in very low birth weight in Europe: the Portuguese experience. J Matern Fetal Neonatal Med 2009;22(Suppl 3):85–87.
- Hackman E, Emanuel I, van BG, Daling J. Maternal birth weight and subsequent pregnancy outcome. JAMA 1983;250:2016–2019.
- Lang JM, Cohen A, Lieberman E. Risk factors for small-for-gestational-age birth in a preterm population. Am J Obstet Gynecol 1992;166:1374–1378.
- Magnus P, Bakketeig LS, Skjaerven R. Correlations of birth weight and gestational age across generations. Ann Hum Biol 1993;20:231–238.
- Rey E, Couturier A. The prognosis of pregnancy in women with chronic hypertension. Am J Obstet Gynecol 1994;171:410–416.
- Sibai BM, Gordon T, Thom E, Caritis SN, Klebanoff M, McNellis D, Paul RH. Risk factors for preeclampsia in healthy nulliparous women: a prospective multicenter study. The national institute of child health and human development network of maternal-fetal medicine units. Am J Obstet Gynecol 1995;172:642–648.
- Meis PJ, Michielutte R, Peters TJ, Wells HB, Sands RE, Coles EC, Johns KA. Factors associated with preterm birth in Cardiff, Wales. II. Indicated and spontaneous preterm birth. Am J Obstet Gynecol 1995;173:597–602.
- Savitz DA, Olshan AF, Gallagher K. Maternal occupation and pregnancy outcome. Epidemiology 1996;7:269–274.
- Goldenberg RL, Cliver SP. Small for gestational age and intrauterine growth restriction: definitions and standards. Clini Obstet Gynecol 1997;40:704–714.
- Kramer MS, Platt R, Yang H, McNamara H, Usher RH. Are all growth-restricted newborns created equal(ly)? Pediatrics 1999;103:599–602.
- Yang J, Savitz DA. The effect of vaginal bleeding during pregnancy on preterm and small-for-gestational-age births: US National Maternal and Infant Health Survey, 1988. Paediatr Perinat Epidemiol 2001;15:34–39.
- Spinillo A, Bergante C, Gardella B, Mainini R, Montanari L. Interaction between risk factors for fetal growth retardation associated with abnormal umbilical artery Doppler studies. Acta Obstet Gynecol Scand 2004;83:431–435.
- Allen VM, Joseph K, Murphy KE, Magee LA, Ohlsson A. The effect of hypertensive disorders in pregnancy on small for gestational age and stillbirth: a population based study. BMC Preg Childbirth 2004;4:17.
- Jacobsson B, Ladfors L, Milsom I. Advanced maternal age and adverse perinatal outcome. Obstet Gynecol 2004;104:727–733.
- Savitz DA, Kaufman JS, Dole N, Siega-Riz AM, Thorp JM, Jr., Kaczor DT. Poverty, education, race, and pregnancy outcome. Ethn Dis 2004;14:322–329.
- Jaquet D, Swaminathan S, Alexander GR, Czernichow P, Collin D, Salihu HM, Kirby RS, Levy-Marchal C. Significant paternal contribution to the risk of small for gestational age. BJOG 2005;112:153–159.
- Kleijer ME, Dekker GA, Heard AR. Risk factors for intrauterine growth restriction in a socio-economically disadvantaged region. J Matern Fetal Neonatal Med 2005;18:23–30.
- Odibo AO, Nelson D, Stamilio DM, Sehdev HM, Macones GA. Advanced maternal age is an independent risk factor for intrauterine growth restriction. Am J Perinatol 2006;23:325–328.
- Zetterstrom K, Lindeberg SN, Haglund B, Hanson U. Chronic hypertension as a risk factor for offspring to be born small for gestational age. Acta Obstet Gynecol Scand 2006;85:1046–1050.
- Fantuzzi G, Vaccaro V, Aggazzotti G, Righi E, Kanitz S, Barbone F, Sansebastiano G, Battaglia MA, Leoni V, et al Exposure to active and passive smoking during pregnancy and severe small for gestational age at term. J Matern Fetal Neonatal Med 2008;21:643–647.
- Bruno CJ, Locke R, Mackley A, Paul DA. The association between maternal body mass index and severity of neonatal illness in very low birth weight infants. J Matern Fetal Neonatal Med 2009;22:560–564.
- Brosens I, Dixon HG, Robertson WB. Fetal growth retardation and the arteries of the placental bed. Br J Obstet Gynaecol 1977;84:656–663.
- De Wolf F, Brosens I, Renaer M. Fetal growth retardation and the maternal arterial supply of the human placenta in the absence of sustained hypertension. Br J Obstet Gynaecol 1980;87:678–685.
- Khong TY, De Wolf F, Robertson WB, Brosens I. Inadequate maternal vascular response to placentation in pregnancies complicated by pre-eclampsia and by small-for-gestational age infants. Br J Obstet Gynaecol 1986;93:1049–1059.
- Brosens JJ, Pijnenborg R, Brosens IA. The myometrial junctional zone spiral arteries in normal and abnormal pregnancies: a review of the literature. Am J Obstet Gynecol 2002;187:1416–1423.
- Sheppard BL, Bonnar J. An ultrastructural study of utero-placental spiral arteries in hypertensive and normotensive pregnancy and fetal growth retardation. Br J Obstet Gynaecol 1981;88:695–705.
- Campbell S, Diaz-Recasens J, Griffin DR, Cohen-Overbeek TE, Pearce JM, Willson K, Teague MJ. New doppler technique for assessing uteroplacental blood flow. Lancet 1983;1:675–677.
- Harrington KF, Campbell S, Bewley S, Bower S. Doppler velocimetry studies of the uterine artery in the early prediction of pre-eclampsia and intra-uterine growth retardation. Eur J Obstet Gynecol Reprod Biol 1991;42(Suppl):S14–S20.
- Bower S, Schuchter K, Campbell S. Doppler ultrasound screening as part of routine antenatal scanning: prediction of pre-eclampsia and intrauterine growth retardation. Br J Obstet Gynaecol 1993;100:989–994.
- Harrington K, Cooper D, Lees C, Hecher K, Campbell S. Doppler ultrasound of the uterine arteries: the importance of bilateral notching in the prediction of pre-eclampsia, placental abruption or delivery of a small-for-gestational-age baby. Ultrasound Obstet Gynecol 1996;7:182–188.
- Ferrazzi E, Bulfamante G, Mezzopane R, Barbera A, Ghidini A, Pardi G. Uterine Doppler velocimetry and placental hypoxic-ischemic lesion in pregnancies with fetal intrauterine growth restriction. Placenta 1999;20:389–394.
- Albaiges G, Missfelder-Lobos H, Lees C, Parra M, Nicolaides KH. One-stage screening for pregnancy complications by color Doppler assessment of the uterine arteries at 23 weeks' gestation. Obstet Gynecol 2000;96:559–564.
- Papageorghiou AT, Yu CK, Bindra R, Pandis G, Nicolaides KH. Multicenter screening for pre-eclampsia and fetal growth restriction by transvaginal uterine artery Doppler at 23 weeks of gestation. Ultrasound Obstet Gynecol 2001;18:441–449.
- Ferrazzi E, Bellotti M, Galan H, Pennati G, Bozzo M, Rigano S, Battaglia FC. Doppler investigation in intrauterine growth restriction – from qualitative indices to flow measurements: a review of the experience of a collaborative group. Ann NY Acad Sci 2001;943:316–325.
- Rigano S, Bozzo M, Ferrazzi E, Bellotti M, Battaglia FC, Galan HL. Early and persistent reduction in umbilical vein blood flow in the growth-restricted fetus: a longitudinal study. Am J Obstet Gynecol 2001;185:834–838.
- Papageorghiou AT, Yu CK, Nicolaides KH. The role of uterine artery Doppler in predicting adverse pregnancy outcome. Best Pract Res Clin Obstet Gynaecol 2004;18:383–396.
- Bretelle F, Sabatier F, Blann A, D'Ercole C, Boutiere B, Mutin M, Boubli L, Sampol J, Dignat-George F. Maternal endothelial soluble cell adhesion molecules with isolated small for gestational age fetuses: comparison with pre-eclampsia. BJOG 2001;108:1277–1282.
- Coata G, Pennacchi L, Bini V, Liotta L, Di Renzo GC. Soluble adhesion molecules: marker of pre-eclampsia and intrauterine growth restriction. J Matern Fetal Neonatal Med 2002;12:28–34.
- Johnson MR, Anim-Nyame N, Johnson P, Sooranna SR, Steer PJ. Does endothelial cell activation occur with intrauterine growth restriction? BJOG 2002;109:836–839.
- Ness RB, Sibai BM. Shared and disparate components of the pathophysiologies of fetal growth restriction and preeclampsia. Am J Obstet Gynecol 2006;195:40–49.
- Ishihara N, Matsuo H, Murakoshi H, Laoag-Fernandez JB, Samoto T, Maruo T. Increased apoptosis in the syncytiotrophoblast in human term placentas complicated by either preeclampsia or intrauterine growth retardation. Am J Obstet Gynecol 2002;186:158–166.
- Marzi M, Vigano A, Trabattoni D, Villa ML, Salvaggio A, Clerici E, Clerici M. Characterization of type 1 and type 2 cytokine production profile in physiologic and pathologic human pregnancy. Clin Exp Immunol 1996;106:127–133.
- Hahn-Zoric M, Hagberg H, Kjellmer I, Ellis J, Wennergren M, Hanson LA. Aberrations in placental cytokine mRNA related to intrauterine growth retardation. Pediatr Res 2002;51:201–206.
- Bartha JL, Romero-Carmona R, Comino-Delgado R. Inflammatory cytokines in intrauterine growth retardation. Acta Obstet Gynecol Scand 2003;82:1099–1102.
- Kusanovic JP, Romero R, Hassan SS, Gotsch F, Edwin S, Chaiworapongsa T, Erez O, Mittal P, Mazaki-Tovi S, Soto E, et al Maternal serum soluble CD30 is increased in normal pregnancy, but decreased in preeclampsia and small for gestational age pregnancies. J Matern Fetal Neonatal Med 2007;20:867–878.
- Thadhani R, Mutter WP, Wolf M, Levine RJ, Taylor RN, Sukhatme VP, Ecker J, Karumanchi SA. First trimester placental growth factor and soluble fms-like tyrosine kinase 1 and risk for preeclampsia. J Clin Endocrinol Metab 2004;89:770–775.
- Malamitsi-Puchner A, Boutsikou T, Economou E, Sarandakou A, Makrakis E, Hassiakos D, Creatsas G. Vascular endothelial growth factor and placenta growth factor in intrauterine growth-restricted fetuses and neonates. Mediators Inflamm 2005;2005:293–297.
- Shibata E, Rajakumar A, Powers RW, Larkin RW, Gilmour C, Bodnar LM, Crombleholme WR, Ness RB, Roberts JM, Hubel CA. Soluble fms-like tyrosine kinase 1 is increased in preeclampsia but not in normotensive pregnancies with small-for-gestational-age neonates: relationship to circulating placental growth factor. J Clin Endocrinol Metab 2005;90:4895–4903.
- Boutsikou T, Malamitsi-Puchner A, Economou E, Boutsikou M, Puchner KP, Hassiakos D. Soluble vascular endothelial growth factor receptor-1 in intrauterine growth restricted fetuses and neonates. Early Hum Dev 2006;82:235–239.
- Crispi F, Dominguez C, Llurba E, Martin-Gallan P, Cabero L, Gratacos E. Placental angiogenic growth factors and uterine artery Doppler findings for characterization of different subsets in preeclampsia and in isolated intrauterine growth restriction. Am J Obstet Gynecol 2006;195:201–207.
- Girardi G, Yarilin D, Thurman JM, Holers VM, Salmon JE. Complement activation induces dysregulation of angiogenic factors and causes fetal rejection and growth restriction. J Exp Med 2006;203:2165–2175.
- Padavala S, Pope N, Baker P, Crocker I. An imbalance between vascular endothelial growth factor and its soluble receptor in placental villous explants of intrauterine growth-restricted pregnancies. J Soc Gynecol Investig 2006;13:40–47.
- Savvidou MD, Yu CK, Harland LC, Hingorani AD, Nicolaides KH. Maternal serum concentration of soluble fms-like tyrosine kinase 1 and vascular endothelial growth factor in women with abnormal uterine artery Doppler and in those with fetal growth restriction. Am J Obstet Gynecol 2006;195:1668–1673.
- Wallner W, Sengenberger R, Strick R, Strissel PL, Meurer B, Beckmann MW, Schlembach D. Angiogenic growth factors in maternal and fetal serum in pregnancies complicated by intrauterine growth restriction. Clin Sci (Lond) 2007;112:51–57.
- Chaiworapongsa T, Espinoza J, Gotsch F, Kim YM, Kim GJ, Goncalves LF, Edwin S, Kusanovic JP, Erez O, Than NG, et al The maternal plasma soluble vascular endothelial growth factor receptor-1 concentration is elevated in SGA and the magnitude of the increase relates to Doppler abnormalities in the maternal and fetal circulation. J Matern Fetal Neonatal Med 2008;21:25–40.
- Crispi F, Llurba E, Dominguez C, Martin-Gallan P, Cabero L, Gratacos E. Predictive value of angiogenic factors and uterine artery Doppler for early- versus late-onset pre-eclampsia and intrauterine growth restriction. Ultrasound Obstet Gynecol 2008;31:303–309.
- Di Renzo GC. The role of an ‘anti-angiogenic state’ in complications of pregnancy. J Matern Fetal Neonatal Med 2008;21:3–7.
- Erez O, Romero R, Espinoza J, Fu W, Todem D, Kusanovic JP, Gotsch F, Edwin S, Nien JK, Chaiworapongsa T, et al The change in concentrations of angiogenic and anti-angiogenic factors in maternal plasma between the first and second trimesters in risk assessment for the subsequent development of preeclampsia and small-for-gestational age. J Matern Fetal Neonatal Med 2008;21:279–287.
- Romero R, Nien JK, Espinoza J, Todem D, Fu W, Chung H, Kusanovic JP, Gotsh F, Erez O, Mazaki-Tovi S, et al A longitudinal study of angiogenic (placental growth factor) and anti angiogenic (soluble endoglin and soluble VEGF receptor-1) factors in normal pregnancy and patients destined to develop preeclampsia and deliver a small-for-gestational-age neonate. J Matern Fetal Neonatal Med 2008;21:9–23.
- Gotsch F, Romero R, Kusanovic JP, Chaiworapongsa T, Dombrowski M, Erez O, Than NG, Mazaki-Tovi S, Mittal P, Espinoza J, et al Preeclampsia and small-for-gestational age are associated with decreased concentrations of a factor involved in angiogenesis: soluble Tie-2. J Matern Fetal Neonatal Med 2008;21:389–402.
- Toft JH, Lian IA, Tarca AL, Erez O, Espinoza J, Eide IP, Bjorge L, Draghici S, Romero R, Austgulen R. Whole-genome microarray and targeted analysis of angiogenesis-regulating gene expression (ENG, FLT1, VEGF, PlGF) in placentas from pre-eclamptic and small-for-gestational-age pregnancies. J Matern Fetal Neonatal Med 2008;21:267–273.
- Chaiworapongsa T, Romero R, Gotsch F, Espinoza J, Nien JK, Goncalves L, Edwin S, Kim YM, Erez O, Kusanovic JP, et al Low maternal concentrations of soluble vascular endothelial growth factor receptor-2 in preeclampsia and small for gestational age. J Matern Fetal Neonatal Med 2008;21:41–52.
- Poon LC, Zaragoza E, Akolekar R, Anagnostopoulos E, Nicolaides KH. Maternal serum placental growth factor (PlGF) in small for gestational age pregnancy at 11(+0) to 13(+6) weeks of gestation. Prenat Diagn 2008;28:1110–1115.
- Ounsted M, Ounsted C. Rate of intra-uterine growth. Nature 1968;220:599–600.
- Klebanoff MA, Graubard BI, Kessel SS, Berendes HW. Low birth weight across generations. JAMA 1984;252:2423–2427.
- Klebanoff MA, Schulsinger C, Mednick BR, Secher NJ. Preterm and small-for-gestational-age birth across generations. Am J Obstet Gynecol 1997;176:521–526.
- Winkvist A, Mogren I, Hogberg U. Familial patterns in birth characteristics: impact on individual and population risks. Int J Epidemiol 1998;27:248–254.
- Wang X, Zuckerman B, Coffman GA, Corwin MJ. Familial aggregation of low birth weight among whites and blacks in the United States. N Engl J Med 1995;333:1744–1749.
- La Batide-Alanore A, Tregouet DA, Jaquet D, Bouyer J, Tiret L. Familial aggregation of fetal growth restriction in a French cohort of 7,822 term births between 1971 and 1985. Am J Epidemiol 2002;156:180–187.
- Thompson JM, Clark PM, Robinson E, Becroft DM, Pattison NS, Glavish N, Pryor JE, Wild CJ, Rees K, Mitchell EA. Risk factors for small-for-gestational-age babies: the Auckland birthweight collaborative study. J Paediatr Child Health 2001;37:369–375.
- Alexander GR, Wingate MS, Mor J, Boulet S. Birth outcomes of Asian–Indian–Americans. Int J Gynaecol Obstet 2007;97:215–220.
- Jaquet D, Tregouet DA, Godefroy T, Nicaud V, Chevenne D, Tiret L, Czernichow P, Levy-Marchal C. Combined effects of genetic and environmental factors on insulin resistance associated with reduced fetal growth. Diabetes 2002;51:3473–3478.
- Wang X, Zuckerman B, Pearson C, Kaufman G, Chen C, Wang G, Niu T, Wise PH, Bauchner H, Xu X. Maternal cigarette smoking, metabolic gene polymorphism, and infant birth weight. JAMA 2002;287:195–202.
- Johnston LB, Dahlgren J, Leger J, Gelander L, Savage MO, Czernichow P, Wikland KA, Clark AJ. Association between insulin-like growth factor I (IGF-I) polymorphisms, circulating IGF-I, and pre- and postnatal growth in two European small for gestational age populations. J Clin Endocrinol Metab 2003;88:4805–4810.
- Akisu M, Balim Z, Cetin H, Kosova B, Yalaz M, Topcuoglu N, Kultursay N. The role of angiotensin-converting enzyme and apolipoprotein-E gene polymorphisms on lipid compositions in newborn infants with intrauterine growth restriction. Early Hum Dev 2004;78:95–103.
- Infante-Rivard C. Drinking water contaminants, gene polymorphisms, and fetal growth. Environ Health Perspect 2004;112:1213–1216.
- Verspyck E, Borg JY, Le Cam-Duchez V, Goffinet F, Degre S, Fournet P, Marpeau L. Thrombophilia and fetal growth restriction. Eur J Obstet Gynecol Reprod Biol 2004;113:36–40.
- Yamada H, Sata F, Kato EH, Saijo Y, Kataoka S, Morikawa M, Shimada S, Yamada T, Kishi R, Minakami H. A polymorphism in the CYP17 gene and intrauterine fetal growth restriction. Mol Hum Reprod 2004;10:49–53.
- Adkins RM, Campese C, Vaidya R, Boyd TK. Association between fetal growth restriction and polymorphisms at sites −1 and +3 of pituitary growth hormone: a case–control study. BMC Pregn Childbirth 2005;5:2.
- Engel SA, Olshan AF, Savitz DA, Thorp J, Erichsen HC, Chanock SJ. Risk of small-for-gestational age is associated with common anti-inflammatory cytokine polymorphisms. Epidemiology 2005;16:478–486.
- Sziller I, Nguyen D, Halmos A, Hupuczi P, Papp Z, Witkin SS. An A > G polymorphism at position -670 in the Fas (TNFRSF6) gene in pregnant women with pre-eclampsia and intrauterine growth restriction. Mol Hum Reprod 2005;11:207–210.
- Engel SM, Olshan AF, Siega-Riz AM, Savitz DA, Chanock SJ. Polymorphisms in folate metabolizing genes and risk for spontaneous preterm and small-for-gestational age birth. Am J Obstet Gynecol 2006;195:1231.e1–11.
- Casano-Sancho P, Lopez-Bermejo A, Fernandez-Real JM, Monros E, Valls C, Rodriguez-Gonzalez FX, Ricart W, Ibanez L. The tumour necrosis factor (TNF)-α- 308GA promoter polymorphism is related to prenatal growth and postnatal insulin resistance. Clin Endocrinol (Oxf) 2006;64:129–135.
- Gibson CS, MacLennan AH, Janssen NG, Kist WJ, Hague WM, Haan EA, Goldwater PN, Priest K, Dekker GA. Associations between fetal inherited thrombophilia and adverse pregnancy outcomes. Am J Obstet Gynecol 2006;194:947.e1–10.
- Sata F, Yamada H, Suzuki K, Saijo Y, Yamada T, Minakami H, Kishi R. Functional maternal catechol-O-methyltransferase polymorphism and fetal growth restriction. Pharmacogenet Genomics 2006;16:775–781.
- Infante-Rivard C, Weinberg CR, Guiguet M. Xenobiotic-metabolizing genes and small-for-gestational-age births: interaction with maternal smoking. Epidemiology 2006;17:38–46.
- Dissanayake VH, Tower C, Broderick A, Stocker LJ, Seneviratne HR, Jayasekara RW, Kalsheker N, Broughton PF, Morgan L. Polymorphism in the epidermal growth factor gene is associated with birthweight in Sinhalese and white Western Europeans. Mol Hum Reprod 2007;13:425–429.
- Gremlich S, Nguyen D, Reymondin D, Hohlfeld P, Vial Y, Witkin SS, Gerber S. Fetal MMP2/MMP9 polymorphisms and intrauterine growth restriction risk. J Reprod Immunol 2007;74:143–151.
- Polydorides AD, Kalish RB, Witkin SS, Baergen RN. A fetal cyclooxygenase-2 gene polymorphism is associated with placental malperfusion. Int J Gynecol Pathol 2007;26:284–290.
- Sziller I, Babula O, Hupuczi P, Nagy B, Rigo B, Szabo G, Papp Z, Linhares IM, Witkin SS. Mannose-binding lectin (MBL) codon 54 gene polymorphism protects against development of pre-eclampsia, HELLP syndrome and pre-eclampsia-associated intrauterine growth restriction. Mol Hum Reprod 2007;13:281–285.
- Adkins RM, Krushkal J, Klauser CK, Magann EF, Morrison JC, Somes G. Association between small for gestational age and paternally inherited 5′ insulin haplotypes. Int J Obes (Lond) 2008;32:372–380.
- Delpisheh A, Topping J, Reyad M, Tang A, Brabin BJ. Prenatal alcohol exposure, CYP17 gene polymorphisms and fetal growth restriction. Eur J Obstet Gynecol Reprod Biol 2008;138:49–53.
- Furness DL, Fenech MF, Khong YT, Romero R, Dekker GA. One-carbon metabolism enzyme polymorphisms and uteroplacental insufficiency. Am J Obstet Gynecol 2008;199:276–278.
- Delpisheh A, Brabin L, Topping J, Reyad M, Tang AW, Brabin BJ. A case–control study of CYP1A1, GSTT1 and GSTM1 gene polymorphisms, pregnancy smoking and fetal growth restriction. Eur J Obstet Gynecol Reprod Biol 2009;143:38–42.
- Aagaard-Tillery K, Spong CY, Thom E, Sibai B, Wendel G, Jr., Wenstrom K, Samuels P, Simhan H, Sorokin Y, Miodovnik M, et al Pharmacogenomics of maternal tobacco use: metabolic gene polymorphisms and risk of adverse pregnancy outcomes. Obstet Gynecol 2010;115:568–577.
- Bodnar LM, Catov JM, Zmuda JM, Cooper ME, Parrott MS, Roberts JM, Marazita ML, Simhan HN. Maternal serum 25-hydroxyvitamin D concentrations are associated with small-for-gestational age births in white women. J Nutr 2010;140:999–1006.
- Nagaya K, Makita Y, Taketazu G, Okamoto T, Nakamura E, Hayashi T, Fujieda K. Paternal allele of IGF2 gene haplotype CTG is associated with fetal and placental growth in Japanese. Pediatr Res 2009;66:135–139.
- Gonzalez RP, Gomez RM, Castro RS, Nien JK, Merino PO, Etchegaray AB, Carstens MR, Medina LH, Viviani PG, Rojas IT. [A national birth weight distribution curve according to gestational age in Chile from 1993 to 2000]. Rev Med Chil 2004;132:1155–1165.
- Stephens JC, Schneider JA, Tanguay DA, Choi J, Acharya T, Stanley SE, Jiang R, Messer CJ, Chew A, Han JH, et al Haplotype variation and linkage disequilibrium in 313 human genes. Science 2001;293:489–493.
- Judson R, Salisbury B, Schneider J, Windemuth A, Stephens JC. How many SNPs does a genome-wide haplotype map require? Pharmacogenomics 2002;3:379–391.
- Kuivaniemi H, Yoon S, Shibamura H, Skunca M, Vongpunsawad S, Tromp G. Primer-extension preamplified DNA is a reliable template for genotyping. Clin Chem 2002;48:1601–1604.
- Winkelmann BR, Hoffmann MM, Nauck M, Kumar AM, Nandabalan K, Judson RS, Boehm BO, Tall AR, Ruano G, Marz W. Haplotypes of the cholesteryl ester transfer protein gene predict lipid-modifying response to statin therapy. Pharmacogenomics J 2003;3:284–296.
- Boehnke M, Cox NJ. Accurate inference of relationships in sib-pair linkage studies. Am J Hum Genet 1997;61:423–429.
- Goring HH, Ott J. Relationship estimation in affected sib pair analysis of late-onset diseases. Eur J Hum Genet 1997;5:69–77.
- Olson JM. Relationship estimation by Markov-process models in a sib-pair linkage study. Am J Hum Genet 1999;64:1464–1472.
- Epstein MP, Duren WL, Boehnke M. Improved inference of relationship for pairs of individuals. Am J Hum Genet 2000;67:1219–1231.
- Abecasis GR, Cherny SS, Cookson WO, Cardon LR. GRR: graphical representation of relationship errors. Bioinformatics 2001;17:742–743.
- Douglas JA, Skol AD, Boehnke M. Probability of detection of genotyping errors and mutations as inheritance inconsistencies in nuclear-family data. Am J Hum Genet 2002;70:487–495.
- Lee WC. Detecting population stratification using a panel of single nucleotide polymorphisms. Int J Epidemiol 2003;32:1120.
- Feder JN, Gnirke A, Thomas W, Tsuchihashi Z, Ruddy DA, Basava A, Dormishian F, Domingo R, Jr., Ellis MC, Fullan A, et al A novel MHC class I-like gene is mutated in patients with hereditary haemochromatosis. Nat Genet 1996;13:399–408.
- Nielsen DM, Ehm MG, Weir BS. Detecting marker-disease association by testing for Hardy-Weinberg disequilibrium at a marker locus. Am J Hum Genet 1998;63:1531–1540.
- Wittke-Thompson JK, Pluzhnikov A, Cox NJ. Rational inferences about departures from Hardy-Weinberg equilibrium. Am J Hum Genet 2005;76:967–986.
- Trikalinos TA, Salanti G, Khoury MJ, Ioannidis JP. Impact of violations and deviations in Hardy-Weinberg equilibrium on postulated gene-disease associations. Am J Epidemiol 2006;163:300–309.
- Ryckman KK, Jiang L, Li C, Bartlett J, Haines JL, Williams SM. A prevalence-based association test for case–control studies. Genet Epidemiol 2008;32:600–605.
- Pritchard JK, Stephens M, Donnelly P. Inference of population structure using multilocus genotype data. Genetics 2000;155:945–959.
- Purcell S, Neale B, Todd-Brown K, Thomas L, Ferreira MA, Bender D, Maller J, Sklar P, de Bakker PI, Daly MJ, et al PLINK: a tool set for whole-genome association and population-based linkage analyses. Am J Hum Genet 2007;81:559–575.
- Benjamini Y, Hochberg Y. Controlling the false discovery rate: a practical and powerful approach to multiple testing. J Roy Statist Soc Ser B 1995;57:289–300.
- Benjamini Y, Drai D, Elmer G, Kafkafi N, Golani I. Controlling the false discovery rate in behavior genetics research. Behav Brain Res 2001;125:279–284.
- Devlin B, Risch N. A comparison of linkage disequilibrium measures for fine-scale mapping. Genomics 1995;29:311–322.
- Barrett JC, Fry B, Maller J, Daly MJ. Haploview: analysis and visualization of LD and haplotype maps. Bioinformatics 2005;21:263–265.
- Gabriel SB, Schaffner SF, Nguyen H, Moore JM, Roy J, Blumenstiel B, Higgins J, DeFelice M, Lochner A, Faggart M, et al The structure of haplotype blocks in the human genome. Science 2002;296:2225–2229.
- Ritchie MD, Hahn LW, Roodi N, Bailey LR, Dupont WD, Parl FF, Moore JH. Multifactor-dimensionality reduction reveals high-order interactions among estrogen-metabolism genes in sporadic breast cancer. Am J Hum Genet 2001;69:138–147.
- Velez DR, White BC, Motsinger AA, Bush WS, Ritchie MD, Williams SM, Moore JH. A balanced accuracy function for epistasis modeling in imbalanced datasets using multifactor dimensionality reduction. Genet Epidemiol 2007;31:306–315.
- Moore JH, White BC. Tuning ReliefF for Genome-Wide Genetic Analysis. In: Marchiori E, Moore JH, Rajapakse JC, editors. Evolutionary Computation, Machine Learning and Data Mining in Bioinformatics. Heidelberg: Springer Berlin; 2007. pp. 166–175.
- Kira K, Rendell LA. A Practical Approach to Feature Selection. In: Sleeman D, Edwards P, editors. Proceedings of the Ninth International Workshop on Machine Learning. Aberdeen: Morgan-Kaufman; 1992; pp. 249–256.
- Greene CS, Penrod NM, Kiralis J, Moore JH. Spatially uniform reliefF (SURF) for computationally-efficient filtering of gene–gene interactions. Bio Data Min 2009;2:5.
- Moore JH, Asselbergs FW, Williams SM. Bioinformatics challenges for genome-wide association studies. Bioinformatics 2010;26:445–455.
- Calvano SE, Xiao W, Richards DR, Felciano RM, Baker HV, Cho RJ, Chen RO, Brownstein BH, Cobb JP, Tschoeke SK, et al A network-based analysis of systemic inflammation in humans. Nature 2005;437:1032–1037.
- Kuijl C, Savage ND, Marsman M, Tuin AW, Janssen L, Egan DA, Ketema M, van den NR, van den Eeden SJ, Geluk A, et al Intracellular bacterial growth is controlled by a kinase network around PKB/AKT1. Nature 2007;450:725–730.
- Loza MJ, McCall CE, Li L, Isaacs WB, Xu J, Chang BL. Assembly of inflammation-related genes for pathway-focused genetic analysis. PLoS One 2007;2:e1035.
- Winn VD, Haimov-Kochman R, Paquet AC, Yang YJ, Madhusudhan MS, Gormley M, Feng KT, Bernlohr DA, McDonagh S, Pereira L, et al Gene expression profiling of the human maternal–fetal interface reveals dramatic changes between midgestation and term. Endocrinology 2007;148:1059–1079.
- Menon R, Pearce B, Velez DR, Merialdi M, Williams SM, Fortunato SJ, Thorsen P. Racial disparity in pathophysiologic pathways of preterm birth based on genetic variants. Reprod Biol Endocrinol 2009;7:62.
- Dunn PA, Feinberg RF. Oncofetal fibronectin: new insight into the physiology of implantation and labor. J Obstet Gynecol Neonatal Nurs 1996;25:753–757.
- Koenn ME. Fetal fibronectin. Clin Lab Sci 2002;15:96–98, 115.
- Kupferminc MJ, Peaceman AM, Wigton TR, Rehnberg KA, Socol ML. Fetal fibronectin levels are elevated in maternal plasma and amniotic fluid of patients with severe preeclampsia. Am J Obstet Gynecol 1995;172:649–653.
- Sakura M, Nakabayashi M, Takeda Y, Sato K. Elevated fetal fibronectin in midtrimester amniotic fluid is involved with the onset of preeclampsia. J Obstet Gynaecol Res 1998;24:73–76.
- Williams CM, Engler AJ, Slone RD, Galante LL, Schwarzbauer JE. Fibronectin expression modulates mammary epithelial cell proliferation during acinar differentiation. Cancer Res 2008;68:3185–3192.
- Vadillo-Ortega F, Gonzalez-Avila G, Furth EE, Lei H, Muschel RJ, Stetler-Stevenson WG, Strauss JF, III. 92-kd type IV collagenase (matrix metalloproteinase-9) activity in human amniochorion increases with labor. Am J Pathol 1995;146:148–156.
- Vadillo OF, Arechevaleta F, Beltran MJ. [Apoptosis and extracellular matrix degradation in chorio-amnion during labor and premature membrane rupture]. Ginecol Obstet Mex 1998;66:202–207.
- Athayde N, Romero R, Gomez R, Maymon E, Pacora P, Mazor M, Yoon BH, Fortunato S, Menon R, Ghezzi F, et al Matrix metalloproteinases-9 in preterm and term human parturition. J Matern Fetal Med 1999;8:213–219.
- Maymon E, Romero R, Pacora P, Gervasi MT, Gomez R, Edwin SS, Yoon BH. Evidence of in vivo differential bioavailability of the active forms of matrix metalloproteinases 9 and 2 in parturition, spontaneous rupture of membranes, and intra-amniotic infection. Am J Obstet Gynecol 2000;183:887–894.
- Arechavaleta-Velasco F, Mayon-Gonzalez J, Gonzalez-Jimenez M, Hernandez-Guerrero C, Vadillo-Ortega F. Association of type II apoptosis and 92-kDa type IV collagenase expression in human amniochorion in prematurely ruptured membranes with tumor necrosis factor receptor-1 expression. J Soc Gynecol Investig 2002;9:60–67.
- Romero R, Chaiworapongsa T, Espinoza J, Gomez R, Yoon BH, Edwin S, Mazor M, Maymon E, Berry S. Fetal plasma MMP-9 concentrations are elevated in preterm premature rupture of the membranes. Am J Obstet Gynecol 2002;187:1125–1130.
- Xu P, Alfaidy N, Challis JR. Expression of matrix metalloproteinase (MMP)-2 and MMP-9 in human placenta and fetal membranes in relation to preterm and term labor. J Clin Endocrinol Metab 2002;87:1353–1361.
- Goldman S, Weiss A, Eyali V, Shalev E. Differential activity of the gelatinases (matrix metalloproteinases 2 and 9) in the fetal membranes and decidua, associated with labour. Mol Hum Reprod 2003;9:367–373.
- Makrakis E, Grigoriou O, Kouskouni E, Vitoratos N, Salamalekis E, Chatzoudi E, Creatsas G. Matrix metalloproteinase-9 and tissue inhibitor of metalloproteinase-1 in plasma/serum and urine of women during term and threatened preterm labor: a clinical approach. J Matern Fetal Neonatal Med 2003;14:170–176.
- Li W, Challis JR. Corticotropin-releasing hormone and urocortin induce secretion of matrix metalloproteinase-9 (MMP-9) without change in tissue inhibitors of MMP-1 by cultured cells from human placenta and fetal membranes. J Clin Endocrinol Metab 2005;90:6569–6574.
- Vadillo-Ortega F, Estrada-Gutierrez G. Role of matrix metalloproteinases in preterm labour. BJOG 2005;112(Suppl 1):19–22.
- Yonemoto H, Young CB, Ross JT, Guilbert LL, Fairclough RJ, Olson DM. Changes in matrix metalloproteinase (MMP)- 2 and MMP-9 in the fetal amnion and chorion during gestation and at term and preterm labor. Placenta 2006;27:669–677.
- Sorokin Y, Romero R, Mele L, Wapner RJ, Iams JD, Dudley DJ, Spong CY, Peaceman AM, Leveno KJ, Harper M, Caritis SN, Miodovnik M, Mercer BM, Thorp JM, O'Sullivan MJ, Ramin SM, Carpenter MW, Rouse DJ, Sibai B. Maternal serum interleukin-6, c-reactive protein, and matrix metalloproteinase-9 concentrations as risk factors for preterm birth <32 weeks and adverse neonatal outcomes. Am J Perinatol 2010;Mar 1: [Epub ahead of print].
- Campbell S, Rowe J, Jackson CJ, Gallery ED. In vitro migration of cytotrophoblasts through a decidual endothelial cell monolayer: the role of matrix metalloproteinases. Placenta 2003;24:306–315.